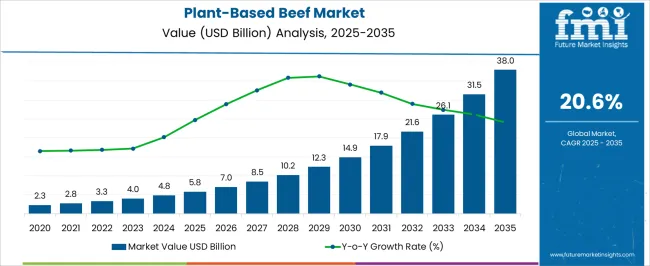
The Plant-Based Beef Market is estimated to be valued at USD 5.8 billion in 2025 and is projected to reach USD 38.0 billion by 2035, registering a compound annual growth rate (CAGR) of 20.6% over the forecast period.
| Metric | Value |
|---|---|
| Plant-Based Beef Market Estimated Value in (2025 E) | USD 5.8 billion |
| Plant-Based Beef Market Forecast Value in (2035 F) | USD 38.0 billion |
| Forecast CAGR (2025 to 2035) | 20.6% |
The plant-based beef market is experiencing rapid expansion as a result of growing environmental concerns, ethical considerations, and heightened awareness surrounding the health impacts of traditional red meat consumption. The rise of flexitarian and vegan dietary preferences has prompted food innovation in meat analogs, with plant-based beef products gaining prominence for their ability to mimic the taste, texture, and nutritional profile of conventional beef.
Food manufacturers have intensified investments in flavor enhancement, texture technologies, and clean-label formulations to cater to a broader consumer base. Government incentives and regulatory support for sustainable agriculture and plant-based food innovation are further enabling this growth trajectory.
Supply chain improvements and partnerships between food-tech companies and major foodservice providers have also contributed to expanded market penetration With rising concerns about livestock emissions and resource-intensive meat production, plant-based beef is positioned as a viable alternative in both emerging and mature markets, paving the way for continued innovation and mainstream acceptance.
The market is segmented by Product Type, Source, and Distribution Channel and region. By Product Type, the market is divided into Burger Patty, Crumbles & Grounds, Sausages, Hot Dogs, Nuggets, Bacon Chips, Deli Slices, Chunks & Tips, Shreds, Cutlet, Strips, Tenders, & Fingers, and Meatballs. In terms of Source, the market is classified into Soy-based Protein, Wheat-based Protein, Pea-based Protein, Canola-based Protein, Fava Bean-based Protein, Potato-based Protein, Rice-based Protein, Lentil-based Protein, Flax-based Protein, Chia-based Protein, and Corn-based Protein. Based on Distribution Channel, the market is segmented into Retail, Online Retail, and HoReCa. Regionally, the market is classified into North America, Latin America, Western Europe, Eastern Europe, Balkan & Baltic Countries, Russia & Belarus, Central Asia, East Asia, South Asia & Pacific, and the Middle East & Africa.
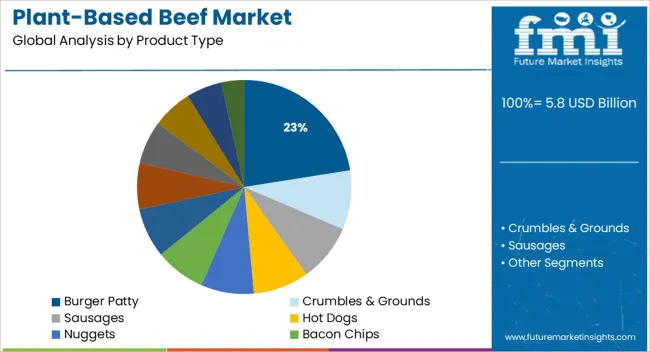
The burger patty segment is projected to contribute 22.5% of the total revenue share in the plant-based beef market in 2025, securing its position as the leading product type. This segment has gained prominence due to the widespread appeal and familiarity of burgers among consumers, which has facilitated easier acceptance of meat alternatives in quick-service and casual dining settings.
The ability of burger patties to closely replicate the taste, appearance, and mouthfeel of traditional beef through advanced extrusion and flavoring techniques has further strengthened their market position. Additionally, the segment benefits from high visibility and promotional strategies across retail shelves and foodservice menus, accelerating consumer trials.
Continued product launches focused on clean-label formulations and allergen-friendly ingredients have broadened its accessibility The rising trend of convenient, ready-to-cook plant-based foods and the alignment of burger patties with Western eating habits have also contributed significantly to segmental dominance, reinforcing their role as a gateway product in the adoption of plant-based proteins.
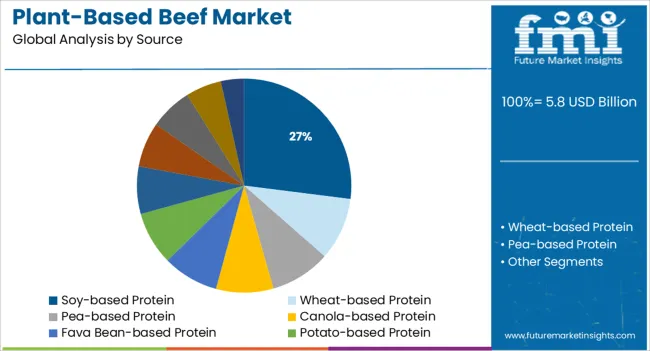
Soy-based protein is expected to account for 27.0% of the total revenue share in the plant-based beef market in 2025, reflecting its continued leadership as a preferred source ingredient. This dominance is attributed to soy's well-established functional and nutritional profile, including its complete amino acid composition and high protein digestibility. The ingredient's versatility in texture replication and its ability to absorb flavors efficiently have made it a staple in the formulation of plant-based beef products.
Its wide availability and cost-effectiveness relative to other alternative proteins have facilitated large-scale commercial production. Furthermore, soy-based formulations have benefited from technological enhancements in reducing off-flavors and improving binding properties, enhancing the consumer eating experience.
As sustainability remains a core concern, soy’s relatively lower land and water footprint compared to animal protein sources continues to support its inclusion in mainstream plant-based offerings These advantages have ensured soy’s leading role in the evolving landscape of meat analogs.
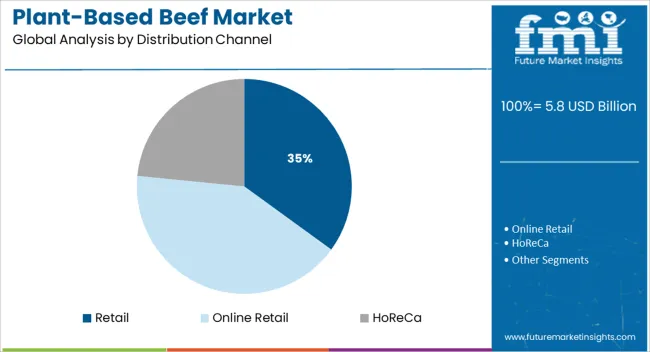
The retail distribution segment is projected to hold 35.0% of the total revenue share in the plant-based beef market in 2025, making it the most dominant distribution channel. This segment’s strong performance is supported by the increasing placement of plant-based beef products in major supermarket chains, specialty health food stores, and online grocery platforms. Rising consumer preference for at-home meal preparation and health-conscious eating has amplified retail demand, particularly as plant-based beef options become more widely available and competitively priced.
In-store marketing initiatives, such as dedicated plant-based sections and promotional campaigns, have played a critical role in educating and attracting mainstream consumers. The expansion of direct-to-consumer models and e-commerce partnerships has further extended reach, especially among urban and tech-savvy demographics.
Innovations in packaging for extended shelf life and sustainability have also aligned well with consumer expectations in retail environments As awareness of plant-based diets grows, retail channels are expected to remain central to the category’s expansion across diverse consumer segments.
| Market Statistics | Details |
|---|---|
| H1,2025 (A) | 22.5% |
| H1,2025 Projected (P) | 22.7% |
| H1,2025 Outlook (O) | 25.0% |
| BPS Change : H1,2025 (O) - H1,2025 (P) | (+) 227 ↑ |
| BPS Change : H1,2025 (O) - H1,2025 (A) | (+) 249.7 ↑ |
Plant-based beef is the latest trend in the food industry. Restaurants and grocery stores are beginning to offer plant-based meat products as a viable alternative to traditional beef. These products are made from plants, but they look and taste like real beef. Proponents of plant-based beef argue that it is healthier and more sustainable than traditional beef. Critics say that plant-based beef is not as nutritious as real beef and that it is more expensive.
In a major product launch, Beyond Meat has debuted its plant-based beef. The company is billing the new product as a revolutionary way to enjoy a classic dish. "Our plant-based beef is not only better for you and the planet, but it also tastes delicious," said Ethan Brown, founder, and CEO of Beyond Meat. "We're excited to finally give people a real alternative to conventional meat."
The plant-based beef is made with ingredients like pea protein isolate, canola oil, and beet juice extract. It's designed to look, cook, and taste just like traditional ground beef. Beyond Meat says that its product is perfect for burgers, tacos, chili, and more.
To appeal to the environmentally conscious consumer, a new plant-based meat product is set to launch. The company, which has not been named yet, plans to debut its product at the end of this year. This will be the first time a major food company has released a vegetarian replacement for beef that looks and tastes like the real thing.
The plant-based meat will be made out of soy and wheat protein and will require no refrigeration. It is also cholesterol free and low in fat. The creators of the product are hoping to tap into the growing market for vegetarianism and veganism, which is currently valued at USD 3.5 billion in the United States alone.
While some vegetarians may balk at eating a product that is made to look and taste like meat, others may appreciate not having to sacrifice flavor or texture to live a vegetarian lifestyle.
The plant-based meat market was valued at USD 5.8 billion in 2025 the market grew at a steady CAGR of 22.6% between 2020 and 2025. The growth of the market during this period is fueled by health benefits.
The consumption of plant-based meat has an advantage over actual meat products. Beef meat contains more saturated fat, cholesterol, and calories than a plant-based diet. Recent research shows that this could induce diet-related disorders such as obesity, type 2 diabetes, heart disease, and some malignancies. Consumption of plant-based meat, on the other hand, does not result in the development of such disorders. Furthermore, they contribute to the development of stronger immunity.
During the historical period, the above factors raised the consumer penchant for plant-based beef. This positive impact on the market is projected to carry forward into the current forecast period. However, the surge of sales between 2020 to 2025, is expected to slow down, with waning market momentum. The market is projected to slightly depreciate between 2025 to 2035.
Short Term (2025 to 2029): Currently, regulatory restrictions for alternative proteins, mostly plant-based protein products, have been relaxed in various nations. The FDA, for example, has loosened its rules for selling plant-based meat products on the market, which were prohibited previously due to labeling concerns. This is expected to drive easy accessibility to plant-based alternatives, boosting the market prospects.
Medium Term (2029 to 2035): Research & development, and innovations fuelled by public-private partnerships are projected to improve product versatility. Key players are consistently attempting to change the popular perception of plant meats tasting bad. With the introduction of better product variants, consumer perception is expected to radically shift.
Long Term (2035 to 2035): Long-term growth prospects are reliant on the key player’s ability to reach out to an untapped consumer base. Currently, not even half of the market potential has been realized in developing regions. Manufacturers need to develop region-specific, affordable products to break into the Asia-Pacific, Latin American, and MEA markets.
During the forecast period, the market is expected to grow at a CAGR of 20.6%.
People are eating vegetables, legumes, fruits, and nuts as a result of the plant-based trend. There are also a variety of health benefits linked with plant-based beef products, which people are becoming more aware of in recent years as one of the most important elements driving global demand for plant-based meat products.
Many large economies have witnessed a significant increase in the vegan population. The nutritional benefits of plant-based meats when compared to regular meat, as well as their safety, are major considerations that have helped them acquire public attention.
Because of the health benefits of plant-based meat alternatives as well as the environmental concerns associated with animal-based meat, government authorities in many nations are pushing their consumption.
Globally, government agencies are investing heavily in plant-based meat research and development.
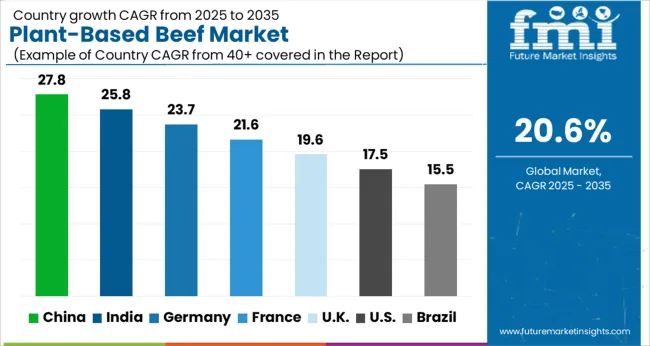
The United States showed the largest market share in 2025, and this trend is expected to continue during the forecast period. In developed countries with big populations such as the United States and Canada, there is a lot of awareness about plant-based meat benefits.
Consumers are becoming more health-conscious, and there are concerns about the environmental impact of meat production. Consumers are becoming aware of their food consumption and taking the required efforts to reduce their unneeded fat intake in their regular diet. As a result, a substantial number of customers have stopped eating beef and have become vegans.
Plant-based alternatives are being researched in the United States to make them more meat-like in texture. Plant-based meat products are seen as healthier alternatives to meat products, allowing people to eat burgers and nuggets without feeling guilty. As a result, new product introductions are expected to have an impact on the region's plant-based beef meat industry's growth.
During the forecast period, the US market is expected to grow at a CAGR of 20.0% to reach a valuation of USD 38 Billion by 2035.
The United Kingdom consumes meat daily, and they are concerned about eating a healthy diet. The United Kingdom markets are expected to develop at a CAGR of 12.8 percent over the projection period. It is Europe's largest market for plant-based meat consumption, accounting for over 40% of the European plant-based meat market. The rise of the ethical focus of the consumer, led by the millennial age and the advent of the flexitarian consumer, is a crucial element in the expansion of the plant-based business, particularly in the UK.
The significance of value-adding crops like pulses and legumes as ingredients for products like plant-based meat - rather than farmers selling their crops into unpredictable commodity markets - is becoming more generally recognized in the Australian farming sector. Australia possesses the agricultural capacity, commercial demand, and research know-how necessary to become a global leader in novel protein businesses, such as plant-based meat.
Australian-grown plant protein components and processing are in high demand. Plant protein components are becoming increasingly popular in a variety of market areas, including baked goods, snacks, and sports nutrition products.
China already has many meat substitutes. Tofu-based foods are already commonly seen at meals in China. Aside from tofu-based items, Buddhist monks have a long history of making imitation meats, which are usually manufactured from soybeans and wheat gluten and resemble meat but don't taste like it. In cities around China, there are Buddhist-run eateries that serve only faux meats. Many people are wary of meat because of past outbreaks of swine sickness and avian flu.
During the forecast period, the market is expected to grow at a CAGR of 18.1% to reach a valuation of USD 1.4 Billion.
| Regions | North America |
|---|---|
| Countries | United States |
| CAGR | 20.0% |
| Market Value (2035) | USD 38 Billion |
| Regions | North America |
|---|---|
| Countries | Canada |
| CAGR | 27.2% |
| Market Value (2035) | USD 571.8 Million |
| Regions | Asia Pacific |
|---|---|
| Countries | China |
| CAGR | 18.1% |
| Market Value (2035) | USD 1.4 Billion |
| Regions | Asia Pacific |
|---|---|
| Countries | South Korea |
| CAGR | 22.0% |
| Market Value (2035) | USD 290.4 Million |
| Regions | Asia Pacific |
|---|---|
| Countries | Japan |
| CAGR | 19.2% |
| Market Value (2035) | USD 457.0 Million |
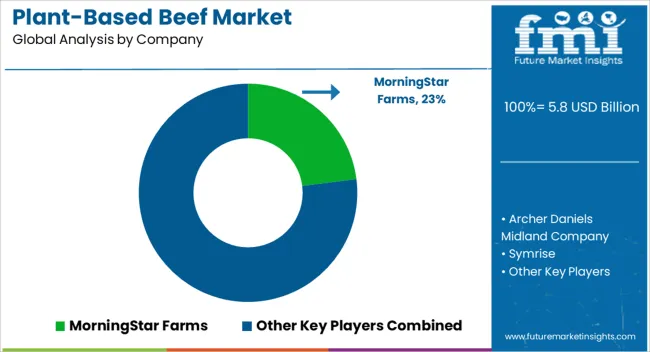
Plant-based beef has many of the same properties as beef. It has features that are the same as those of beef. Soy and wheat are used to make beef-related plant-based items such as meat-free beef bits, no-beef burgers, beef watercress, and beefsteak. In addition, manufacturers are working on new product introductions to suit the need of vegetarian consumers.
Plant-based beef is categorized into products like Burger, Jerky, Patty, and potpie. Due to speedier manufacturing, flavor, convenience, and abundant supply, the burger patties category led the market, this trend is expected to continue during the projection period. Burger patties are becoming increasingly popular on store shelves.
During the forecast period, the wheat-sourced segment is projected to dominate the market at a CAGR of 21.6%.
Wheat being one of the most preferred cereals globally is easily gaining wide acceptance amongst consumers. It is also deemed by consumers as a rich source of vitamins, minerals, antioxidants, and fiber. It is also one of the most preferred sources of plant-based protein. Many key players are showing a preference for wheat due to its taste, texture, and likeability to meat, when used in sausages, patties, and nuggets.
Globally, meat-based burger patties are deemed consumer favorites. Due to its unequivocal popularity in developed and developing nations alike, plant-based beef burger patties are a consumer favorite.
Plant-based beef burger patties are easier to create and bear high likeliness to beef patties. It can be made with a variety of ingredients such as chickpeas, corn, soy, wheat, or rice to replicate the actual meat taste.
During the forecast period, the burger patty segment is expected to grow at a CAGR of 22.4%.
| Start-up Company | Alt Farm |
|---|---|
| Country | China |
| Description | It is a subsidiary of the Hong Kong University of Science and Technology. It is popularly known for its innovation of protein printing technology. The startup has developed a specialized nozzle specifically for food printing. Currently, they are developing a technology to print plant-based A5 wagyu beef, which is to be launched in 2025. |
| Start-up Company | Motif FoodWorks |
|---|---|
| Country | United States |
| Description | Founded in 2020, the startup primarily develops meat alternatives. This includes plant-based and dairy-free protein. This is achieved through advanced microbiological and fermentation methodologies, that isolate protein from meat and eggs. |
In the plant-based beef meat market, businesses compete fiercely. The top key players in the plant-based meat business are working on a capacity expansion. They aim to achieve a competitive advantage, in addition to collaborations and product launches. To build a strong position in the market, new entrants are focusing on innovation, product development, and marketing techniques.
They're also attempting to anticipate changing consumer preferences to provide delectable foods that may be customized. Start-ups and key players are launching new and exciting products to expand the consumer base and demand for novel products.
Burger King launched the vegetarian Impossible Whopper, which is quickly becoming one of the brand's most successful product launches. Currently, the two leading market players are Impossible Foods, Inc. and Gardein by Conagra Brands.
Key Players and Recent Market Developments
| Company | Beyond Meat |
|---|---|
| Details | Beyond Meat is a California-based company that is known for manufacturing meat substitutes from plant sources. It is preferred by many consumers due to its high likeliness to actual meat products. Their products are also available at popular fast-food chains and grocery stores. |
| Recent Developments |
In 2025, Beyond Meat launched two new exciting products namely the “Beyond Burger” and “Beyond Beef Meatballs”. These are made from plant-based protein and free from GMOs. The company also partnered with Pizza Hut in 2025 to launch the “Beyond Italian Sausage Crumbles in Canada. |
| Company | The Vegetarian Butcher |
|---|---|
| Details | The Vegetarian Butcher was founded in 2010 and is based in the Netherlands. The company primarily makes meat and seafood alternatives. The company has won many many awards, such as the EY Entrepreneur Of The Year in 2020 and 2020, and PETA's "Most animal-friendly company of the year" award. |
| Recent Developments | In 2024, The Vegetarian Butcher launched a wide array of plant-based meat alternatives in the Chinese market. This is because demand for plant-based meat alternatives is steadily growing in the region |
| Company | Greenleaf Foods, SPC |
|---|---|
| Details | Greenleaf Foods, SPC was established in 2020. It is a leading producer of plant-based protein in the United States. The company has partnered with leading plant-based meat alternative food manufacturers. It is a subsidiary of Maple Leaf Foods Inc. |
| Recent Developments | In 2024, Greenleaf Foods SPC expanded its production plant protein production in Indianapolis, US. This can be owed to the lucrative and readily available consumer base in North America generating profit. |
The global plant-based beef market is estimated to be valued at USD 5.8 billion in 2025.
The market size for the plant-based beef market is projected to reach USD 38.0 billion by 2035.
The plant-based beef market is expected to grow at a 20.6% CAGR between 2025 and 2035.
The key product types in plant-based beef market are burger patty, crumbles & grounds, sausages, hot dogs, nuggets, bacon chips, deli slices, chunks & tips, shreds, cutlet, strips, tenders, & fingers and meatballs.
In terms of source, soy-based protein segment to command 27.0% share in the plant-based beef market in 2025.
Explore Similar Insights

Thank you!
You will receive an email from our Business Development Manager. Please be sure to check your SPAM/JUNK folder too.
Chat With
MaRIA