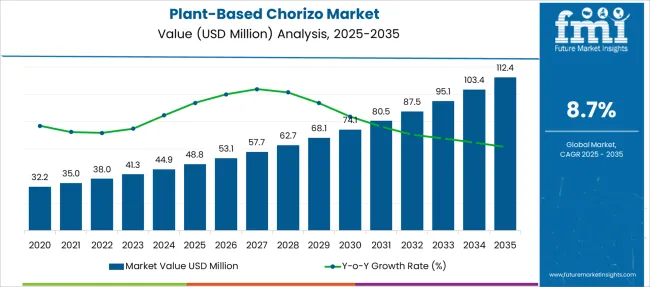
The Plant-Based Chorizo Market is estimated to be valued at USD 48.8 million in 2025 and is projected to reach USD 112.4 million by 2035, registering a compound annual growth rate (CAGR) of 8.7% over the forecast period.
| Metric | Value |
|---|---|
| Plant-Based Chorizo Market Estimated Value in (2025 E) | USD 48.8 million |
| Plant-Based Chorizo Market Forecast Value in (2035 F) | USD 112.4 million |
| Forecast CAGR (2025 to 2035) | 8.7% |
The plant-based chorizo market is gaining robust traction as health-conscious consumers increasingly opt for meat alternatives that align with environmental values and dietary preferences. This growth is being reinforced by advancements in plant protein processing, flavor engineering, and textural innovation that allow plant-based chorizo to mimic traditional pork-based varieties with high sensory fidelity. As plant-based diets become mainstream, consumer awareness around cholesterol reduction, cruelty-free sourcing, and allergen-friendly labeling continues to drive experimentation within flexitarian and vegetarian segments.
Market participants are actively investing in new formulations using pea protein, soy, and legumes, enabling high-protein profiles without compromising taste or shelf stability. Clean-label packaging and certifications such as non-GMO and vegan are also influencing purchase behavior in both developed and emerging regions.
The commercial rollout of these products across global QSR chains and casual dining formats is expected to reinforce demand momentum As the retail ecosystem aligns with sustainability goals and protein diversification, plant-based chorizo is positioned for sustained adoption across both foodservice and retail distribution networks.
The market is segmented by Application and Distribution Channel and region. By Application, the market is divided into Hash, Tortilla Wrap, Salad, Rolls, Stuffed Dishes, Hot Dog, and Others. In terms of Distribution Channel, the market is classified into Hypermarkets/Supermarkets, Convenience Stores, Specialty Stores, Independent Small Groceries, Online Retail, and Other Retail Distribution Channels. Regionally, the market is classified into North America, Latin America, Western Europe, Eastern Europe, Balkan & Baltic Countries, Russia & Belarus, Central Asia, East Asia, South Asia & Pacific, and the Middle East & Africa.
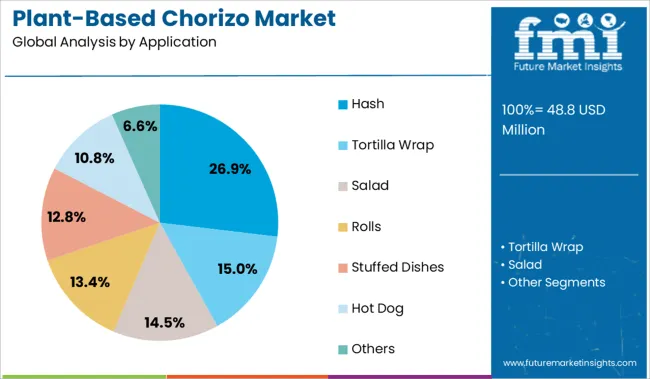
The hash application segment is projected to account for 26.9% of the total revenue share in the plant-based chorizo market in 2025, positioning it as a leading use case within the category. The segment's prominence is being supported by its adaptability in breakfast and brunch menus where chorizo hash is increasingly being used as a protein-rich, plant-based alternative to traditional meat-based dishes.
The appeal of this segment is enhanced by the versatility of hash as a customizable carrier for plant-based proteins, vegetables, and seasonings that resonate with diverse consumer tastes. Foodservice providers and quick-serve restaurants are incorporating plant-based chorizo in breakfast bowls, skillets, and wraps to cater to the growing base of health-conscious and flexitarian consumers.
The ability of plant-based chorizo to retain texture and flavor during high-heat cooking processes commonly used in hash preparation has further boosted its integration into both home and commercial kitchens Increased consumer interest in functional breakfasts that balance taste and nutrition has played a central role in driving demand for plant-based chorizo in hash-based formats.
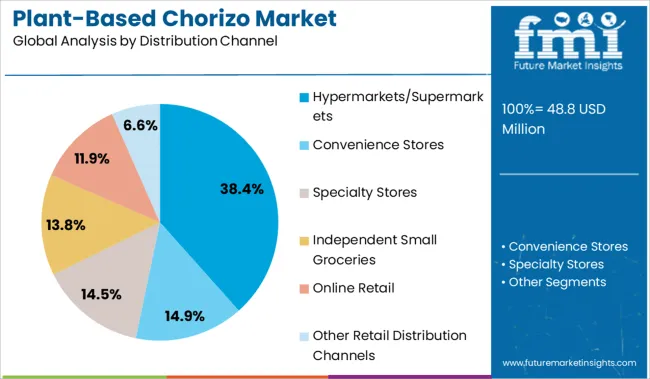
The hypermarkets and supermarkets distribution channel segment is expected to contribute 38.4% of the total revenue share in the plant-based chorizo market in 2025, underscoring its dominance in reaching mainstream consumers. The segment's leadership has been driven by the growing placement of plant-based chorizo in chilled meat substitute aisles, alongside conventional meat products, making them more visible and accessible to a broader consumer base.
Retailers have increased their shelf space and promotional strategies around plant-based categories to capitalize on rising demand, especially among urban and health-aware shoppers. In-store sampling programs, loyalty discounts, and co-branded marketing campaigns have enhanced consumer trial and repeat purchases in this format.
Additionally, the trusted brand environment and supply chain efficiency of large-format retailers have made them ideal platforms for launching new plant-based SKUs As consumers seek convenient, one-stop shopping experiences with transparent labeling and diverse product choices, hypermarkets and supermarkets are expected to remain the primary retail avenue for plant-based chorizo purchases globally.
Consumers are growing more health-conscious, figure-conscious, and beauty-conscious all around the world. Naturally, this has had a significant impact on the healthcare industry, but it has also had a significant impact on the food industry.
People are consuming foods that claim to be low in fat and calories. Diet fads such as keto, paleo, vegan, and others have risen in popularity as a result of shifting preferences in various parts of the world which is posing a positive impact on the adoption of plant-based food products, therefore, indirectly boosting the plant-based chorizo market.
Apart from that various new players are emerging in the plant-based food products market and bringing more innovation and technology to the table. This is also benefiting the plant-based chorizo demand. For example, Chipotle’s Whole30 Salad Bowl consists of Chipotle's super greens lettuce blend, fajita veggies, fresh tomato salsa, guacamole, and plant-based chorizo. The flavors are helpful in introducing a higher consumer base to plant-based food products in turn benefiting the market.
Plant-based chorizo falls under the category of keto diets due to its low carbohydrate and high-fat properties, which is boosting the adoption of the product at a rapid pace.
The increased prevalence of overweight and obesity issues among the young generation, millennials, and the working-class population is driving market expansion. Obesity contributes to a number of chronic problems, including diabetes, cardiovascular disease, and high blood pressure, so the ketogenic diet has become an effective strategy to lose weight.
Obesity, brain traumas, Alzheimer's disease epilepsy, cancer, polycystic ovary syndrome, Parkinson's disease, and cardiovascular disorders have all been proven to benefit from ketogenic diets in research undertaken by the American College of Cardiology and the Nutrition and Dietetics Academy. The benefits of this diet are increasing its popularity around the world, therefore, promoting the sales of plant-based chorizo.
Due to the augmenting popularity of fast food among the millennials and younger generation, the overweight population has risen globally. Obesity stood at 42.4 percent in the USA from 2020 to 2020, according to the Centers for Disease Control and Prevention (CDC). Furthermore, from 2020 to 2020, the presence of extreme obesity was 9.2 percent. Obesity affected 40.0 percent of adults in the USA between the ages of 20 and 39. This is a serious matter that requires immediate and effective attention. The demand for a ketogenic diet is increasing due to health issues.
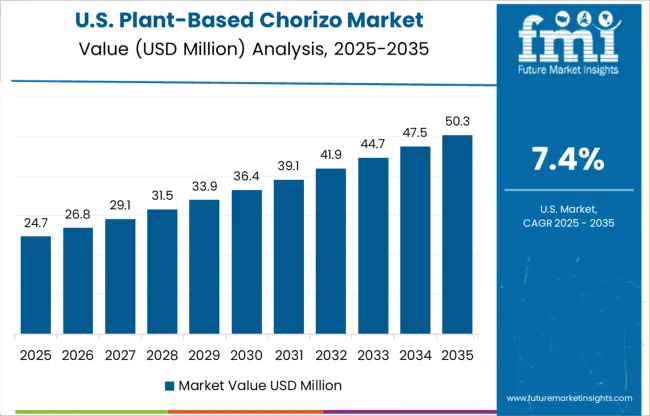
Following the release of long-awaited sodium-reduction guidelines by USA authorities, food producers are under renewed pressure to use less salt. It is aimed at reducing the amount of salt Americans consume. The majority of sodium in American diets comes from restaurant items, rather than salt added to home meals.
The Food and Drug Administration says that to get consumers used to consuming less salt, decreases must be gradual across the entire food supply so that consumers don't reach for higher sodium options. This is benefiting the USA plant-based chorizo market due to the lower sodium property of the product.
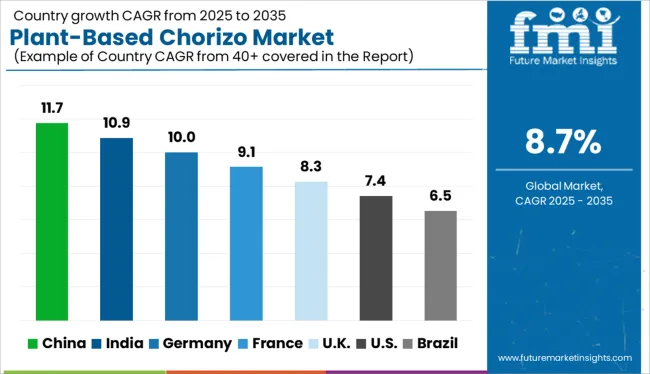
Plant-based diets and vegan lifestyles have gained popularity in Mexico during the last five years in turn boosting the sales of plant-based chorizo in the country. Veganism is rising at an accelerated rate in Mexico. About 20% of Mexicans described themselves as vegetarians or vegans. After all, Mexican cuisine has traditionally been plant-based, and this return to history has allowed chefs and restaurants to exhibit their roots in new and inventive ways.
The rising trend of the Whole30 diet in the country is boosting the demand for plant-based chorizo. Consumers who successfully complete the Whole30 Diet experience fat loss, weight loss, lower blood pressure, better sleep, more energy, clearer skin, fewer food cravings, and reduced bloating and gas, therefore, boosting the sales of plant-based food in the country, in turn benefiting plant-based chorizo market.
Soy protein-based sausages are predicted to continue to be the most popular, owing to their numerous health benefits. An ounce of soy protein isolate powder has 95 calories, 25% of the daily recommended iron, 1 gram of fat, and 2 grams of carbs. Aside from that, soy is a fantastic source of branch-chain amino acids, which help with muscle growth, exercise performance, and recovery after a workout. This is fueling millennial demand for plant-based chorizo sausages.
According to FMI, salads stand at a significant market share in 2025 but the application of the product into hash is gaining traction in various countries. It is expected to grow at a CAGR of 9.2% during the forecast period from 2025 to 2035.
As more plant-based items enter the market, there is a limited amount of shelf space available in brick-and-mortar stores to accommodate them. This opens up a lot of possibilities for selling directly to customers on the Internet or through other e-commerce channels.
For example, in August 2024, Beyond Meat, one of the most well-known plant-based meat producers, created its own e-commerce site to sell directly to consumers. The plus is that some consumers may not be able to find these products in their local grocery shop, thus e-commerce provides them with another option.
Online retail channels are, therefore, boosting the sales of plant-based chorizo in various parts of the world.
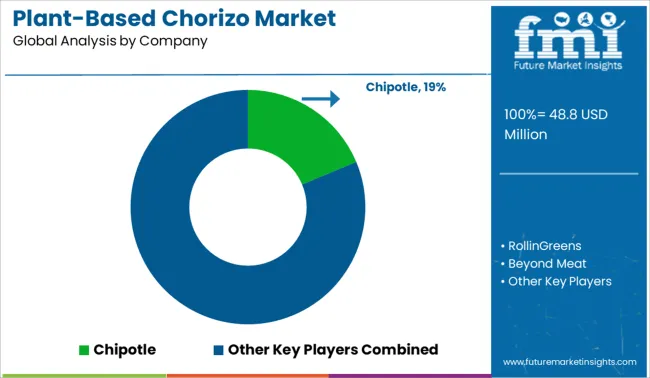
In order to meet the rising demand for plant-based meat products like plant-based chorizo, the players are focusing on bringing innovation to the table. The players are focused on experimenting with different vegetarian products to form substitutes for the highly demanded meat products.
Apart from that, the players are also moving towards adopting various ways to promote plant-based chorizo through different modes like social media advertising, small test packets for tasting, creating link-ups with famous restaurants and cafes, etc.
| Attribute | Details |
|---|---|
| Forecast Period | 2025 to 2035 |
| Historical Data Available for | 2020 to 2025 |
| Market Analysis | USD Million for Value and MT for Volume |
| Key Regions Covered | North America; Latin America; Europe; Asia Pacifi; Oceania; and Middle East; and Africa |
| Key Countries Covered | USA, Canada, Mexico, United Kingdom, Germany, France, Italy, Spain, China, Japan, India, South Korea, Australia, Brazil, Saudi Arabia, And South Africa |
| Key Segments Covered | Source, Application, Distribution Channel, and Region |
| Key Companies Profiled | Chipotle; RollinGreens; Beyond Meat; Blue Tribe; Impossible Foods; Lightlife Foods; Tofurkey; No Evil; Field Roast; Simple Truth; Others |
| Report Coverage | Market Forecast, Company Share Analysis, Competition Intelligence, Drivers, Restraints, Opportunities and Threats Analysis, Market Dynamics and Challenges, and Strategic Growth Initiatives |
| Customization & Pricing | Available upon Request |
The global plant-based chorizo market is estimated to be valued at USD 48.8 million in 2025.
The market size for the plant-based chorizo market is projected to reach USD 112.4 million by 2035.
The plant-based chorizo market is expected to grow at a 8.7% CAGR between 2025 and 2035.
The key product types in plant-based chorizo market are hash, tortilla wrap, salad, rolls, stuffed dishes, hot dog and others.
In terms of distribution channel, hypermarkets/supermarkets segment to command 38.4% share in the plant-based chorizo market in 2025.


Our Research Products

The "Full Research Suite" delivers actionable market intel, deep dives on markets or technologies, so clients act faster, cut risk, and unlock growth.

The Leaderboard benchmarks and ranks top vendors, classifying them as Established Leaders, Leading Challengers, or Disruptors & Challengers.

Locates where complements amplify value and substitutes erode it, forecasting net impact by horizon

We deliver granular, decision-grade intel: market sizing, 5-year forecasts, pricing, adoption, usage, revenue, and operational KPIs—plus competitor tracking, regulation, and value chains—across 60 countries broadly.

Spot the shifts before they hit your P&L. We track inflection points, adoption curves, pricing moves, and ecosystem plays to show where demand is heading, why it is changing, and what to do next across high-growth markets and disruptive tech

Real-time reads of user behavior. We track shifting priorities, perceptions of today’s and next-gen services, and provider experience, then pace how fast tech moves from trial to adoption, blending buyer, consumer, and channel inputs with social signals (#WhySwitch, #UX).

Partner with our analyst team to build a custom report designed around your business priorities. From analysing market trends to assessing competitors or crafting bespoke datasets, we tailor insights to your needs.
Supplier Intelligence
Discovery & Profiling
Capacity & Footprint
Performance & Risk
Compliance & Governance
Commercial Readiness
Who Supplies Whom
Scorecards & Shortlists
Playbooks & Docs
Category Intelligence
Definition & Scope
Demand & Use Cases
Cost Drivers
Market Structure
Supply Chain Map
Trade & Policy
Operating Norms
Deliverables
Buyer Intelligence
Account Basics
Spend & Scope
Procurement Model
Vendor Requirements
Terms & Policies
Entry Strategy
Pain Points & Triggers
Outputs
Pricing Analysis
Benchmarks
Trends
Should-Cost
Indexation
Landed Cost
Commercial Terms
Deliverables
Brand Analysis
Positioning & Value Prop
Share & Presence
Customer Evidence
Go-to-Market
Digital & Reputation
Compliance & Trust
KPIs & Gaps
Outputs
Full Research Suite comprises of:
Market outlook & trends analysis
Interviews & case studies
Strategic recommendations
Vendor profiles & capabilities analysis
5-year forecasts
8 regions and 60+ country-level data splits
Market segment data splits
12 months of continuous data updates
DELIVERED AS:
PDF EXCEL ONLINE

Thank you!
You will receive an email from our Business Development Manager. Please be sure to check your SPAM/JUNK folder too.
Chat With
MaRIA