Plant-Based Squalane Market Size and Share Forecast Outlook 2025 to 2035

The Plant-Based Squalane Market is expected to record a valuation of USD 1,623.4 million in 2025 and USD 5,023.1 million in 2035, with an increase of USD 3,399.7 million, which equals a growth of 209% over the decade. The overall expansion represents a CAGR of 12.0% and a little over a threefold increase in market size.
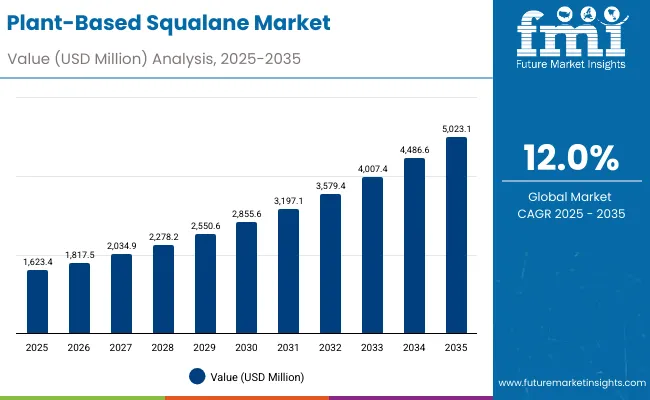
Quick Stats for Plant-Based Squalane Market

  • Plant-Based Squalane Market Value (2025): USD 1,623.4 million
  • Plant-Based Squalane Market Forecast Value (2035): USD 5,023.1 million
  • Plant-Based Squalane Market Forecast CAGR: 12.0%
  • Leading Segment in 2025: Sugarcane-derived (56.6%)
  • Key Growth Regions: China, India, Japan, USA, Germany
  • Top Key Players: Amyris (DSM-Firmenich), Croda, Kuraray, Sophim, Clariant, Evonik, BASF, Univar Solutions, Nikkol, Givaudan

Plant Based Squalane Market

Plant-Based Squalane Market Key Takeaways

Metric Value
Plant-Based Squalane Market Estimated Value in (2025E) USD 1,623.4 million
Plant-Based Squalane Market Forecast Value in (2035F) USD 5,023.1 million
Forecast CAGR (2025 to 2035) 12.0%

During the first five-year period from 2025 to 2030, the market increases from USD 1,623.4 million to USD 2,855.6 million, adding USD 1,232.2 million, which accounts for 36% of the total decade growth. This phase records steady adoption in skincare formulations, cosmetic serums, and sunscreens, driven by the rising demand for natural emollients and safer alternatives to petrochemical-derived moisturizers. Sugarcane-derived squalane dominates this period as it caters to over 56% of ingredient demand, supported by sustainable production and secure supply chains from Brazil and the USA

The second half from 2030 to 2035 contributes USD 2,167.5 million, equal to 64% of total growth, as the market jumps from USD 2,855.6 million to USD 5,023.1 million. This acceleration is powered by widespread deployment of B2B ingredient supply chains, digital-first distribution models, and strong uptake in Asia-Pacific personal care industries. Algae- and amaranth-derived squalane begin gaining share in the latter half due to biotech innovation and premium branding in niche cosmetics. Finished products marketed via e-commerce and specialty beauty stores also expand, capturing urban millennial and Gen-Z consumer demand for sustainable skincare.

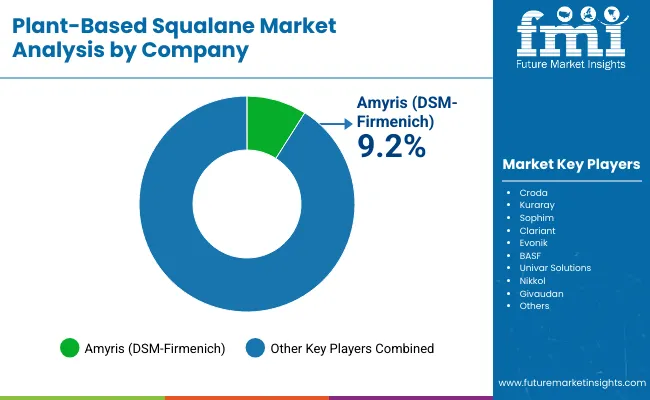
From 2020 to 2024, the Plant-Based Squalane Market grew from under USD 1,200 million to nearly USD 1,600 million, driven largely by sugarcane-based production and rising adoption in cosmetic moisturizers. During this period, the competitive landscape was dominated by Amyris, holding around 9% global share, alongside European companies such as Croda, Sophim, and BASF leveraging olive-derived sources. Differentiation relied on purity, natural positioning, and price stability, while algae-derived squalane was still in early development stages. Service-led models, such as customized formulations and biotech licensing, contributed minimally, representing less than 10% of value.

Demand for plant-based squalane will expand to USD 1,623.4 million in 2025, and the revenue mix will shift as B2B ingredient supply grows to over 53% share. Traditional players face rising competition from biotech firms introducing algae-based squalane, marketed as carbon-neutral and premium grade. Global leaders are pivoting towards hybrid models that combine ingredient supply with branded finished products through digital-first channels. E-commerce-focused entrants, particularly in Asia, are capturing consumer-facing segments. The competitive advantage is moving away from raw material efficiency alone to ecosystem integration, sustainability certification, and consumer brand strength.

Why the Plant-Based Squalane Market is Growing?

Advances in fermentation-based production and sugarcane bio-refining have improved scalability, allowing secure ingredient supply chains at lower cost. Sugarcane-derived squalane has gained popularity due to its sustainability credentials, low volatility, and compatibility with cosmetic formulations. The rise of natural skincare and "clean beauty" movements has contributed to enhanced demand across moisturizers, serums, sunscreens, and oils. Industries such as pharmaceuticals, personal care, and premium cosmetics are driving demand for squalane that can integrate seamlessly into dermatological formulations.

Expansion of vegan-certified cosmetics and sustainable sourcing regulations has fueled market growth. Innovations in algae-derived biotechnology and amaranth oil processing are expected to open new premium segments. Growth is expected to be led by sugarcane-derived sources in the early decade, while B2B ingredient supply dominates the channel mix. By 2030 and beyond, consumer-facing segments via e-commerce and specialty beauty stores will expand rapidly, making digital-native distribution a critical growth driver.

Segmental Analysis

The market is segmented by source, function, product type, channel, and region. Sources include sugarcane-derived, olive-derived, amaranth-derived, and algae-derived squalane, highlighting the diverse raw material base driving adoption. Functional segmentation covers moisturizing, emulsion stabilizer, texture enhancer, and repair, catering to core cosmetic and personal care applications. By product type, the market is classified into creams/lotions, serums, oils, and sunscreens, reflecting the end-consumer focus of squalane usage.

Channels of distribution include B2B ingredient supply, e-commerce (finished products), pharmacies, and specialty beauty stores, addressing both industrial and retail demand. Regionally, the scope spans North America, Europe, East Asia, South Asia & Pacific, Latin America, and the Middle East & Africa, with major growth concentrated in Asia.
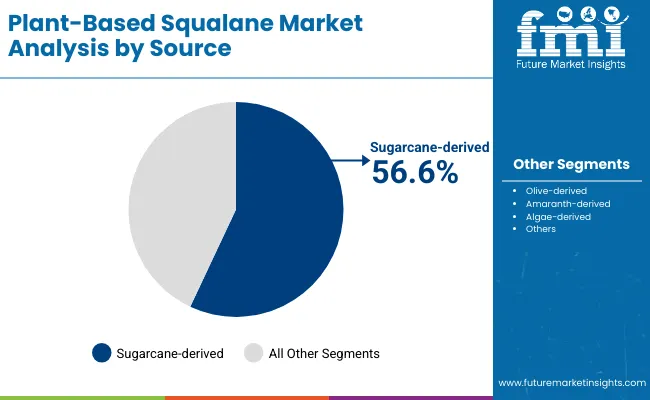
Insights into the Source Segment with Sugarcane Leading in Market Share

Plant Based Squalane Market By Source

Source Value Share% 2025
Sugarcane-derived 56.6%
Others 43.4%

The sugarcane-derived segment is projected to contribute 56.6% of the Plant-Based Squalane Market revenue in 2025, maintaining its lead as the dominant source category. This is driven by the scalability of sugarcane cultivation, strong sustainability credentials, and efficient conversion processes. Brazil and the USA provide stable raw material supply, allowing cost competitiveness against olive-derived alternatives.

The segment’s growth is also supported by consumer preference for plant-based, renewable, and eco-certified ingredients that align with clean beauty and vegan product standards. As algae-based fermentation technologies gain traction, sugarcane-derived squalane continues to hold the largest share due to proven industrial scaling. The source segment is expected to retain sugarcane as the backbone of global squalane supply.
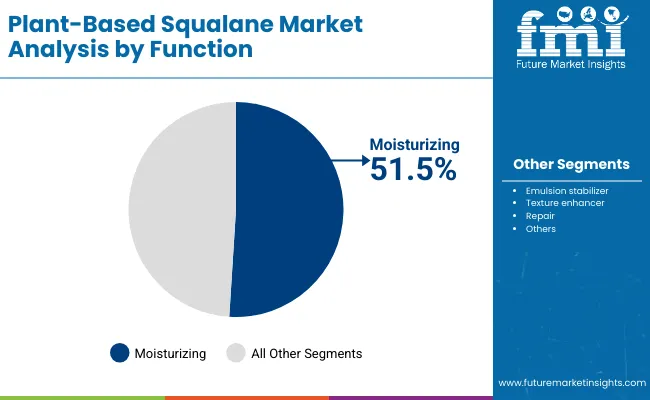
Insights into the Function Segment with Moisturizing Dominating the Demand

Plant Based Squalane Market By Function

Function Value Share% 2025
Moisturizing 51.5%
Others 48.5%

The moisturizing function segment is forecasted to hold 51.5% of the market share in 2025, led by its central role in cosmetic and skincare formulations. Squalane is favored for its non-greasy texture, emollient properties, and ability to mimic natural sebum, making it ideal for hydrating creams, serums, and lotions.Its compatibility with sensitive skin types has facilitated widespread adoption in premium beauty, dermatological, and personal care ranges. The segment’s growth is further bolstered by rising demand for anti-aging and hydration-focused products across North America, Europe, and Asia-Pacific.As industries increasingly require multi-functional actives that provide both hydration and formulation stability, the moisturizing function of plant-based squalane is expected to continue its dominance in the global market.
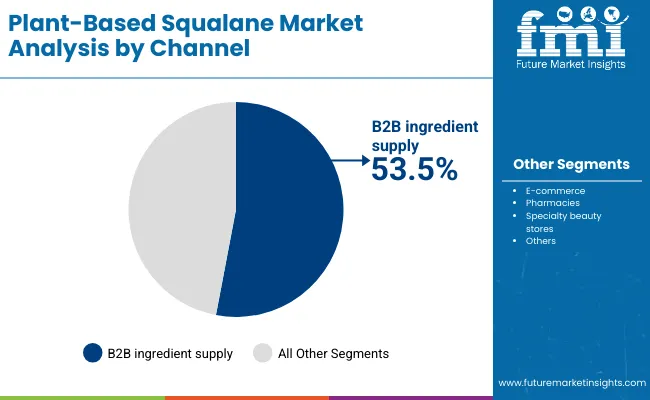
Insights into the Channel Segment with B2B Ingredient Supply Leading

Plant Based Squalane Market By Channel

Channel Value Share% 2025
B2B ingredient supply 53.5%
Others 46.5%

The B2B ingredient supply segment is projected to account for 53.5% of the Plant-Based Squalane Market revenue in 2025, establishing it as the leading distribution channel. This is driven by strong demand from multinational cosmetic manufacturers, contract formulators, and pharmaceutical companies requiring high-purity ingredients at scale.Its suitability for bulk procurement, compliance with international cosmetic standards, and integration into large-scale personal care production have made it the backbone of global distribution. Meanwhile, e-commerce and specialty beauty stores are gaining traction in consumer-facing sales, particularly in Asia-Pacific, where premium skincare brands highlight squalane as a hero ingredient.Given its balance of industrial scale and global reach, B2B ingredient supply is expected to maintain its leading role in the Plant-Based Squalane Market.

What are the Drivers, Restraints, and Key Trends of the Plant-Based Squalane Market?

Drivers

Dominance of Sugarcane-Derived Squalane in Global Supply

Sugarcane-derived squalane already contributes 56.6% of market revenue in 2025 (USD 905.1 Mn), making it the most commercially viable source. Its dominance stems from higher yield, cost efficiency, and scalability compared to olive-derived squalane, which is constrained by agricultural volatility in Mediterranean regions. Multinational cosmetic players prefer sugarcane-based sourcing due to stable feedstock availability in Brazil and the USA and reduced reliance on seasonal olive harvests. This consistent supply advantage directly supports growth in B2B ingredient distribution, which holds over 53% share in 2025.

Asia-Pacific Surge Led by China, India, and Japan

Regional CAGR data highlights extraordinary growth in India (23.3%), China (19.5%), and Japan (16.6%) compared to the USA (8.9%) and Germany (9.9%). These markets are not just expanding in consumer demand but are rapidly scaling ingredient manufacturing and e-commerce-based finished product distribution. Domestic beauty brands in China and Japan increasingly highlight squalane as a "hero ingredient" for hydration and anti-aging, while India’s nutraceutical and personal care industries are embracing squalane as a premium natural alternative. This regional momentum is critical for global value expansion beyond 2030.

Restraints

Over-Concentration on Sugarcane Feedstock

Although sugarcane is the market’s leading source, heavy dependence on it poses risk. Any disruption in Brazil’s bio-refinery ecosystem whether due to drought, sugarcane disease outbreaks, or bioethanol policy shifts could create a supply bottleneck. This concentration risk makes pricing volatile and could limit diversification, especially as global demand triples by 2035. Olive, algae, and amaranth-derived sources are not yet scaled enough to offset sudden shortfalls.

High Price Sensitivity in Emerging Markets

Despite growing CAGR in India and China, plant-based squalane remains a premium-priced emollient, making it less accessible for mass-market brands. Domestic cosmetic manufacturers often substitute with cheaper alternatives like mineral oils or synthetic emollients when targeting middle-income consumers. This price barrier limits penetration in high-volume but cost-sensitive personal care categories such as shampoos, body lotions, and soaps, restricting the pace of adoption outside premium skincare.

Key Trends

Shift Toward Algae-Derived and Amaranth-Based Premium Segments

While sugarcane currently dominates, algae- and amaranth-derived squalane are gaining share due to their marketing appeal in ultra-premium skincare. Algae-derived squalane is being positioned as carbon-neutral, biotech-driven, and luxury-grade, attracting high-margin brands in Japan, Europe, and North America. Amaranth-based sources, though niche, are marketed around antioxidant-rich narratives, enhancing consumer willingness to pay a premium. These shifts indicate a future bifurcation: sugarcane for bulk supply, algae/amaranth for differentiation.

B2B Ingredient Supply Consolidation Coupled with E-Commerce Boom

In 2025, B2B ingredient supply holds 53.5% share, reflecting bulk demand from multinationals. However, a parallel trend is the rapid rise of direct-to-consumer channels, especially via e-commerce and specialty beauty stores. Asian markets, particularly China, showcase how ingredient suppliers are increasingly forward-integrating moving from ingredient distribution to branded finished skincare lines on digital platforms. This dual-channel evolution will reshape competitive strategies, where ingredient suppliers (e.g., Amyris, Croda, Evonik) may compete directly with consumer-facing beauty brands.
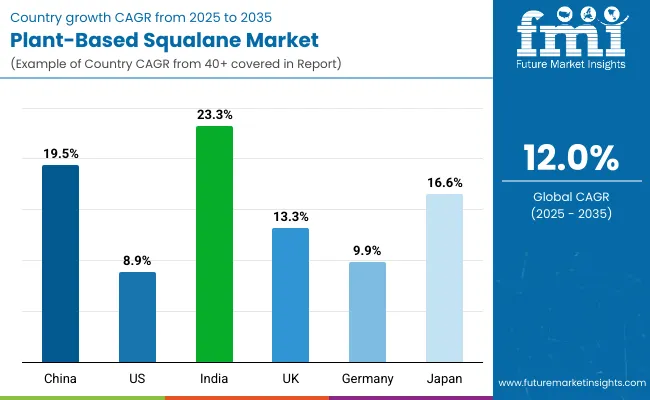
Analysis of Plant-Based Squalane Market By Key Countries

Plant Based Squalane Market By Country

Countries Estimated CAGR (2025 to 2035)
China 19.5%
USA 8.9%
India 23.3%
UK 13.3%
Germany 9.9%
Japan 16.6%

Between 2025 and 2035, the Plant-Based Squalane Market will see its fastest growth in India (23.3% CAGR), followed closely by China (19.5%) and Japan (16.6%). These countries are driving regional expansion in Asia-Pacific, with rising disposable incomes, expanding personal care and nutraceutical sectors, and consumer preference for natural, plant-based formulations. India’s exceptionally high growth reflects the increasing adoption of premium skincare in urban centers and the scaling of domestic ingredient manufacturing for export.

In China, squalane demand is driven by both domestic beauty brands and multinational players setting up local sourcing channels, while Japan’s strong anti-aging and functional cosmetic market continues to position squalane as a hero ingredient. Collectively, Asia-Pacific not only leads in CAGR but also reshapes global demand patterns as ingredient supply and consumer-facing channels integrate.

In contrast, developed markets such as the USA (8.9%) and Germany (9.9%) are growing at a steadier pace, reflecting maturity rather than early-stage adoption. Both markets are characterized by established clean beauty regulations, widespread availability of plant-based products, and high brand concentration. However, their growth is comparatively slower due to market saturation and price-sensitive competition from alternative emollients.

The UK (13.3%) sits mid-range, reflecting strong demand from premium skincare and cosmetic innovation but also regulatory shifts post-Brexit that add complexity to ingredient imports. Overall, developed regions contribute stable but moderate expansion, while Asia-Pacific accounts for the largest share of incremental growth, setting the future competitive battleground for plant-based squalane suppliers.
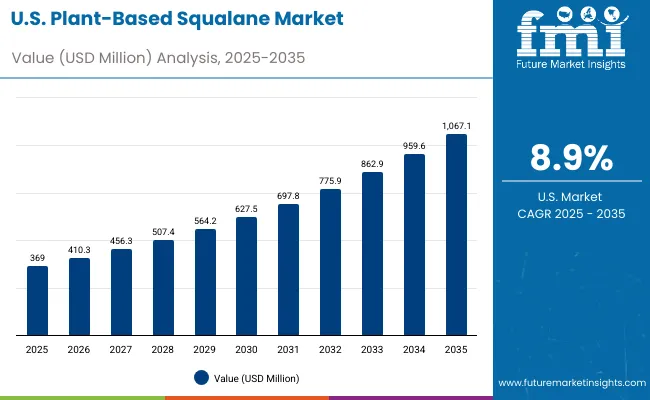
Sales Outlook for Plant-Based Squalane in the United States

Plant Based Squalane Market Usa

Year USA Plant-Based Squalane Market (USD Million)
2025 369.0
2026 410.3
2027 456.3
2028 507.4
2029 564.2
2030 627.5
2031 697.8
2032 775.9
2033 862.9
2034 959.6
2035 1,067.1

The Plant-Based Squalane Market in the United States is projected to grow at a CAGR of 8.9%, led by consistent demand for sustainable skincare and cosmetic formulations. Reverse substitution away from shark-derived squalane is nearly complete, making the USA a mature market characterized by sugarcane-derived dominance (57.8% share in 2025). Growth is steady in moisturizers, serums, and sunscreens, with dermatological and pharmaceutical usage adding incremental demand. E-commerce expansion of clean beauty brands has further widened access, while multinational cosmetic firms continue to import large ingredient volumes through B2B contracts. However, the market’s pace is moderated by high saturation levels compared to Asia.

  • Sugarcane-derived squalane dominates ingredient sourcing with stable USA supply chains.
  • Premium skincare brands highlight squalane in anti-aging and hydrating serums.
  • Dermatology-led pharmaceutical products are integrating squalane for sensitive skin applications.

Growth and Expansion Outlook for Plant-BasedSqualane in the United Kingdom

The Plant-Based Squalane Market in the United Kingdom is expected to grow at a CAGR of 13.3%, supported by applications in premium skincare, dermatological research, and sustainable cosmetics innovation. London and Manchester-based independent beauty labels have accelerated uptake of olive- and amaranth-derived squalane, positioning them as niche premium actives in serums and oils. Regulatory alignment post-Brexit has driven stronger emphasis on sustainability labeling, giving plant-based squalane a competitive edge over synthetic substitutes. Pharmacies and specialty beauty stores are also key distribution hubs, particularly as clean beauty penetration rises in the mid-premium segment.

  • Independent beauty labels are promoting olive- and amaranth-derived squalane for luxury positioning.
  • Sustainability-driven regulations accelerate plant-based ingredient certification.
  • Specialty stores and pharmacies serve as core retail channels for premium formulations.

Growth and Expansion Outlook for Plant-Based Squalane in India

India is witnessing rapid growth in the Plant-Based Squalane Market, forecast to expand at a CAGR of 23.3% through 2035, the highest globally. Rising adoption of vegan-certified skincare and clean beauty in metro cities is complemented by growing awareness in tier-2 markets. Domestic cosmetic brands are beginning to integrate squalane in affordable serums and sunscreens, though price sensitivity remains a challenge. On the B2B side, ingredient demand from nutraceutical and ayurvedic product manufacturers is accelerating. India’s market also benefits from pharmaceutical formulations, with dermatology-led usage rising in hospitals and private clinics.
  • Tier-2 city adoption is rising, driven by affordable squalane-based personal care launches.
  • Nutraceutical and ayurvedic manufacturers are emerging as new ingredient buyers.
  • Pharmaceutical applications in dermatology are opening non-cosmetic growth opportunities.

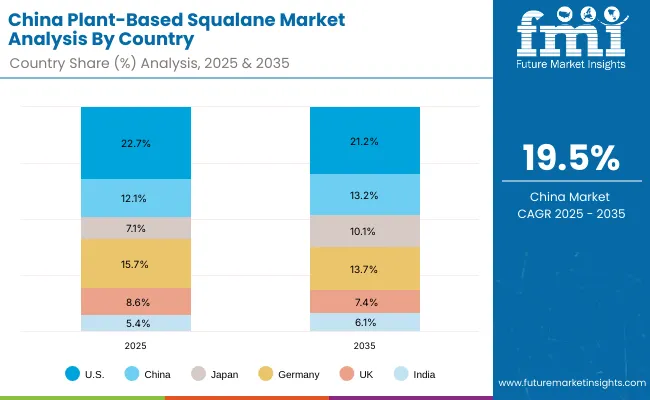
Sales Outlook for Plant-Based Squalane in China

Plant Based Squalane Market China

Countries 2025 Share (%)
USA 22.7%
China 12.1%
Japan 7.1%
Germany 15.7%
UK 8.6%
India 5.4%
Countries 2035 Share (%)
USA 21.2%
China 13.2%
Japan 10.1%
Germany 13.7%
UK 7.4%
India 6.1%

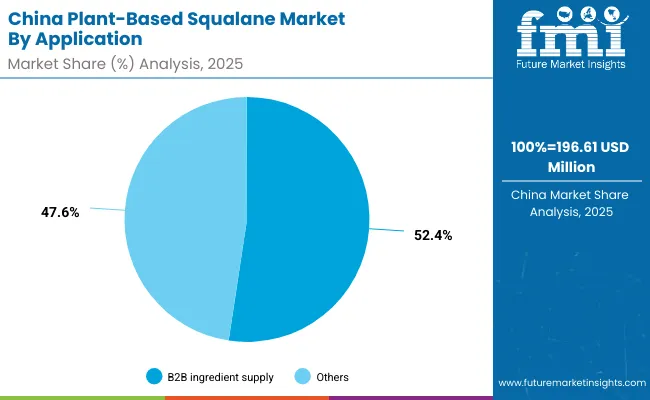
The Plant-Based Squalane Market in China is expected to grow at a CAGR of 19.5%, among the fastest worldwide. This momentum is driven by B2B ingredient demand (52.4% share in 2025), as domestic beauty and skincare manufacturers expand production. Large-scale urbanization and middle-class income growth are fueling consumption of serums, creams, and sunscreens featuring squalane as a key moisturizing ingredient. Domestic biotech firms are experimenting with algae-derived squalane, supported by government innovation programs, making China a hub for alternative sourcing technologies. E-commerce platforms such as Tmall and JD.com are critical to distribution, accelerating consumer access to both local and global brands.
  • B2B supply dominates ingredient demand, feeding large domestic beauty manufacturers.
  • Algae-derived squalane R&D is expanding, supported by national biotech programs.
  • E-commerce platforms are driving rapid consumer-facing distribution growth.

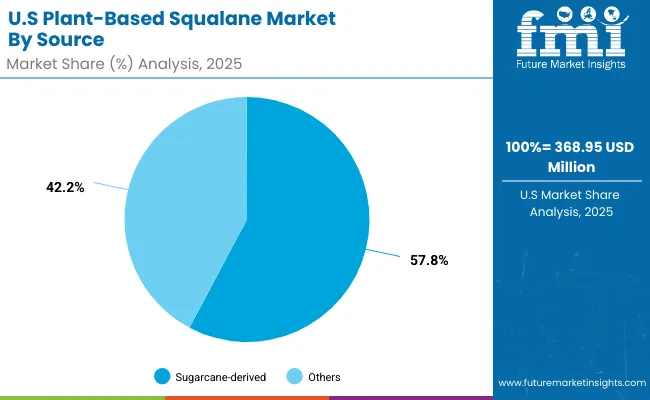
Opportunity Analysis of United States Plant-Based Squalane Market

Plant Based Squalane Market Usa 2

US by Source Value Share% 2025
Sugarcane-derived 57.8%
Others 42.2%

The Plant-Based Squalane Market in the United States is valued at USD 368.95 million in 2025, with sugarcane-derived squalane leading at 57.8%, followed by other sources (olive, amaranth, algae) at 42.2%. Leadership of sugarcane-based supply reflects mature, secure feedstock chains, consistent purity, and documented sustainability credentials favored by dermatology-backed brands. Moisturizing-led use cases dominate serums, creams, and sunscreens, while pharmacies and specialty beauty stores expand premium shelf space.

B2B contracts with multinationals sustain bulk demand, and clinical skincare continues to integrate squalane for barrier repair and sensitive skin. Near-term opportunity lies in value-added positioning (SPF + squalane hybrids, Rx-adjacent dermocosmetics) and private-label launches for large retailers. As price competition intensifies, suppliers that pair ingredient supply with formulation services and verified eco-labels will capture incremental share across mid-premium tiers.
  • Market size for United States in 2025 is USD 368.95 million
  • Global market share is approximately 22.7%
  • Sugarcane-derived leads at 57.8% due to stable costs, purity, and sustainability audits

Opportunity Analysis of China Plant-Based Squalane Market

Plant Based Squalane Market China 2

China by Application Value Share% 2025
B2B ingredient supply 52.4%
Others 47.6%

The Plant-Based Squalane Market in China is valued at USD 196.61 million in 2025, with B2B ingredient supply leading at 52.4%, followed by consumer-facing channels (e-commerce, pharmacies, specialty beauty) at 47.6%. Dominance of B2B reflects scaling by domestic beauty manufacturers and ODMs serving fast-cycle brand launches on Tmall/JD. Moisturizing remains the hero function in serums and lotions, while algae-derived pilots gain traction for premium-tier positioning and carbon-neutral branding.

Opportunities concentrate in OEM/ODM partnerships, localized compliance support, and SKU acceleration via social commerce. Suppliers that guarantee consistent sensory profiles, offer micro-encapsulation for actives pairing, and co-develop China-specific claims (hydration + barrier care) can outpace market growth as the country advances toward double-digit CAGRs through 2035.
  • Market size for China in 2025 is USD 196.61 million
  • Global market share is approximately 12.1%
  • B2B ingredient supply leads at 52.4% due to scale manufacturing and ODM demand

Competitive Landscape of Plant-Based Squalane Market

Plant Based Squalane Market By Company

The market is moderately fragmented: leaders such as Amyris (DSM-Firmenich), Croda, Evonik, BASF, Clariant, Kuraray, Sophim, Givaudan, Nikkol, and Univar Solutions compete on feedstock strategy (sugarcane vs. olive vs. algae), purity, and verified sustainability. Top players leverage fermentation or highly efficient hydrogenation to secure consistent sensory feel and oxidative stability, while expanding B2B programs that bundle regulatory dossiers, claim support, and rapid sampling to shorten brand development cycles in the USA, China, and Japan.

Established mid-sized innovators emphasize application engineeringco-formulating moisturizing systems (squalane + humectants/ceramides), texture optimization for light-feel serums, and stability in high-SPF formats. Differentiation increasingly comes from traceability (RSPO/VEGAN/ISO), LCA disclosures, and allergen-free compliance, enabling premium pricing in dermocosmetics and pharmacy channels.

Specialists and distributors focus on route-to-market: curated ingredient portfolios, low MOQs, and regional warehousing to serve indie brands and cross-border e-commerce. With algae- and amaranth-derived supply scaling, competitive advantage is shifting from commodity emollient pricing to ecosystem capabilitiesco-development toolkits, clinical data for hydration/barrier endpoints, and digital commerce enablementthat lock in recurring volumes and faster launch velocity across priority markets.

Key Developments in Plant-Based Squalane Market

  • On February 22, 2023, Givaudan announced that it acquired Amyris’sNeossance® Squalane, Neossance® Hemisqualane, and CleanScreen™ ingredient portfolios, and initiated a long-term manufacturing and commercialization partnership. Under this agreement, Amyris continues to produce these biotech-derived sustainable ingredients, while Givaudan brings them to market through its beauty innovation channels accelerating the reach of plant-based squalane across global cosmetic producers.
  • On October 23, 2023, Evonik launched PhytoSquene®, the first plant-based squalene produced under full GMP standards for parenteral (injectable) drug delivery applications. Derived from amaranth oil and compliant with high regulatory quality, this offering addresses medical-grade needs and represents a sustainable alternative to shark-derived squalene.

Scope of the Report

Item Value
Quantitative Units USD 1,623.4 million
Source Sugarcane-derived, Olive-derived, Amaranth-derived, and Algae-derived
Function Moisturizing, Emulsion stabilizer, Texture enhancer, and Repair
Product Type Creams/lotions, Serums, Oils, and Sunscreens
Channel B2B ingredient supply, E-commerce (finished products), Pharmacies, and Specialty beauty stores
Regions Covered North America, Europe, Asia-Pacific, Latin America, Middle East & Africa
Country Covered United States, Canada, Germany, France, United Kingdom, China, Japan, India, Brazil, South Africa
Key Companies Profiled Amyris (DSM- Firmenich), Croda, Kuraray, Sophim, Clariant, Evonik, BASF, Univar Solutions, Nikkol, Givaudan
Additional Attributes Dollar sales by source, function, and distribution channel; adoption trends in moisturizing and repair-focused formulations; rising demand for sugarcane-derived squalane; sector-specific growth in cosmetics, pharmaceuticals, and nutraceuticals; channel segmentation across B2B and e-commerce; regional growth driven by Asia-Pacific; innovation in algae and amaranth biotechnology; sustainability certification and traceability trends shaping competitive differentiation.

Key Segments

By Function:

  • Moisturizing
  • Emulsion stabilizer
  • Texture enhancer
  • Repair

By Source:

  • Sugarcane-derived
  • Olive-derived
  • Amaranth-derived
  • Algae-derived

By Product Type:

  • Creams/lotions
  • Serums
  • Oils
  • Sunscreens

By Channel:

  • B2B ingredient supply
  • E-commerce (finished products)
  • Pharmacies
  • Specialty beauty stores

By Region:

  • North America
  • Latin America
  • Europe
  • East Asia
  • South Asia & Pacific
  • Middle East and Africa

Table of Content

  1. Executive Summary
    • Global Market Outlook
    • Demand-side Trends
    • Supply-side Trends
    • Technology Roadmap Analysis
    • Analysis and Recommendations
  2. Market Overview
    • Market Coverage / Taxonomy
    • Market Definition / Scope / Limitations
  3. Market Background
    • Market Dynamics
      • Drivers
      • Restraints
      • Opportunity
      • Trends
    • Scenario Forecast
      • Demand in Optimistic Scenario
      • Demand in Likely Scenario
      • Demand in Conservative Scenario
    • Opportunity Map Analysis
    • Product Life Cycle Analysis
    • Supply Chain Analysis
      • Supply Side Participants and their Roles
        • Producers
        • Mid-Level Participants (Traders/ Agents/ Brokers)
        • Wholesalers and Distributors
      • Value Added and Value Created at Node in the Supply Chain
      • List of Raw Material Suppliers
      • List of Existing and Potential Buyer’s
    • Investment Feasibility Matrix
    • Value Chain Analysis
      • Profit Margin Analysis
      • Wholesalers and Distributors
      • Retailers
    • PESTLE and Porter’s Analysis
    • Regulatory Landscape
      • By Key Regions
      • By Key Countries
    • Regional Parent Market Outlook
    • Production and Consumption Statistics
    • Import and Export Statistics
  4. Global Market Analysis 2020 to 2024 and Forecast, 2025 to 2035
    • Historical Market Size Value (USD Million) & Volume (Units) Analysis, 2020 to 2024
    • Current and Future Market Size Value (USD Million) & Volume (Units) Projections, 2025 to 2035
      • Y-o-Y Growth Trend Analysis
      • Absolute $ Opportunity Analysis
  5. Global Market Analysis 2020 to 2024 and Forecast 2025 to 2035, By Function
    • Introduction / Key Findings
    • Historical Market Size Value (USD Million) & Volume (Units) Analysis By Function, 2020 to 2024
    • Current and Future Market Size Value (USD Million) & Volume (Units) Analysis and Forecast By Function, 2025 to 2035
      • Moisturizing
      • Emulsion stabilizer
      • Texture enhancer
      • Repair
    • Y-o-Y Growth Trend Analysis By Function, 2020 to 2024
    • Absolute $ Opportunity Analysis By Function, 2025 to 2035
  6. Global Market Analysis 2020 to 2024 and Forecast 2025 to 2035, By Source
    • Introduction / Key Findings
    • Historical Market Size Value (USD Million) & Volume (Units) Analysis By Source, 2020 to 2024
    • Current and Future Market Size Value (USD Million) & Volume (Units) Analysis and Forecast By Source, 2025 to 2035
      • Sugarcane-derived
      • Olive-derived
      • Amaranth-derived
      • Algae-derived
    • Y-o-Y Growth Trend Analysis By Source, 2020 to 2024
    • Absolute $ Opportunity Analysis By Source, 2025 to 2035
  7. Global Market Analysis 2020 to 2024 and Forecast 2025 to 2035, By Product Type
    • Introduction / Key Findings
    • Historical Market Size Value (USD Million) & Volume (Units) Analysis By Product Type, 2020 to 2024
    • Current and Future Market Size Value (USD Million) & Volume (Units) Analysis and Forecast By Product Type, 2025 to 2035
      • Creams/lotions
      • Serums
      • Oils
      • Sunscreens
    • Y-o-Y Growth Trend Analysis By Product Type, 2020 to 2024
    • Absolute $ Opportunity Analysis By Product Type, 2025 to 2035
  8. Global Market Analysis 2020 to 2024 and Forecast 2025 to 2035, By Channel
    • Introduction / Key Findings
    • Historical Market Size Value (USD Million) & Volume (Units) Analysis By Channel, 2020 to 2024
    • Current and Future Market Size Value (USD Million) & Volume (Units) Analysis and Forecast By Channel, 2025 to 2035
      • B2B ingredient supply
      • E-commerce (finished products)
      • Pharmacies
      • Specialty beauty stores
    • Y-o-Y Growth Trend Analysis By Channel, 2020 to 2024
    • Absolute $ Opportunity Analysis By Channel, 2025 to 2035
  9. Global Market Analysis 2020 to 2024 and Forecast 2025 to 2035, By Region
    • Introduction
    • Historical Market Size Value (USD Million) & Volume (Units) Analysis By Region, 2020 to 2024
    • Current Market Size Value (USD Million) & Volume (Units) Analysis and Forecast By Region, 2025 to 2035
      • North America
      • Latin America
      • Europe
      • East Asia
      • South Asia & Pacific
      • Middle East and Africa
    • Market Attractiveness Analysis By Region
  10. North America Market Analysis 2020 to 2024 and Forecast 2025 to 2035, By Country
    • Historical Market Size Value (USD Million) & Volume (Units) Trend Analysis By Market Taxonomy, 2020 to 2024
    • Market Size Value (USD Million) & Volume (Units) Forecast By Market Taxonomy, 2025 to 2035
      • By Country
        • USA
        • Canada
      • By Function
      • By Source
      • By Product Type
      • By Channel
    • Market Attractiveness Analysis
      • By Country
      • By Function
      • By Source
      • By Product Type
      • By Channel
    • Key Takeaways
  11. Latin America Market Analysis 2020 to 2024 and Forecast 2025 to 2035, By Country
    • Historical Market Size Value (USD Million) & Volume (Units) Trend Analysis By Market Taxonomy, 2020 to 2024
    • Market Size Value (USD Million) & Volume (Units) Forecast By Market Taxonomy, 2025 to 2035
      • By Country
        • Brazil
        • Mexico
        • Colombia
        • Rest of Latin America
      • By Function
      • By Source
      • By Product Type
      • By Channel
    • Market Attractiveness Analysis
      • By Country
      • By Function
      • By Source
      • By Product Type
      • By Channel
    • Key Takeaways
  12. Europe Market Analysis 2020 to 2024 and Forecast 2025 to 2035, By Country
    • Historical Market Size Value (USD Million) & Volume (Units) Trend Analysis By Market Taxonomy, 2020 to 2024
    • Market Size Value (USD Million) & Volume (Units) Forecast By Market Taxonomy, 2025 to 2035
      • By Country
        • Germany
        • UK
        • France
        • Italy
        • Spain
        • Belgium
        • Netherlands
        • Nordic
        • Switzerland
        • Russia
        • Poland
        • Rest of Europe
      • By Function
      • By Source
      • By Product Type
      • By Channel
    • Market Attractiveness Analysis
      • By Country
      • By Function
      • By Source
      • By Product Type
      • By Channel
    • Key Takeaways
  13. East Asia Market Analysis 2020 to 2024 and Forecast 2025 to 2035, By Country
    • Historical Market Size Value (USD Million) & Volume (Units) Trend Analysis By Market Taxonomy, 2020 to 2024
    • Market Size Value (USD Million) & Volume (Units) Forecast By Market Taxonomy, 2025 to 2035
      • By Country
        • China
        • Japan
        • South Korea
      • By Function
      • By Source
      • By Product Type
      • By Channel
    • Market Attractiveness Analysis
      • By Country
      • By Function
      • By Source
      • By Product Type
      • By Channel
    • Key Takeaways
  14. South Asia & Pacific Market Analysis 2020 to 2024 and Forecast 2025 to 2035, By Country
    • Historical Market Size Value (USD Million) & Volume (Units) Trend Analysis By Market Taxonomy, 2020 to 2024
    • Market Size Value (USD Million) & Volume (Units) Forecast By Market Taxonomy, 2025 to 2035
      • By Country
        • India
        • Thailand
        • Malaysia
        • Indonesia
        • Singapore
        • Vietnam
        • Australia
        • New Zealand
        • Rest of South Asia
      • By Function
      • By Source
      • By Product Type
      • By Channel
    • Market Attractiveness Analysis
      • By Country
      • By Function
      • By Source
      • By Product Type
      • By Channel
    • Key Takeaways
  15. Middle East and Africa Market Analysis 2020 to 2024 and Forecast 2025 to 2035, By Country
    • Historical Market Size Value (USD Million) & Volume (Units) Trend Analysis By Market Taxonomy, 2020 to 2024
    • Market Size Value (USD Million) & Volume (Units) Forecast By Market Taxonomy, 2025 to 2035
      • By Country
        • Turkey
        • UAE
        • Saudi Arabia
        • Israel
        • Other GCC Countries
        • North Africa
        • South Africa
      • By Function
      • By Source
      • By Product Type
      • By Channel
    • Market Attractiveness Analysis
      • By Country
      • By Function
      • By Source
      • By Product Type
      • By Channel
    • Key Takeaways
  16. Key Countries Market Analysis
    • USA
      • Pricing Analysis
      • Market Share Analysis, 2024
        • By Function
        • By Source
        • By Product Type
        • By Channel
    • Canada
      • Pricing Analysis
      • Market Share Analysis, 2024
        • By Function
        • By Source
        • By Product Type
        • By Channel
    • Brazil
      • Pricing Analysis
      • Market Share Analysis, 2024
        • By Function
        • By Source
        • By Product Type
        • By Channel
    • Mexico
      • Pricing Analysis
      • Market Share Analysis, 2024
        • By Function
        • By Source
        • By Product Type
        • By Channel
    • Colombia
      • Pricing Analysis
      • Market Share Analysis, 2024
        • By Function
        • By Source
        • By Product Type
        • By Channel
    • Germany
      • Pricing Analysis
      • Market Share Analysis, 2024
        • By Function
        • By Source
        • By Product Type
        • By Channel
    • UK
      • Pricing Analysis
      • Market Share Analysis, 2024
        • By Function
        • By Source
        • By Product Type
        • By Channel
    • France
      • Pricing Analysis
      • Market Share Analysis, 2024
        • By Function
        • By Source
        • By Product Type
        • By Channel
    • Italy
      • Pricing Analysis
      • Market Share Analysis, 2024
        • By Function
        • By Source
        • By Product Type
        • By Channel
    • Spain
      • Pricing Analysis
      • Market Share Analysis, 2024
        • By Function
        • By Source
        • By Product Type
        • By Channel
    • Belgium
      • Pricing Analysis
      • Market Share Analysis, 2024
        • By Function
        • By Source
        • By Product Type
        • By Channel
    • Netherlands
      • Pricing Analysis
      • Market Share Analysis, 2024
        • By Function
        • By Source
        • By Product Type
        • By Channel
    • Nordic
      • Pricing Analysis
      • Market Share Analysis, 2024
        • By Function
        • By Source
        • By Product Type
        • By Channel
    • Switzerland
      • Pricing Analysis
      • Market Share Analysis, 2024
        • By Function
        • By Source
        • By Product Type
        • By Channel
    • Russia
      • Pricing Analysis
      • Market Share Analysis, 2024
        • By Function
        • By Source
        • By Product Type
        • By Channel
    • Poland
      • Pricing Analysis
      • Market Share Analysis, 2024
        • By Function
        • By Source
        • By Product Type
        • By Channel
    • China
      • Pricing Analysis
      • Market Share Analysis, 2024
        • By Function
        • By Source
        • By Product Type
        • By Channel
    • Japan
      • Pricing Analysis
      • Market Share Analysis, 2024
        • By Function
        • By Source
        • By Product Type
        • By Channel
    • South Korea
      • Pricing Analysis
      • Market Share Analysis, 2024
        • By Function
        • By Source
        • By Product Type
        • By Channel
    • India
      • Pricing Analysis
      • Market Share Analysis, 2024
        • By Function
        • By Source
        • By Product Type
        • By Channel
    • Thailand
      • Pricing Analysis
      • Market Share Analysis, 2024
        • By Function
        • By Source
        • By Product Type
        • By Channel
    • Indonesia
      • Pricing Analysis
      • Market Share Analysis, 2024
        • By Function
        • By Source
        • By Product Type
        • By Channel
    • Australia
      • Pricing Analysis
      • Market Share Analysis, 2024
        • By Function
        • By Source
        • By Product Type
        • By Channel
    • New Zealand
      • Pricing Analysis
      • Market Share Analysis, 2024
        • By Function
        • By Source
        • By Product Type
        • By Channel
    • Turkey
      • Pricing Analysis
      • Market Share Analysis, 2024
        • By Function
        • By Source
        • By Product Type
        • By Channel
    • UAE
      • Pricing Analysis
      • Market Share Analysis, 2024
        • By Function
        • By Source
        • By Product Type
        • By Channel
    • Saudi Arabia
      • Pricing Analysis
      • Market Share Analysis, 2024
        • By Function
        • By Source
        • By Product Type
        • By Channel
    • Israel
      • Pricing Analysis
      • Market Share Analysis, 2024
        • By Function
        • By Source
        • By Product Type
        • By Channel
    • North Africa
      • Pricing Analysis
      • Market Share Analysis, 2024
        • By Function
        • By Source
        • By Product Type
        • By Channel
    • South Africa
      • Pricing Analysis
      • Market Share Analysis, 2024
        • By Function
        • By Source
        • By Product Type
        • By Channel
  17. Market Structure Analysis
    • Competition Dashboard
    • Competition Benchmarking
    • Market Share Analysis of Top Players
      • By Regional
      • By Function
      • By Source
      • By Product Type
      • By Channel
  18. Competition Analysis
    • Competition Deep Dive
      • Amyris (DSM-Firmenich)
        • Overview
        • Product Portfolio
        • Profitability by Market Segments (Product/Age /Sales Channel/Region)
        • Sales Footprint
        • Strategy Overview
          • Marketing Strategy
          • Product Strategy
          • Channel Strategy
      • Croda
        • Overview
        • Product Portfolio
        • Profitability by Market Segments (Product/Age /Sales Channel/Region)
        • Sales Footprint
        • Strategy Overview
          • Marketing Strategy
          • Product Strategy
          • Channel Strategy
      • Kuraray
        • Overview
        • Product Portfolio
        • Profitability by Market Segments (Product/Age /Sales Channel/Region)
        • Sales Footprint
        • Strategy Overview
          • Marketing Strategy
          • Product Strategy
          • Channel Strategy
      • Sophim
        • Overview
        • Product Portfolio
        • Profitability by Market Segments (Product/Age /Sales Channel/Region)
        • Sales Footprint
        • Strategy Overview
          • Marketing Strategy
          • Product Strategy
          • Channel Strategy
      • Clariant
        • Overview
        • Product Portfolio
        • Profitability by Market Segments (Product/Age /Sales Channel/Region)
        • Sales Footprint
        • Strategy Overview
          • Marketing Strategy
          • Product Strategy
          • Channel Strategy
      • Evonik
        • Overview
        • Product Portfolio
        • Profitability by Market Segments (Product/Age /Sales Channel/Region)
        • Sales Footprint
        • Strategy Overview
          • Marketing Strategy
          • Product Strategy
          • Channel Strategy
      • BASF
        • Overview
        • Product Portfolio
        • Profitability by Market Segments (Product/Age /Sales Channel/Region)
        • Sales Footprint
        • Strategy Overview
          • Marketing Strategy
          • Product Strategy
          • Channel Strategy
      • Univar Solutions
        • Overview
        • Product Portfolio
        • Profitability by Market Segments (Product/Age /Sales Channel/Region)
        • Sales Footprint
        • Strategy Overview
          • Marketing Strategy
          • Product Strategy
          • Channel Strategy
      • Nikkol
        • Overview
        • Product Portfolio
        • Profitability by Market Segments (Product/Age /Sales Channel/Region)
        • Sales Footprint
        • Strategy Overview
          • Marketing Strategy
          • Product Strategy
          • Channel Strategy
      • Givaudan
        • Overview
        • Product Portfolio
        • Profitability by Market Segments (Product/Age /Sales Channel/Region)
        • Sales Footprint
        • Strategy Overview
          • Marketing Strategy
          • Product Strategy
          • Channel Strategy
  19. Assumptions & Acronyms Used
  20. Research Methodology

List of Tables

  • Table 1: Global Market Value (USD Million) Forecast by Region, 2020-2035
  • Table 2: Global Market Volume (Units) Forecast by Region, 2020-2035
  • Table 3: Global Market Value (USD Million) Forecast by Function, 2020-2035
  • Table 4: Global Market Volume (Units) Forecast by Function, 2020-2035
  • Table 5: Global Market Value (USD Million) Forecast by Source, 2020-2035
  • Table 6: Global Market Volume (Units) Forecast by Source, 2020-2035
  • Table 7: Global Market Value (USD Million) Forecast by Product Type, 2020-2035
  • Table 8: Global Market Volume (Units) Forecast by Product Type, 2020-2035
  • Table 9: Global Market Value (USD Million) Forecast by Channel, 2020-2035
  • Table 10: Global Market Volume (Units) Forecast by Channel, 2020-2035
  • Table 11: North America Market Value (USD Million) Forecast by Country, 2020-2035
  • Table 12: North America Market Volume (Units) Forecast by Country, 2020-2035
  • Table 13: North America Market Value (USD Million) Forecast by Function, 2020-2035
  • Table 14: North America Market Volume (Units) Forecast by Function, 2020-2035
  • Table 15: North America Market Value (USD Million) Forecast by Source, 2020-2035
  • Table 16: North America Market Volume (Units) Forecast by Source, 2020-2035
  • Table 17: North America Market Value (USD Million) Forecast by Product Type, 2020-2035
  • Table 18: North America Market Volume (Units) Forecast by Product Type, 2020-2035
  • Table 19: North America Market Value (USD Million) Forecast by Channel, 2020-2035
  • Table 20: North America Market Volume (Units) Forecast by Channel, 2020-2035
  • Table 21: Latin America Market Value (USD Million) Forecast by Country, 2020-2035
  • Table 22: Latin America Market Volume (Units) Forecast by Country, 2020-2035
  • Table 23: Latin America Market Value (USD Million) Forecast by Function, 2020-2035
  • Table 24: Latin America Market Volume (Units) Forecast by Function, 2020-2035
  • Table 25: Latin America Market Value (USD Million) Forecast by Source, 2020-2035
  • Table 26: Latin America Market Volume (Units) Forecast by Source, 2020-2035
  • Table 27: Latin America Market Value (USD Million) Forecast by Product Type, 2020-2035
  • Table 28: Latin America Market Volume (Units) Forecast by Product Type, 2020-2035
  • Table 29: Latin America Market Value (USD Million) Forecast by Channel, 2020-2035
  • Table 30: Latin America Market Volume (Units) Forecast by Channel, 2020-2035
  • Table 31: Europe Market Value (USD Million) Forecast by Country, 2020-2035
  • Table 32: Europe Market Volume (Units) Forecast by Country, 2020-2035
  • Table 33: Europe Market Value (USD Million) Forecast by Function, 2020-2035
  • Table 34: Europe Market Volume (Units) Forecast by Function, 2020-2035
  • Table 35: Europe Market Value (USD Million) Forecast by Source, 2020-2035
  • Table 36: Europe Market Volume (Units) Forecast by Source, 2020-2035
  • Table 37: Europe Market Value (USD Million) Forecast by Product Type, 2020-2035
  • Table 38: Europe Market Volume (Units) Forecast by Product Type, 2020-2035
  • Table 39: Europe Market Value (USD Million) Forecast by Channel, 2020-2035
  • Table 40: Europe Market Volume (Units) Forecast by Channel, 2020-2035
  • Table 41: East Asia Market Value (USD Million) Forecast by Country, 2020-2035
  • Table 42: East Asia Market Volume (Units) Forecast by Country, 2020-2035
  • Table 43: East Asia Market Value (USD Million) Forecast by Function, 2020-2035
  • Table 44: East Asia Market Volume (Units) Forecast by Function, 2020-2035
  • Table 45: East Asia Market Value (USD Million) Forecast by Source, 2020-2035
  • Table 46: East Asia Market Volume (Units) Forecast by Source, 2020-2035
  • Table 47: East Asia Market Value (USD Million) Forecast by Product Type, 2020-2035
  • Table 48: East Asia Market Volume (Units) Forecast by Product Type, 2020-2035
  • Table 49: East Asia Market Value (USD Million) Forecast by Channel, 2020-2035
  • Table 50: East Asia Market Volume (Units) Forecast by Channel, 2020-2035
  • Table 51: South Asia & Pacific Market Value (USD Million) Forecast by Country, 2020-2035
  • Table 52: South Asia & Pacific Market Volume (Units) Forecast by Country, 2020-2035
  • Table 53: South Asia & Pacific Market Value (USD Million) Forecast by Function, 2020-2035
  • Table 54: South Asia & Pacific Market Volume (Units) Forecast by Function, 2020-2035
  • Table 55: South Asia & Pacific Market Value (USD Million) Forecast by Source, 2020-2035
  • Table 56: South Asia & Pacific Market Volume (Units) Forecast by Source, 2020-2035
  • Table 57: South Asia & Pacific Market Value (USD Million) Forecast by Product Type, 2020-2035
  • Table 58: South Asia & Pacific Market Volume (Units) Forecast by Product Type, 2020-2035
  • Table 59: South Asia & Pacific Market Value (USD Million) Forecast by Channel, 2020-2035
  • Table 60: South Asia & Pacific Market Volume (Units) Forecast by Channel, 2020-2035
  • Table 61: Middle East and Africa Market Value (USD Million) Forecast by Country, 2020-2035
  • Table 62: Middle East and Africa Market Volume (Units) Forecast by Country, 2020-2035
  • Table 63: Middle East and Africa Market Value (USD Million) Forecast by Function, 2020-2035
  • Table 64: Middle East and Africa Market Volume (Units) Forecast by Function, 2020-2035
  • Table 65: Middle East and Africa Market Value (USD Million) Forecast by Source, 2020-2035
  • Table 66: Middle East and Africa Market Volume (Units) Forecast by Source, 2020-2035
  • Table 67: Middle East and Africa Market Value (USD Million) Forecast by Product Type, 2020-2035
  • Table 68: Middle East and Africa Market Volume (Units) Forecast by Product Type, 2020-2035
  • Table 69: Middle East and Africa Market Value (USD Million) Forecast by Channel, 2020-2035
  • Table 70: Middle East and Africa Market Volume (Units) Forecast by Channel, 2020-2035

List of Figures

  • Figure 1: Global Market Value (USD Million) by Function, 2025-2035
  • Figure 2: Global Market Value (USD Million) by Source, 2025-2035
  • Figure 3: Global Market Value (USD Million) by Product Type, 2025-2035
  • Figure 4: Global Market Value (USD Million) by Channel, 2025-2035
  • Figure 5: Global Market Value (USD Million) by Region, 2025-2035
  • Figure 6: Global Market Value (USD Million) Analysis by Region, 2020-2035
  • Figure 7: Global Market Volume (Units) Analysis by Region, 2020-2035
  • Figure 8: Global Market Value Share (%) and BPS Analysis by Region, 2025-2035
  • Figure 9: Global Market Y-o-Y Growth (%) Projections by Region, 2025-2035
  • Figure 10: Global Market Value (USD Million) Analysis by Function, 2020-2035
  • Figure 11: Global Market Volume (Units) Analysis by Function, 2020-2035
  • Figure 12: Global Market Value Share (%) and BPS Analysis by Function, 2025-2035
  • Figure 13: Global Market Y-o-Y Growth (%) Projections by Function, 2025-2035
  • Figure 14: Global Market Value (USD Million) Analysis by Source, 2020-2035
  • Figure 15: Global Market Volume (Units) Analysis by Source, 2020-2035
  • Figure 16: Global Market Value Share (%) and BPS Analysis by Source, 2025-2035
  • Figure 17: Global Market Y-o-Y Growth (%) Projections by Source, 2025-2035
  • Figure 18: Global Market Value (USD Million) Analysis by Product Type, 2020-2035
  • Figure 19: Global Market Volume (Units) Analysis by Product Type, 2020-2035
  • Figure 20: Global Market Value Share (%) and BPS Analysis by Product Type, 2025-2035
  • Figure 21: Global Market Y-o-Y Growth (%) Projections by Product Type, 2025-2035
  • Figure 22: Global Market Value (USD Million) Analysis by Channel, 2020-2035
  • Figure 23: Global Market Volume (Units) Analysis by Channel, 2020-2035
  • Figure 24: Global Market Value Share (%) and BPS Analysis by Channel, 2025-2035
  • Figure 25: Global Market Y-o-Y Growth (%) Projections by Channel, 2025-2035
  • Figure 26: Global Market Attractiveness by Function, 2025-2035
  • Figure 27: Global Market Attractiveness by Source, 2025-2035
  • Figure 28: Global Market Attractiveness by Product Type, 2025-2035
  • Figure 29: Global Market Attractiveness by Channel, 2025-2035
  • Figure 30: Global Market Attractiveness by Region, 2025-2035
  • Figure 31: North America Market Value (USD Million) by Function, 2025-2035
  • Figure 32: North America Market Value (USD Million) by Source, 2025-2035
  • Figure 33: North America Market Value (USD Million) by Product Type, 2025-2035
  • Figure 34: North America Market Value (USD Million) by Channel, 2025-2035
  • Figure 35: North America Market Value (USD Million) by Country, 2025-2035
  • Figure 36: North America Market Value (USD Million) Analysis by Country, 2020-2035
  • Figure 37: North America Market Volume (Units) Analysis by Country, 2020-2035
  • Figure 38: North America Market Value Share (%) and BPS Analysis by Country, 2025-2035
  • Figure 39: North America Market Y-o-Y Growth (%) Projections by Country, 2025-2035
  • Figure 40: North America Market Value (USD Million) Analysis by Function, 2020-2035
  • Figure 41: North America Market Volume (Units) Analysis by Function, 2020-2035
  • Figure 42: North America Market Value Share (%) and BPS Analysis by Function, 2025-2035
  • Figure 43: North America Market Y-o-Y Growth (%) Projections by Function, 2025-2035
  • Figure 44: North America Market Value (USD Million) Analysis by Source, 2020-2035
  • Figure 45: North America Market Volume (Units) Analysis by Source, 2020-2035
  • Figure 46: North America Market Value Share (%) and BPS Analysis by Source, 2025-2035
  • Figure 47: North America Market Y-o-Y Growth (%) Projections by Source, 2025-2035
  • Figure 48: North America Market Value (USD Million) Analysis by Product Type, 2020-2035
  • Figure 49: North America Market Volume (Units) Analysis by Product Type, 2020-2035
  • Figure 50: North America Market Value Share (%) and BPS Analysis by Product Type, 2025-2035
  • Figure 51: North America Market Y-o-Y Growth (%) Projections by Product Type, 2025-2035
  • Figure 52: North America Market Value (USD Million) Analysis by Channel, 2020-2035
  • Figure 53: North America Market Volume (Units) Analysis by Channel, 2020-2035
  • Figure 54: North America Market Value Share (%) and BPS Analysis by Channel, 2025-2035
  • Figure 55: North America Market Y-o-Y Growth (%) Projections by Channel, 2025-2035
  • Figure 56: North America Market Attractiveness by Function, 2025-2035
  • Figure 57: North America Market Attractiveness by Source, 2025-2035
  • Figure 58: North America Market Attractiveness by Product Type, 2025-2035
  • Figure 59: North America Market Attractiveness by Channel, 2025-2035
  • Figure 60: North America Market Attractiveness by Country, 2025-2035
  • Figure 61: Latin America Market Value (USD Million) by Function, 2025-2035
  • Figure 62: Latin America Market Value (USD Million) by Source, 2025-2035
  • Figure 63: Latin America Market Value (USD Million) by Product Type, 2025-2035
  • Figure 64: Latin America Market Value (USD Million) by Channel, 2025-2035
  • Figure 65: Latin America Market Value (USD Million) by Country, 2025-2035
  • Figure 66: Latin America Market Value (USD Million) Analysis by Country, 2020-2035
  • Figure 67: Latin America Market Volume (Units) Analysis by Country, 2020-2035
  • Figure 68: Latin America Market Value Share (%) and BPS Analysis by Country, 2025-2035
  • Figure 69: Latin America Market Y-o-Y Growth (%) Projections by Country, 2025-2035
  • Figure 70: Latin America Market Value (USD Million) Analysis by Function, 2020-2035
  • Figure 71: Latin America Market Volume (Units) Analysis by Function, 2020-2035
  • Figure 72: Latin America Market Value Share (%) and BPS Analysis by Function, 2025-2035
  • Figure 73: Latin America Market Y-o-Y Growth (%) Projections by Function, 2025-2035
  • Figure 74: Latin America Market Value (USD Million) Analysis by Source, 2020-2035
  • Figure 75: Latin America Market Volume (Units) Analysis by Source, 2020-2035
  • Figure 76: Latin America Market Value Share (%) and BPS Analysis by Source, 2025-2035
  • Figure 77: Latin America Market Y-o-Y Growth (%) Projections by Source, 2025-2035
  • Figure 78: Latin America Market Value (USD Million) Analysis by Product Type, 2020-2035
  • Figure 79: Latin America Market Volume (Units) Analysis by Product Type, 2020-2035
  • Figure 80: Latin America Market Value Share (%) and BPS Analysis by Product Type, 2025-2035
  • Figure 81: Latin America Market Y-o-Y Growth (%) Projections by Product Type, 2025-2035
  • Figure 82: Latin America Market Value (USD Million) Analysis by Channel, 2020-2035
  • Figure 83: Latin America Market Volume (Units) Analysis by Channel, 2020-2035
  • Figure 84: Latin America Market Value Share (%) and BPS Analysis by Channel, 2025-2035
  • Figure 85: Latin America Market Y-o-Y Growth (%) Projections by Channel, 2025-2035
  • Figure 86: Latin America Market Attractiveness by Function, 2025-2035
  • Figure 87: Latin America Market Attractiveness by Source, 2025-2035
  • Figure 88: Latin America Market Attractiveness by Product Type, 2025-2035
  • Figure 89: Latin America Market Attractiveness by Channel, 2025-2035
  • Figure 90: Latin America Market Attractiveness by Country, 2025-2035
  • Figure 91: Europe Market Value (USD Million) by Function, 2025-2035
  • Figure 92: Europe Market Value (USD Million) by Source, 2025-2035
  • Figure 93: Europe Market Value (USD Million) by Product Type, 2025-2035
  • Figure 94: Europe Market Value (USD Million) by Channel, 2025-2035
  • Figure 95: Europe Market Value (USD Million) by Country, 2025-2035
  • Figure 96: Europe Market Value (USD Million) Analysis by Country, 2020-2035
  • Figure 97: Europe Market Volume (Units) Analysis by Country, 2020-2035
  • Figure 98: Europe Market Value Share (%) and BPS Analysis by Country, 2025-2035
  • Figure 99: Europe Market Y-o-Y Growth (%) Projections by Country, 2025-2035
  • Figure 100: Europe Market Value (USD Million) Analysis by Function, 2020-2035
  • Figure 101: Europe Market Volume (Units) Analysis by Function, 2020-2035
  • Figure 102: Europe Market Value Share (%) and BPS Analysis by Function, 2025-2035
  • Figure 103: Europe Market Y-o-Y Growth (%) Projections by Function, 2025-2035
  • Figure 104: Europe Market Value (USD Million) Analysis by Source, 2020-2035
  • Figure 105: Europe Market Volume (Units) Analysis by Source, 2020-2035
  • Figure 106: Europe Market Value Share (%) and BPS Analysis by Source, 2025-2035
  • Figure 107: Europe Market Y-o-Y Growth (%) Projections by Source, 2025-2035
  • Figure 108: Europe Market Value (USD Million) Analysis by Product Type, 2020-2035
  • Figure 109: Europe Market Volume (Units) Analysis by Product Type, 2020-2035
  • Figure 110: Europe Market Value Share (%) and BPS Analysis by Product Type, 2025-2035
  • Figure 111: Europe Market Y-o-Y Growth (%) Projections by Product Type, 2025-2035
  • Figure 112: Europe Market Value (USD Million) Analysis by Channel, 2020-2035
  • Figure 113: Europe Market Volume (Units) Analysis by Channel, 2020-2035
  • Figure 114: Europe Market Value Share (%) and BPS Analysis by Channel, 2025-2035
  • Figure 115: Europe Market Y-o-Y Growth (%) Projections by Channel, 2025-2035
  • Figure 116: Europe Market Attractiveness by Function, 2025-2035
  • Figure 117: Europe Market Attractiveness by Source, 2025-2035
  • Figure 118: Europe Market Attractiveness by Product Type, 2025-2035
  • Figure 119: Europe Market Attractiveness by Channel, 2025-2035
  • Figure 120: Europe Market Attractiveness by Country, 2025-2035
  • Figure 121: East Asia Market Value (USD Million) by Function, 2025-2035
  • Figure 122: East Asia Market Value (USD Million) by Source, 2025-2035
  • Figure 123: East Asia Market Value (USD Million) by Product Type, 2025-2035
  • Figure 124: East Asia Market Value (USD Million) by Channel, 2025-2035
  • Figure 125: East Asia Market Value (USD Million) by Country, 2025-2035
  • Figure 126: East Asia Market Value (USD Million) Analysis by Country, 2020-2035
  • Figure 127: East Asia Market Volume (Units) Analysis by Country, 2020-2035
  • Figure 128: East Asia Market Value Share (%) and BPS Analysis by Country, 2025-2035
  • Figure 129: East Asia Market Y-o-Y Growth (%) Projections by Country, 2025-2035
  • Figure 130: East Asia Market Value (USD Million) Analysis by Function, 2020-2035
  • Figure 131: East Asia Market Volume (Units) Analysis by Function, 2020-2035
  • Figure 132: East Asia Market Value Share (%) and BPS Analysis by Function, 2025-2035
  • Figure 133: East Asia Market Y-o-Y Growth (%) Projections by Function, 2025-2035
  • Figure 134: East Asia Market Value (USD Million) Analysis by Source, 2020-2035
  • Figure 135: East Asia Market Volume (Units) Analysis by Source, 2020-2035
  • Figure 136: East Asia Market Value Share (%) and BPS Analysis by Source, 2025-2035
  • Figure 137: East Asia Market Y-o-Y Growth (%) Projections by Source, 2025-2035
  • Figure 138: East Asia Market Value (USD Million) Analysis by Product Type, 2020-2035
  • Figure 139: East Asia Market Volume (Units) Analysis by Product Type, 2020-2035
  • Figure 140: East Asia Market Value Share (%) and BPS Analysis by Product Type, 2025-2035
  • Figure 141: East Asia Market Y-o-Y Growth (%) Projections by Product Type, 2025-2035
  • Figure 142: East Asia Market Value (USD Million) Analysis by Channel, 2020-2035
  • Figure 143: East Asia Market Volume (Units) Analysis by Channel, 2020-2035
  • Figure 144: East Asia Market Value Share (%) and BPS Analysis by Channel, 2025-2035
  • Figure 145: East Asia Market Y-o-Y Growth (%) Projections by Channel, 2025-2035
  • Figure 146: East Asia Market Attractiveness by Function, 2025-2035
  • Figure 147: East Asia Market Attractiveness by Source, 2025-2035
  • Figure 148: East Asia Market Attractiveness by Product Type, 2025-2035
  • Figure 149: East Asia Market Attractiveness by Channel, 2025-2035
  • Figure 150: East Asia Market Attractiveness by Country, 2025-2035
  • Figure 151: South Asia & Pacific Market Value (USD Million) by Function, 2025-2035
  • Figure 152: South Asia & Pacific Market Value (USD Million) by Source, 2025-2035
  • Figure 153: South Asia & Pacific Market Value (USD Million) by Product Type, 2025-2035
  • Figure 154: South Asia & Pacific Market Value (USD Million) by Channel, 2025-2035
  • Figure 155: South Asia & Pacific Market Value (USD Million) by Country, 2025-2035
  • Figure 156: South Asia & Pacific Market Value (USD Million) Analysis by Country, 2020-2035
  • Figure 157: South Asia & Pacific Market Volume (Units) Analysis by Country, 2020-2035
  • Figure 158: South Asia & Pacific Market Value Share (%) and BPS Analysis by Country, 2025-2035
  • Figure 159: South Asia & Pacific Market Y-o-Y Growth (%) Projections by Country, 2025-2035
  • Figure 160: South Asia & Pacific Market Value (USD Million) Analysis by Function, 2020-2035
  • Figure 161: South Asia & Pacific Market Volume (Units) Analysis by Function, 2020-2035
  • Figure 162: South Asia & Pacific Market Value Share (%) and BPS Analysis by Function, 2025-2035
  • Figure 163: South Asia & Pacific Market Y-o-Y Growth (%) Projections by Function, 2025-2035
  • Figure 164: South Asia & Pacific Market Value (USD Million) Analysis by Source, 2020-2035
  • Figure 165: South Asia & Pacific Market Volume (Units) Analysis by Source, 2020-2035
  • Figure 166: South Asia & Pacific Market Value Share (%) and BPS Analysis by Source, 2025-2035
  • Figure 167: South Asia & Pacific Market Y-o-Y Growth (%) Projections by Source, 2025-2035
  • Figure 168: South Asia & Pacific Market Value (USD Million) Analysis by Product Type, 2020-2035
  • Figure 169: South Asia & Pacific Market Volume (Units) Analysis by Product Type, 2020-2035
  • Figure 170: South Asia & Pacific Market Value Share (%) and BPS Analysis by Product Type, 2025-2035
  • Figure 171: South Asia & Pacific Market Y-o-Y Growth (%) Projections by Product Type, 2025-2035
  • Figure 172: South Asia & Pacific Market Value (USD Million) Analysis by Channel, 2020-2035
  • Figure 173: South Asia & Pacific Market Volume (Units) Analysis by Channel, 2020-2035
  • Figure 174: South Asia & Pacific Market Value Share (%) and BPS Analysis by Channel, 2025-2035
  • Figure 175: South Asia & Pacific Market Y-o-Y Growth (%) Projections by Channel, 2025-2035
  • Figure 176: South Asia & Pacific Market Attractiveness by Function, 2025-2035
  • Figure 177: South Asia & Pacific Market Attractiveness by Source, 2025-2035
  • Figure 178: South Asia & Pacific Market Attractiveness by Product Type, 2025-2035
  • Figure 179: South Asia & Pacific Market Attractiveness by Channel, 2025-2035
  • Figure 180: South Asia & Pacific Market Attractiveness by Country, 2025-2035
  • Figure 181: Middle East and Africa Market Value (USD Million) by Function, 2025-2035
  • Figure 182: Middle East and Africa Market Value (USD Million) by Source, 2025-2035
  • Figure 183: Middle East and Africa Market Value (USD Million) by Product Type, 2025-2035
  • Figure 184: Middle East and Africa Market Value (USD Million) by Channel, 2025-2035
  • Figure 185: Middle East and Africa Market Value (USD Million) by Country, 2025-2035
  • Figure 186: Middle East and Africa Market Value (USD Million) Analysis by Country, 2020-2035
  • Figure 187: Middle East and Africa Market Volume (Units) Analysis by Country, 2020-2035
  • Figure 188: Middle East and Africa Market Value Share (%) and BPS Analysis by Country, 2025-2035
  • Figure 189: Middle East and Africa Market Y-o-Y Growth (%) Projections by Country, 2025-2035
  • Figure 190: Middle East and Africa Market Value (USD Million) Analysis by Function, 2020-2035
  • Figure 191: Middle East and Africa Market Volume (Units) Analysis by Function, 2020-2035
  • Figure 192: Middle East and Africa Market Value Share (%) and BPS Analysis by Function, 2025-2035
  • Figure 193: Middle East and Africa Market Y-o-Y Growth (%) Projections by Function, 2025-2035
  • Figure 194: Middle East and Africa Market Value (USD Million) Analysis by Source, 2020-2035
  • Figure 195: Middle East and Africa Market Volume (Units) Analysis by Source, 2020-2035
  • Figure 196: Middle East and Africa Market Value Share (%) and BPS Analysis by Source, 2025-2035
  • Figure 197: Middle East and Africa Market Y-o-Y Growth (%) Projections by Source, 2025-2035
  • Figure 198: Middle East and Africa Market Value (USD Million) Analysis by Product Type, 2020-2035
  • Figure 199: Middle East and Africa Market Volume (Units) Analysis by Product Type, 2020-2035
  • Figure 200: Middle East and Africa Market Value Share (%) and BPS Analysis by Product Type, 2025-2035
  • Figure 201: Middle East and Africa Market Y-o-Y Growth (%) Projections by Product Type, 2025-2035
  • Figure 202: Middle East and Africa Market Value (USD Million) Analysis by Channel, 2020-2035
  • Figure 203: Middle East and Africa Market Volume (Units) Analysis by Channel, 2020-2035
  • Figure 204: Middle East and Africa Market Value Share (%) and BPS Analysis by Channel, 2025-2035
  • Figure 205: Middle East and Africa Market Y-o-Y Growth (%) Projections by Channel, 2025-2035
  • Figure 206: Middle East and Africa Market Attractiveness by Function, 2025-2035
  • Figure 207: Middle East and Africa Market Attractiveness by Source, 2025-2035
  • Figure 208: Middle East and Africa Market Attractiveness by Product Type, 2025-2035
  • Figure 209: Middle East and Africa Market Attractiveness by Channel, 2025-2035
  • Figure 210: Middle East and Africa Market Attractiveness by Country, 2025-2035

Frequently Asked Questions

How big is the Plant-Based Squalane Market in 2025?

The Plant-Based Squalane Market is estimated to be valued at USD 1,623.4 million in 2025.

What will be the size of the Plant-Based Squalane Market in 2035?

The market size for the Plant-Based Squalane Market is projected to reach USD 5,023.1 million by 2035.

How much will be the Plant-Based Squalane Market growth between 2025 and 2035?

The Plant-Based Squalane Market is expected to grow at a 12.0% CAGR between 2025 and 2035.

What are the key product types in the Plant-Based Squalane Market?

The key product types in the Plant-Based Squalane Market are creams/lotions, serums, oils, and sunscreens.

Which source segment will contribute significant share in the Plant-Based Squalane Market in 2025?

In terms of source, the sugarcane-derived segment will command 56.6% share in the Plant-Based Squalane Market in 2025.

Explore Similar Insights

Future Market Insights

Plant-Based Squalane Market

Chat With

MaRIA

Hi There, I am MaRIA, Your Market Research Intelligence Assistant. How may I help you?