Reports

- Global Locations -

Headquarters

Future Market Insights, Inc.

Christiana Corporate, 200
Continental Drive, Suite 401,
Newark, Delaware - 19713,
United States

T: +1-347-918-3531

Americas

Future Market Insights, Inc.

616 Corporate Way, Suite 2-9018,
Valley Cottage, NY 10989, United States

MEA

Future Market Insights

1602-6 Jumeirah Bay X2 Tower, Plot No: JLT-PH2-X2A,
Jumeirah Lakes Towers, Dubai,
United Arab Emirates

Europe

Future Market Insights

3rd Floor, 207 Regent Street,
W1B 3HH London
United Kingdom

T: + 44 (0) 20 8123 9659

Asia Pacific

Future Market Insights

IndiaLand Global Tech Park, Unit UG-1, Behind Grand HighStreet, Phase 1, Hinjawadi, MH, Pune – 411057, India

Plant-based Foam Market Outlook (2023 to 2033)

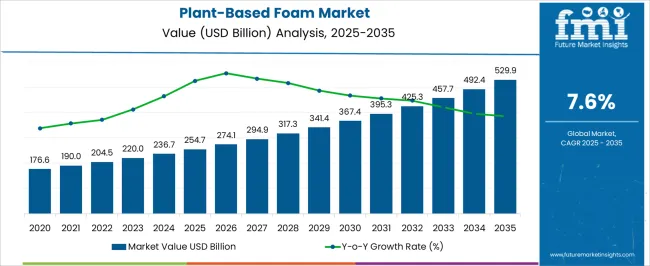
The plant-based foam market size is projected to be valued at US$ 220.0 million in 2023 and is expected to rise to US$ 457.0 million by 2033. The sales of plant-based foam are predicted to expand at a significant CAGR of 7.6% during the forecast period.

The market for plant-based foam is experiencing significant growth and holds great potential in various industries. Consumer preferences are shifting toward sustainable products, fueling the demand for plant-based foam. It finds applications in diverse sectors such as packaging, automotive, construction, furniture, bedding, and textiles, showcasing its versatility.

Regulatory support from governments and industry bodies further encourages the adoption of sustainable materials like plant-based foam. Collaboration among manufacturers, suppliers, and research institutions is driving innovation and technological advancements in the market. This competitive landscape is leading to improved product performance and expanding applications.

Increasing awareness campaigns and sustainability initiatives play a crucial role in educating consumers and industries about the benefits of plant-based foam. The global market for plant-based foam is expanding, with emerging economies like India and China becoming significant contributors. Although the current cost of plant-based foam may be high than traditional foam, economies of scale and advancements in manufacturing processes are expected to reduce costs in the future.

Overall, the market insights suggest a positive outlook for plant-based foam. The market is further bolstered by consumer demand, regulatory support, collaborations, technological advancements, and the growing need for sustainable alternatives in various industries.

Attribute Details
Plant-based Foam Market Estimated Size (2023) US$ 220.0 million
Plant-based Foam Market CAGR (2023 to 2033) 7.6%
Plant-based Foam Market Forecasted Size (2033) US$ 457.0 million

Don't pay for what you don't need

Customize your report by selecting specific countries or regions and save 30%!

Demand Survey of Plant-based Foam (2018 to 2022) Vs Market Predictions (2023 to 2033)

Historical Analysis: Looking at the past, we can observe the market's evolution and trends. Initially, plant-based foam faced limited adoption due to challenges such as high production costs and limited awareness. However, as sustainability became a significant concern, consumer preferences shifted toward eco-friendly materials. This led to increased demand for plant-based foam in various industries, including packaging, automotive, and construction.

Market players invested in research and development, improving the quality, performance, and cost-effectiveness of plant-based foam. Regulatory support also played a role, with governments implementing policies to promote sustainable materials. As a result, the market witnessed steady growth, with an expanding customer base and a broad range of applications.

Future Prediction: Looking ahead, the future of the plant-based foam market appears promising. Several factors contribute to this positive outlook. Firstly, growing environmental consciousness among consumers continues to drive demand for sustainable alternatives. As awareness about the harmful effects of traditional foam increases, many industries are expected to adopt plant-based foam as a green option.

Advancements in manufacturing technologies and economies of scale are likely to reduce production costs, making plant-based foam competitive with traditional foam. Cost reduction, coupled with the expanding market, is anticipated to drive further adoption and market growth.

Ongoing research and innovation efforts are anticipated to enhance the performance and properties of plant-based foam, opening up new opportunities in niche applications.

Plant-based foam market is predicted to expand at a healthy CAGR of 7.6% from 2023 to 2033, with the global market expected to close in on a valuation of US$ 457.0 million by 2033.

Comparative View of the Plant-based Foam Market

Plant-based Foam Market:

Attributes Plant-based Foam Market
CAGR (2023 to 2033) 7.6%
Market Value (2033) US$ 457.0 million
Growth Factor Growing environmental consciousness among consumers continues to drive demand for sustainable alternatives.
Opportunity Advancements in manufacturing technologies and economies of scale are likely to reduce production costs, making plant-based foam competitive with traditional foam.

Recyclable plastic films Market:

Attributes Recyclable plastic films Market
CAGR (2023 to 2033) 5.1%
Market Value (2033) US$ 39,785.0 million
Growth Factor Rising demand for flexible packaging across multiple industries is expected to drive significant demand for Plant-based Foam.
Opportunity Due to their eco-friendliness and durability, Plant-based Foam has grown in popularity across a wide range of industries.

Adhesive Transfer Tapes Market:

Attributes Adhesive Transfer Tapes Market
CAGR (2023 to 2033) 7.9%
Market Value (2033) US$ 168.59 billion
Growth Factor The adhesive transfer tape market is benefiting from the increased application of adhesive transfer tape in various sectors, an expanding urbanized population, and improved healthcare systems.
Opportunity Growing awareness and advanced wound care are expected to boost demand for new products in the global market.
Ismail Sutaria
Ismail Sutaria

Principal Consultant

Talk to Analyst

Find your sweet spots for generating winning opportunities in this market.

Category-wise Insights of Plant-based Foam

Soy-based Foam - An important Material Type Utilized Highly In the Plant-based Foam Market

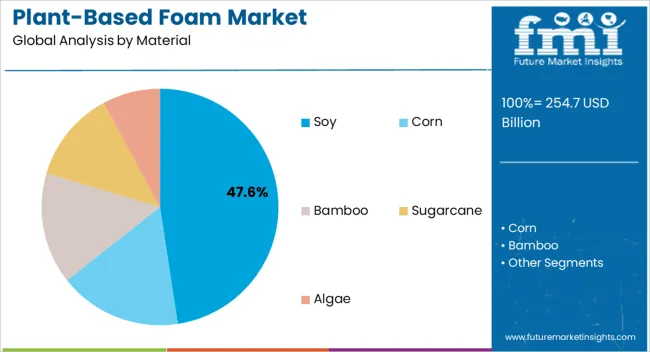
Soy-based foam segment captured a 40% market share in 2022 due to its renewable and sustainable nature. It is derived from soybean oil, which is a natural and abundant resource. Soy-based foam offers several advantages such as excellent cushioning properties, durability, and resistance to deformation. It is commonly used in the production of mattresses, furniture, automotive seating, and insulation materials.

The utilization of soy-based foam aligns with the growing demand for eco-friendly alternatives to traditional foam materials, as it reduces dependence on petroleum-based products and helps mitigate environmental impacts.

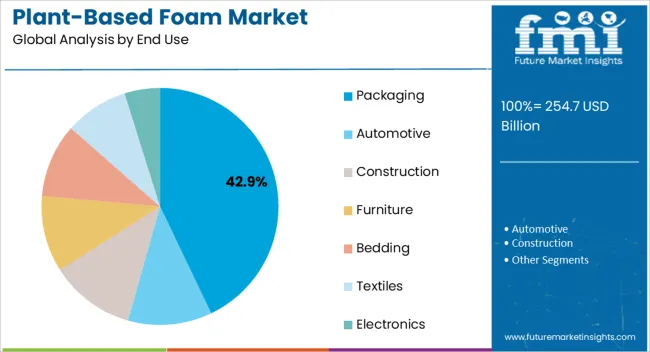
The Packaging Industry Holds a Significant Share of the Plant-based Foam Market, Accounting for around 50% of the market share.

Plant-based foam is widely used in various packaging applications, including the packaging of electronics, fragile goods, food and beverages, healthcare products, and other consumer goods. The packaging industry recognizes the need for sustainable and eco-friendly materials to meet the growing demand for environmentally conscious packaging solutions. Plant-based foam provides a renewable and biodegradable alternative to traditional foam materials, aligning with the industry's sustainability goals.

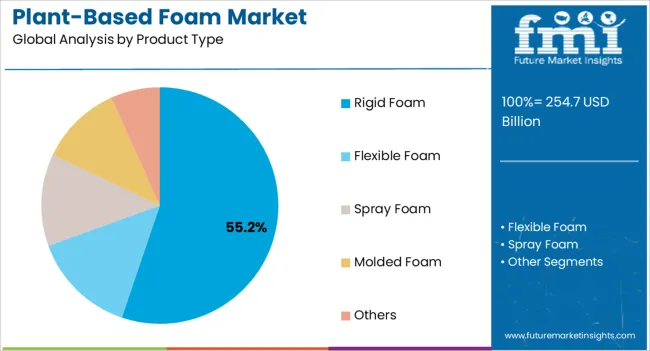
Flexible Foam Holds a Significant Share of the Plant-based Foam Market, Accounting for around 60% of the Market Share

It finds extensive application in various industries, including furniture, bedding, automotive, and packaging. Flexible foam provides excellent support, comfort, and durability, making it ideal for mattresses, cushions, seating, and upholstery. Its ability to conform to different shapes and sizes makes it a preferred choice for customized applications.

The utilization of flexible foam in the plant-based foam market continues to grow as the demand for sustainable and eco-friendly alternatives to traditional foam increases. Its dominance in the market reflects its widespread adoption across industries and its contribution to an environmentally conscious approach to foam materials.
Regional Analysis of the Plant-based Foam Market

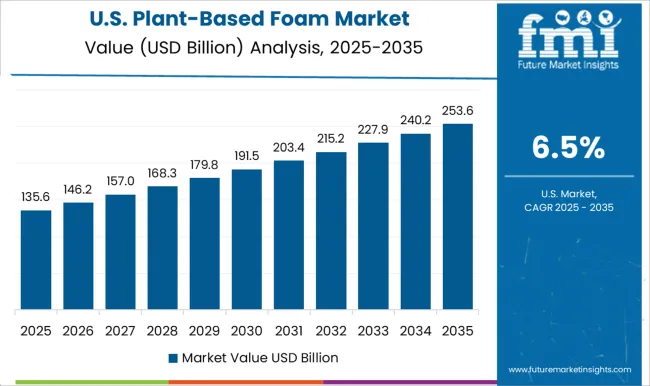
North America Plant-based Foam Market is Anticipated to Command 35% of the Global Market Share.

The region's strong presence can be attributed to several factors. Firstly, North America is characterized by a high level of consumer awareness and demand for sustainable and eco-friendly products. Consequently, this factor has driven the adoption of plant-based foam materials. Secondly, the region has well-established industries such as packaging, automotive, furniture, and bedding, which are key users of plant-based foam. Additionally, North America has seen the implementation of supportive regulations and initiatives promoting sustainability, further propelling market growth.

The presence of advanced manufacturing capabilities, research and development facilities, and a robust distribution network also contribute to the region's market share. North America is expected to continue its significant contribution to the plant-based foam market due to the factors such as:
  • Focus on environmental sustainability.
  • The increasing adoption of plant-based foam in various industries.

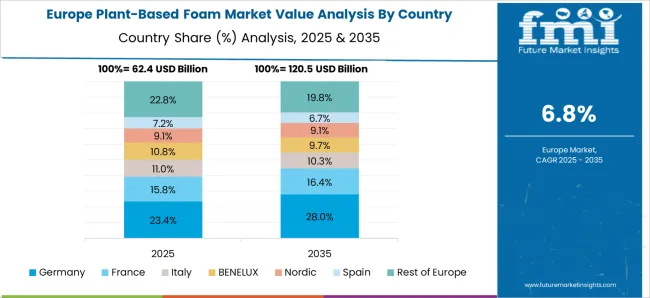
Europe Holds a Substantial Share of 29.7% in the Plant-based Foam Market, Playing a Significant Role in Driving the Growth and Development of the Industry.

Europe is one of the leading regions for the plant-based foam market. The market growth in this region is driven by important factors including:

  • The increasing demand for eco-friendly materials.
  • Stringent regulations on plastic usage.
  • Growing consumer awareness about sustainable products.

The presence of key automotive and packaging industries in the region is also contributing to the growth of the plant-based foam market. The market share of Europe in the global plant-based foam market is expected to continue to grow due to:

  • The increasing demand for sustainable and biodegradable products.
  • Government initiatives to reduce carbon footprint.
  • Advancements in plant-based foam technology.

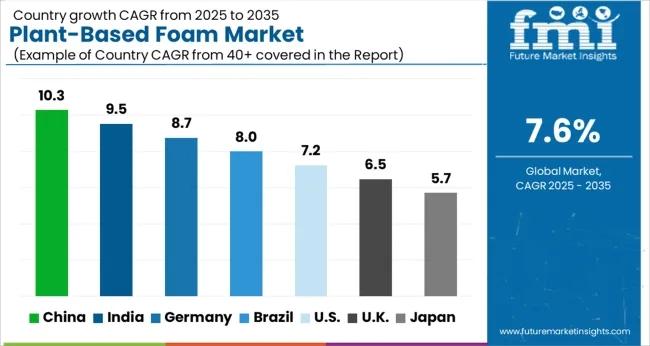
Favorable Policies are Leading Asia Pacific Market to Record a Growth Trajectory of 6.9% during the Analysis Period.

Asia Pacific region is expected to have a significant share in the plant-based foam market due to the increasing demand for eco-friendly and sustainable products in countries like China, India, Japan, and South Korea. The rising awareness regarding the environmental impact of conventional foam products and government initiatives to promote the use of bio-based products are driving the growth of the plant-based foam market in this region.

The increasing use of plant-based foam in the packaging, automotive, and construction industries is expected to fuel market growth in Asia Pacific region.

Get the data you need at a Fraction of the cost

Personalize your report by choosing insights you need
and save 40%!

Manufacturers and Service Providers can Consider the Following Strategies to Scale their Business in the Plant-based Foam market

  • Research and Development: Invest in research and development activities to continuously improve the quality, performance, and sustainability of plant-based foam products. This can involve exploring innovative materials, refining production processes, and optimizing product formulations to meet customer requirements and industry standards.
  • Collaboration and Partnerships: Collaborate with suppliers, industry associations, research institutions, and other stakeholders.
  • Foster knowledge exchange.
  • Share best practices.
  • Drive innovation in the plant-based foam market.

Partnerships can help expand market reach, access new technologies, and leverage combined expertise for mutual growth.

  • Market Segmentation: Identify specific target markets and segments where plant-based foam can offer unique value propositions. Tailor product offerings and marketing strategies cater to the needs and preferences of different industries, such as packaging, automotive, construction, and furniture.
  • Sustainability and Certification: Emphasize the environmental benefits and certifications associated with plant-based foam products. Highlight the use of renewable materials, reduced carbon footprint, and recyclability to attract environmentally conscious customers.
  • Branding and Marketing: Build a strong brand presence by highlighting the advantages of plant-based foam, such as its eco-friendliness, performance, and versatility. Utilize various marketing channels, including digital platforms and industry events, to raise awareness, educate customers, and differentiate from competitors.
  • Supply Chain Optimization: Streamline the supply chain to ensure a reliable and efficient flow of raw materials, production processes, and distribution channels. Optimize sourcing strategies, manage inventory effectively, and build strong relationships with suppliers to maintain cost competitiveness and meet customer demands.
  • Customer Engagement: Engage with customers and understand their specific requirements, preferences, and sustainability goals. Offer personalized solutions, provide technical support, and establish long-term partnerships to foster customer loyalty and drive repeat business.
  • Regulatory Compliance: Stay updated with evolving regulations related to foam materials, recycling, and environmental standards. Ensure compliance with regional and international regulations to build trust with customers, enhance market reputation, and mitigate potential risks.

By adopting these strategies, manufacturers and service providers can position themselves for growth and capitalize on the increasing demand for plant-based foam products in the market.
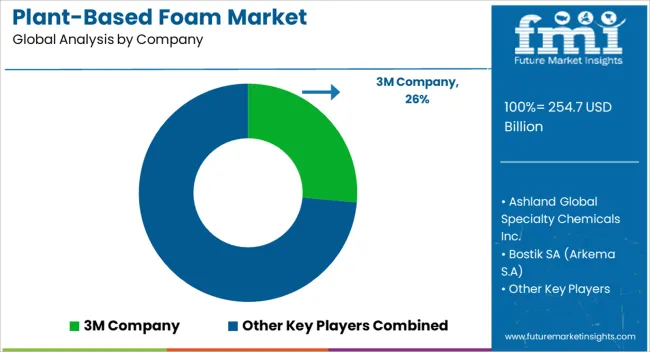
The Competitive Landscape in the Plant-based Foam Market is Characterized by the Presence of Several Key Players Striving to Capture a Significant Market Share

Key players are actively involved in research and development activities, partnerships, and strategic initiatives to strengthen their market position. The market is dynamic, with continuous advancements in technology and increasing consumer demand for eco-friendly alternatives, driving competition and fostering innovation in the plant-based foam market.

Some of the Key Players Operating in the Plant-based Foam Market Include:

3M Company, Ashland Global Specialty Chemicals Inc., Bostik SA (Arkema S. A), Coim Group, DIC Corporation, Dow Inc., DuPont de Nemours Inc., Evonik Industries AG, Flint Group, H.B. Fuller Company, Henkel AG & Co. KGaA, L.D. Davis Industries Inc., Sika AG, and Vimasco Corporation.

Scope of the Report

Attribute Details
Growth Rate CAGR of 7.6% from 2023 to 2033
Base Year of Estimation 2022
Historical Data 2018 to 2022
Forecast Period 2023 to 2033
Quantitative Units Revenue in US$ million and Volume in Units and F-CAGR from 2023 to 2033
Report Coverage Revenue Forecast, Volume Forecast, Company Ranking, Competitive Landscape, growth factors, Trends, and Pricing Analysis
Key Segments Covered
  • Material
  • Product
  • End-use Industry
  • By Region
Regions Covered
  • North America
  • Latin America
  • Europe
  • East Asia
  • South Asia
  • The Middle East & Africa
  • Oceania
Key Countries Profiled
  • The United States
  • Canada
  • Brazil
  • Mexico
  • Germany
  • Italy
  • France
  • The United Kingdom
  • Spain
  • Russia
  • China
  • Japan
  • India
  • GCC Countries
  • Australia
Key Companies Profiled 3M Company, Ashland Global Specialty Chemicals Inc., Bostik SA (Arkema S.A), Coim Group, DIC Corporation, Dow Inc., DuPont de Nemours Inc., Evonik Industries AG, Flint Group, H.B. Fuller Company, Henkel AG & Co. KGaA, L.D. Davis Industries Inc., Sika AG, and Vimasco Corporation.
Customization & Pricing Available upon Request

Key Segments Covered in the Plant-based Foam Market Report

By Material:

  • Soy
  • Corn
  • Bamboo
  • Sugarcane
  • Algae

By Product Type:

  • Rigid Foam
  • Flexible Foam
  • Spray Foam
  • Molded Foam
  • Others

By End Use:

  • Packaging
  • Automotive
  • Construction
  • Furniture
  • Bedding
  • Textiles,
  • Electronics.

By Region:

  • North America
  • Latin America
  • Western Europe
  • Eastern Europe
  • Asia Pacific Excluding Japan (APEJ)
  • Japan
  • The Middle East & Africa (MEA)

Frequently Asked Questions

What is the Size of Plant-based Foam Market?

The plant-based foam market is worth US$ 220.0 million in 2023.

Is Plant-based Foam Business Profitable?

The plant-based foam business is profitable, expanding at a CAGR of 7.6% through 2033.

Which Factors are Driving the Market Growth?

Growing awareness about the sustainable alternatives and technological advances in manufacturing processes are driving the market.

Who are the Producers of Plant-based Foam?

Coim Group, DIC Corporation, and Dow Inc. are the producers of plant-based foam.

How Can Manufacturers Enhance their Market Share?

Manufacturers can partner, collaborate, and exchange knowledge to enhance their market share.

Table of Content

1. Executive Summary

    1.1. Global Market Outlook

    1.2. Demand-side Trends

    1.3. Supply-side Trends

    1.4. Technology Roadmap Analysis

    1.5. Analysis and Recommendations

2. Market Overview

    2.1. Market Coverage / Taxonomy

    2.2. Market Definition / Scope / Limitations

3. Market Background

    3.1. Market Dynamics

        3.1.1. Drivers

        3.1.2. Restraints

        3.1.3. Opportunity

        3.1.4. Trends

    3.2. Scenario Forecast

        3.2.1. Demand in Optimistic Scenario

        3.2.2. Demand in Likely Scenario

        3.2.3. Demand in Conservative Scenario

    3.3. Product Launches & Recent Developments

    3.4. Product Life Cycle Analysis

    3.5. Value Chain Analysis

        3.5.1. Supply Side Participants and Their Roles

            3.5.1.1. Producers

            3.5.1.2. Mid-Level Participants (Traders/ Agents/ Brokers)

            3.5.1.3. Wholesalers and Distributors

        3.5.2. % of Operating Margin Analysis

        3.5.3. List of Existing and Potential Buyers

    3.6. Pricing Analysis

        3.6.1. Price Point Assessment by Region

        3.6.2. Price Point Assessment by Production

        3.6.3. Price Forecast till 2033

        3.6.4. Factors affecting pricing

    3.7. Forecast Factors - Relevance & Impact

    3.8. Regulatory Landscape

    3.9. Regional Parent Market Outlook

    3.10. Production and Consumption Statistics

    3.11. Consumers Survey Analysis

    3.12. Macro-Economic Factors

4. Global Analysis 2018 to 2022 and Forecast, 2023 to 2033

    4.1. Historical Market Size Value (US$ Million) & Volume (Tonnes) Analysis, 2018 to 2022

    4.2. Current and Future Market Size Value (US$ Million) & Volume (Tonnes) Projections, 2023 to 2033

        4.2.1. Y-o-Y Growth Trend Analysis

        4.2.2. Absolute $ Opportunity Analysis

5. Global Analysis 2018 to 2022 and Forecast 2023 to 2033, By Material

    5.1. Introduction / Key Findings

    5.2. Historical Market Size Value (US$ Million) & Volume (Tonnes) Analysis By Material, 2018 to 2022

    5.3. Current and Future Market Size Value (US$ Million) & Volume (Tonnes) Analysis and Forecast By Material,2023 to 2033

        5.3.1. Soy-based Foam

        5.3.2. Corn-based Foam

        5.3.3. Algae-based Foam

        5.3.4. Coconut-based Foam

        5.3.5. Sugarcane-based Foam

        5.3.6. Others (Latex, Palm, etc.)

    5.4. Y-o-Y Growth Trend Analysis By Material, 2018 to 2022

    5.5. Absolute $ Opportunity Analysis By Material, 2023 to 2033

6. Global Analysis 2018 to 2022 and Forecast 2023 to 2033, By Product Type

    6.1. Introduction / Key Findings

    6.2. Historical Market Size Value (US$ Million) & Volume (Tonnes) Analysis By Product Type, 2018 to 2022

    6.3. Current and Future Market Size Value (US$ Million) & Volume (Tonnes) Analysis and Forecast By Product Type, 2023 to 2033

        6.3.1. Flexible Foam

        6.3.2. Rigid Foam

        6.3.3. Spray Foam

        6.3.4. Molded Foam

        6.3.5. Others (Laminated Foam, etc.)

    6.4. Y-o-Y Growth Trend Analysis By Product Type, 2018 to 2022

    6.5. Absolute $ Opportunity Analysis By Product Type, 2023 to 2033

7. Global Analysis 2018 to 2022 and Forecast 2023 to 2033, By End Use

    7.1. Introduction / Key Findings

    7.2. Historical Market Size Value (US$ Million) & Volume (Tonnes) Analysis By End Use, 2018 to 2022

    7.3. Current and Future Market Size Value (US$ Million) & Volume (Tonnes) Analysis and Forecast By End Use, 2023 to 2033

        7.3.1. Automotive

        7.3.2. Furniture and Bedding

        7.3.3. Packaging

        7.3.4. Construction and Building

        7.3.5. Electrical & Electronics

        7.3.6. Apparel and Textiles

        7.3.7. Healthcare

        7.3.8. Others (Aerospace, etc.)

    7.4. Y-o-Y Growth Trend Analysis By End Use, 2018 to 2022

    7.5. Absolute $ Opportunity Analysis By End Use, 2023 to 2033

8. Global Analysis 2018 to 2022 and Forecast 2023 to 2033, By Region

    8.1. Introduction

    8.2. Historical Market Size Value (US$ Million) & Volume (Tonnes) Analysis By Region, 2018 to 2022

    8.3. Current Market Size Value (US$ Million) & Volume (Tonnes) Analysis and Forecast By Region, 2023 to 2033

        8.3.1. North America

        8.3.2. Latin America

        8.3.3. Europe

        8.3.4. East Asia

        8.3.5. South Asia

        8.3.6. Oceania

        8.3.7. MEA

    8.4. Market Attractiveness Analysis By Region

9. North America Analysis 2018 to 2022 and Forecast 2023 to 2033, By Country

    9.1. Historical Market Size Value (US$ Million) & Volume (Tonnes) Trend Analysis By Market Taxonomy, 2018 to 2022

    9.2. Market Size Value (US$ Million) & Volume (Tonnes) Forecast By Market Taxonomy, 2023 to 2033

        9.2.1. By Country

            9.2.1.1. USA

            9.2.1.2. Canada

        9.2.2. By Material

        9.2.3. By Product Type

        9.2.4. By End Use

    9.3. Market Attractiveness Analysis

        9.3.1. By Country

        9.3.2. By Material

        9.3.3. By Product Type

        9.3.4. By End Use

    9.4. Key Takeaways

10. Latin America Analysis 2018 to 2022 and Forecast 2023 to 2033, By Country

    10.1. Historical Market Size Value (US$ Million) & Volume (Tonnes) Trend Analysis By Market Taxonomy, 2018 to 2022

    10.2. Market Size Value (US$ Million) & Volume (Tonnes) Forecast By Market Taxonomy, 2023 to 2033

        10.2.1. By Country

            10.2.1.1. Brazil

            10.2.1.2. Mexico

            10.2.1.3. Argentina

            10.2.1.4. Chile

            10.2.1.5. Peru

            10.2.1.6. Rest of Latin America

        10.2.2. By Material

        10.2.3. By Product Type

        10.2.4. By End Use

    10.3. Market Attractiveness Analysis

        10.3.1. By Country

        10.3.2. By Material

        10.3.3. By Product Type

        10.3.4. By End Use

    10.4. Key Takeaways

11. Europe Analysis 2018 to 2022 and Forecast 2023 to 2033, By Country

    11.1. Historical Market Size Value (US$ Million) & Volume (Tonnes) Trend Analysis By Market Taxonomy, 2018 to 2022

    11.2. Market Size Value (US$ Million) & Volume (Tonnes) Forecast By Market Taxonomy, 2023 to 2033

        11.2.1. By Country

            11.2.1.1. Germany

            11.2.1.2. Italy

            11.2.1.3. France

            11.2.1.4. UK

            11.2.1.5. Spain

            11.2.1.6. Russia

            11.2.1.7. BENELUX

            11.2.1.8. Poland

            11.2.1.9. Nordic Countries

            11.2.1.10. Rest of Europe

        11.2.2. By Material

        11.2.3. By Product Type

        11.2.4. By End Use

    11.3. Market Attractiveness Analysis

        11.3.1. By Country

        11.3.2. By Material

        11.3.3. By Product Type

        11.3.4. By End Use

    11.4. Key Takeaways

12. East Asia Analysis 2018 to 2022 and Forecast 2023 to 2033, By Country

    12.1. Historical Market Size Value (US$ Million) & Volume (Tonnes) Trend Analysis By Market Taxonomy, 2018 to 2022

    12.2. Market Size Value (US$ Million) & Volume (Tonnes) Forecast By Market Taxonomy, 2023 to 2033

        12.2.1. By Country

            12.2.1.1. China

            12.2.1.2. Japan

            12.2.1.3. South Korea

        12.2.2. By Material

        12.2.3. By Product Type

        12.2.4. By End Use

    12.3. Market Attractiveness Analysis

        12.3.1. By Country

        12.3.2. By Material

        12.3.3. By Product Type

        12.3.4. By End Use

    12.4. Key Takeaways

13. South Asia Analysis 2018 to 2022 and Forecast 2023 to 2033, By Country

    13.1. Historical Market Size Value (US$ Million) & Volume (Tonnes) Trend Analysis By Market Taxonomy, 2018 to 2022

    13.2. Market Size Value (US$ Million) & Volume (Tonnes) Forecast By Market Taxonomy, 2023 to 2033

        13.2.1. By Country

            13.2.1.1. India

            13.2.1.2. Thailand

            13.2.1.3. Malaysia

            13.2.1.4. Indonesia

            13.2.1.5. Singapore

            13.2.1.6. Rest of South Asia

        13.2.2. By Material

        13.2.3. By Product Type

        13.2.4. By End Use

    13.3. Market Attractiveness Analysis

        13.3.1. By Country

        13.3.2. By Material

        13.3.3. By Product Type

        13.3.4. By End Use

    13.4. Key Takeaways

14. Oceania Analysis 2018 to 2022 and Forecast 2023 to 2033, By Country

    14.1. Historical Market Size Value (US$ Million) & Volume (Tonnes) Trend Analysis By Market Taxonomy, 2018 to 2022

    14.2. Market Size Value (US$ Million) & Volume (Tonnes) Forecast By Market Taxonomy, 2023 to 2033

        14.2.1. By Country

            14.2.1.1. Australia

            14.2.1.2. New Zealand

        14.2.2. By Material

        14.2.3. By Product Type

        14.2.4. By End Use

    14.3. Market Attractiveness Analysis

        14.3.1. By Country

        14.3.2. By Material

        14.3.3. By Product Type

        14.3.4. By End Use

    14.4. Key Takeaways

15. MEA Analysis 2018 to 2022 and Forecast 2023 to 2033, By Country

    15.1. Historical Market Size Value (US$ Million) & Volume (Tonnes) Trend Analysis By Market Taxonomy, 2018 to 2022

    15.2. Market Size Value (US$ Million) & Volume (Tonnes) Forecast By Market Taxonomy, 2023 to 2033

        15.2.1. By Country

            15.2.1.1. GCC Countries

            15.2.1.2. South Africa

            15.2.1.3. Central Africa

            15.2.1.4. North Africa

        15.2.2. By Material

        15.2.3. By Product Type

        15.2.4. By End Use

    15.3. Market Attractiveness Analysis

        15.3.1. By Country

        15.3.2. By Material

        15.3.3. By Product Type

        15.3.4. By End Use

    15.4. Key Takeaways

16. Key Countries Analysis

    16.1. USA

        16.1.1. Pricing Analysis

        16.1.2. Market Share Analysis, 2023

            16.1.2.1. By Material

            16.1.2.2. By Product Type

            16.1.2.3. By End Use

    16.2. Canada

        16.2.1. Pricing Analysis

        16.2.2. Market Share Analysis, 2023

            16.2.2.1. By Material

            16.2.2.2. By Product Type

            16.2.2.3. By End Use

    16.3. Brazil

        16.3.1. Pricing Analysis

        16.3.2. Market Share Analysis, 2023

            16.3.2.1. By Material

            16.3.2.2. By Product Type

            16.3.2.3. By End Use

    16.4. Mexico

        16.4.1. Pricing Analysis

        16.4.2. Market Share Analysis, 2023

            16.4.2.1. By Material

            16.4.2.2. By Product Type

            16.4.2.3. By End Use

    16.5. Argentina

        16.5.1. Pricing Analysis

        16.5.2. Market Share Analysis, 2023

            16.5.2.1. By Material

            16.5.2.2. By Product Type

            16.5.2.3. By End Use

    16.6. Chile

        16.6.1. Pricing Analysis

        16.6.2. Market Share Analysis, 2023

            16.6.2.1. By Material

            16.6.2.2. By Product Type

            16.6.2.3. By End Use

    16.7. Peru

        16.7.1. Pricing Analysis

        16.7.2. Market Share Analysis, 2023

            16.7.2.1. By Material

            16.7.2.2. By Product Type

            16.7.2.3. By End Use

    16.8. Germany

        16.8.1. Pricing Analysis

        16.8.2. Market Share Analysis, 2023

            16.8.2.1. By Material

            16.8.2.2. By Product Type

            16.8.2.3. By End Use

    16.9. Italy

        16.9.1. Pricing Analysis

        16.9.2. Market Share Analysis, 2023

            16.9.2.1. By Material

            16.9.2.2. By Product Type

            16.9.2.3. By End Use

    16.10. France

        16.10.1. Pricing Analysis

        16.10.2. Market Share Analysis, 2023

            16.10.2.1. By Material

            16.10.2.2. By Product Type

            16.10.2.3. By End Use

    16.11. Spain

        16.11.1. Pricing Analysis

        16.11.2. Market Share Analysis, 2023

            16.11.2.1. By Material

            16.11.2.2. By Product Type

            16.11.2.3. By End Use

    16.12. UK

        16.12.1. Pricing Analysis

        16.12.2. Market Share Analysis, 2023

            16.12.2.1. By Material

            16.12.2.2. By Product Type

            16.12.2.3. By End Use

    16.13. Russia

        16.13.1. Pricing Analysis

        16.13.2. Market Share Analysis, 2023

            16.13.2.1. By Material

            16.13.2.2. By Product Type

            16.13.2.3. By End Use

    16.14. Poland

        16.14.1. Pricing Analysis

        16.14.2. Market Share Analysis, 2023

            16.14.2.1. By Material

            16.14.2.2. By Product Type

            16.14.2.3. By End Use

    16.15. BENELUX

        16.15.1. Pricing Analysis

        16.15.2. Market Share Analysis, 2023

            16.15.2.1. By Material

            16.15.2.2. By Product Type

            16.15.2.3. By End Use

    16.16. Nordic Countries

        16.16.1. Pricing Analysis

        16.16.2. Market Share Analysis, 2023

            16.16.2.1. By Material

            16.16.2.2. By Product Type

            16.16.2.3. By End Use

    16.17. China

        16.17.1. Pricing Analysis

        16.17.2. Market Share Analysis, 2023

            16.17.2.1. By Material

            16.17.2.2. By Product Type

            16.17.2.3. By End Use

    16.18. Japan

        16.18.1. Pricing Analysis

        16.18.2. Market Share Analysis, 2023

            16.18.2.1. By Material

            16.18.2.2. By Product Type

            16.18.2.3. By End Use

    16.19. South Korea

        16.19.1. Pricing Analysis

        16.19.2. Market Share Analysis, 2023

            16.19.2.1. By Material

            16.19.2.2. By Product Type

            16.19.2.3. By End Use

    16.20. India

        16.20.1. Pricing Analysis

        16.20.2. Market Share Analysis, 2023

            16.20.2.1. By Material

            16.20.2.2. By Product Type

            16.20.2.3. By End Use

    16.21. Thailand

        16.21.1. Pricing Analysis

        16.21.2. Market Share Analysis, 2023

            16.21.2.1. By Material

            16.21.2.2. By Product Type

            16.21.2.3. By End Use

    16.22. Indonesia

        16.22.1. Pricing Analysis

        16.22.2. Market Share Analysis, 2023

            16.22.2.1. By Material

            16.22.2.2. By Product Type

            16.22.2.3. By End Use

    16.23. Malaysia

        16.23.1. Pricing Analysis

        16.23.2. Market Share Analysis, 2023

            16.23.2.1. By Material

            16.23.2.2. By Product Type

            16.23.2.3. By End Use

    16.24. Singapore

        16.24.1. Pricing Analysis

        16.24.2. Market Share Analysis, 2023

            16.24.2.1. By Material

            16.24.2.2. By Product Type

            16.24.2.3. By End Use

    16.25. Australia

        16.25.1. Pricing Analysis

        16.25.2. Market Share Analysis, 2023

            16.25.2.1. By Material

            16.25.2.2. By Product Type

            16.25.2.3. By End Use

    16.26. New Zealand

        16.26.1. Pricing Analysis

        16.26.2. Market Share Analysis, 2023

            16.26.2.1. By Material

            16.26.2.2. By Product Type

            16.26.2.3. By End Use

    16.27. GCC Countries

        16.27.1. Pricing Analysis

        16.27.2. Market Share Analysis, 2023

            16.27.2.1. By Material

            16.27.2.2. By Product Type

            16.27.2.3. By End Use

    16.28. South Africa

        16.28.1. Pricing Analysis

        16.28.2. Market Share Analysis, 2023

            16.28.2.1. By Material

            16.28.2.2. By Product Type

            16.28.2.3. By End Use

    16.29. North Africa

        16.29.1. Pricing Analysis

        16.29.2. Market Share Analysis, 2023

            16.29.2.1. By Material

            16.29.2.2. By Product Type

            16.29.2.3. By End Use

    16.30. Central Africa

        16.30.1. Pricing Analysis

        16.30.2. Market Share Analysis, 2023

            16.30.2.1. By Material

            16.30.2.2. By Product Type

            16.30.2.3. By End Use

17. Market Structure Analysis

    17.1. Competition Dashboard

    17.2. Competition Benchmarking

    17.3. Market Share Analysis of Top Players

        17.3.1. By Regional

        17.3.2. By Material

        17.3.3. By Product Type

        17.3.4. By End Use

18. Competition Analysis

    18.1. Competition Deep Dive

        18.1.1. Woodbridge INOAC

            18.1.1.1. Overview

            18.1.1.2. Product Portfolio

            18.1.1.3. Profitability by Market Segments (Product/Age /Sales Channel/Region)

            18.1.1.4. Sales Footprint

            18.1.1.5. Strategy Overview

                18.1.1.5.1. Marketing Strategy

                18.1.1.5.2. Product Strategy

                18.1.1.5.3. Channel Strategy

        18.1.2. Sealed Air Corporation

            18.1.2.1. Overview

            18.1.2.2. Product Portfolio

            18.1.2.3. Profitability by Market Segments (Product/Age /Sales Channel/Region)

            18.1.2.4. Sales Footprint

            18.1.2.5. Strategy Overview

                18.1.2.5.1. Marketing Strategy

                18.1.2.5.2. Product Strategy

                18.1.2.5.3. Channel Strategy

        18.1.3. Bioleic

            18.1.3.1. Overview

            18.1.3.2. Product Portfolio

            18.1.3.3. Profitability by Market Segments (Product/Age /Sales Channel/Region)

            18.1.3.4. Sales Footprint

            18.1.3.5. Strategy Overview

                18.1.3.5.1. Marketing Strategy

                18.1.3.5.2. Product Strategy

                18.1.3.5.3. Channel Strategy

        18.1.4. KTM Industries, Inc.

            18.1.4.1. Overview

            18.1.4.2. Product Portfolio

            18.1.4.3. Profitability by Market Segments (Product/Age /Sales Channel/Region)

            18.1.4.4. Sales Footprint

            18.1.4.5. Strategy Overview

                18.1.4.5.1. Marketing Strategy

                18.1.4.5.2. Product Strategy

                18.1.4.5.3. Channel Strategy

        18.1.5. Huntsman Corporation

            18.1.5.1. Overview

            18.1.5.2. Product Portfolio

            18.1.5.3. Profitability by Market Segments (Product/Age /Sales Channel/Region)

            18.1.5.4. Sales Footprint

            18.1.5.5. Strategy Overview

                18.1.5.5.1. Marketing Strategy

                18.1.5.5.2. Product Strategy

                18.1.5.5.3. Channel Strategy

        18.1.6. Bewi

            18.1.6.1. Overview

            18.1.6.2. Product Portfolio

            18.1.6.3. Profitability by Market Segments (Product/Age /Sales Channel/Region)

            18.1.6.4. Sales Footprint

            18.1.6.5. Strategy Overview

                18.1.6.5.1. Marketing Strategy

                18.1.6.5.2. Product Strategy

                18.1.6.5.3. Channel Strategy

        18.1.7. Trocellen GmbH

            18.1.7.1. Overview

            18.1.7.2. Product Portfolio

            18.1.7.3. Profitability by Market Segments (Product/Age /Sales Channel/Region)

            18.1.7.4. Sales Footprint

            18.1.7.5. Strategy Overview

                18.1.7.5.1. Marketing Strategy

                18.1.7.5.2. Product Strategy

                18.1.7.5.3. Channel Strategy

        18.1.8. Nomaco

            18.1.8.1. Overview

            18.1.8.2. Product Portfolio

            18.1.8.3. Profitability by Market Segments (Product/Age /Sales Channel/Region)

            18.1.8.4. Sales Footprint

            18.1.8.5. Strategy Overview

                18.1.8.5.1. Marketing Strategy

                18.1.8.5.2. Product Strategy

                18.1.8.5.3. Channel Strategy

19. Assumptions & Acronyms Used

20. Research Methodology

Explore Packaging Insights

View Reports