Foam Cooler Box Market Size and Share Forecast Outlook 2025 to 2035

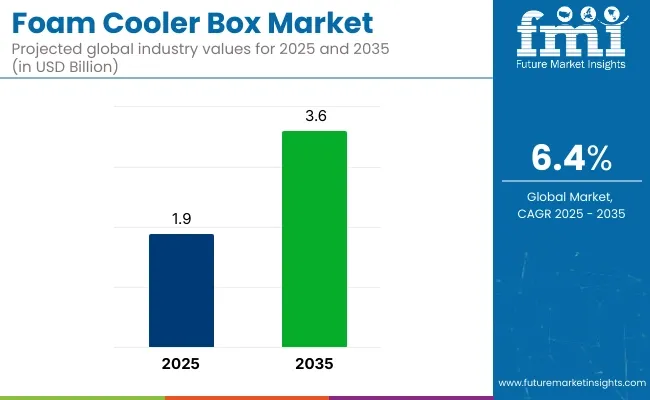
The foam cooler box market is projected to grow from USD 1.9 billion in 2025 to USD 3.6 billion by 2035, registering a CAGR of 6.4% during the forecast period. Sales in 2024 reached USD 1.7 billion, signaling a stable rise in demand across cold chain logistics, pharmaceuticals, food delivery, and recreational applications.

This growth has been attributed to the increasing emphasis on thermal insulation performance, portability, and product safety during transport. As temperature-sensitive products continue to expand in volume across industries, the demand for efficient, reliable, and reusable cooling systems has been steadily reinforced by regulatory frameworks and evolving customer expectations.
Foam Cooler Box Market

Metric Value
Market Size in 2025 USD 1.9 billion
Projected Market Size in 2035 USD 3.6 billion
CAGR (2025 to 2035) 6.4%

Strategic investments in foam cooler production lines and innovation centers have been witnessed among leading players aiming to meet global cold chain and e-commerce delivery standards. Sonoco ThermoSafe, one of the world’s largest providers of thermal assurance packaging, announces expansion of its operations aimed at better serving customers across the United States and around the globe. With a strong commitment to efficiency, quality, and customer satisfaction, Sonoco ThermoSafe is investing in cutting-edge machinery, automation, and improved production capabilities.

“We believe that this expansion will significantly enhance our ability to serve our customers not only across America but also on a global scale,” said Jim Lassiter, Vice President & General Manager, Sonoco ThermoSafe. “Our investments in technology and automation underscore our commitment to delivering the best products while maintaining the utmost efficiency.”

The foam cooler box industry has been influenced significantly by sustainability mandates and the shift toward circular economy practices. Substitutes for expanded polystyrene (EPS) such as biodegradable foam composites and molded pulp have been progressively introduced. Eco-labeling and life cycle analyses have been prioritized to ensure compliance with regulatory expectations in North America and Europe.

Advances in vacuum insulation panels (VIP) and phase-change materials (PCM) have also been deployed in high-performance segments, particularly within pharmaceutical and biotech logistics. These efforts have been supported by increasing customer awareness and rising penalties for non-recyclable materials in several markets.

The foam cooler box market is expected to witness continued demand across food & beverages and healthcare. Cold chain optimization efforts are likely to fuel further innovations in container ergonomics, durability, and thermal efficiency. Market penetration is expected to deepen in emerging economies as online food delivery and vaccine storage infrastructure expand.

Companies emphasizing biodegradable designs, lightweight logistics, and digital temperature tracking systems are projected to retain competitive advantages. Continued alignment with environmental regulations and evolving logistics expectations will be critical in shaping long-term growth.

Analyzing Foam Cooler Box Market by Top Investment Segments

Expanded Polystyrene (EPS) Anticipated to Lead Due to Superior Insulation and Cost Efficiency

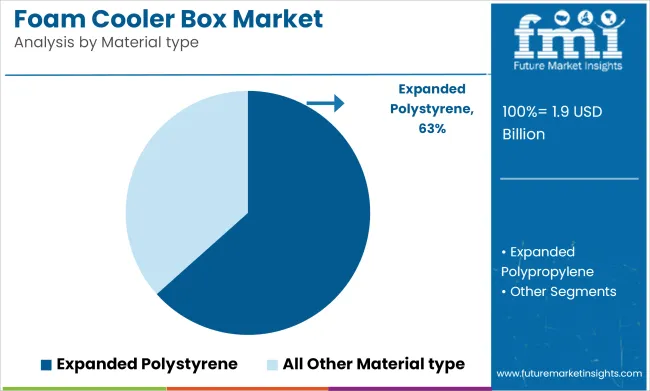
Expanded Polystyrene (EPS) is expected to account for approximately 63.4% of the foam cooler box market by 2025, as it has been widely adopted for its lightweight structure, excellent thermal insulation, and cost-effectiveness in short-term cold chain applications. EPS cooler boxes have been manufactured to provide high resistance to temperature fluctuations, ensuring the preservation of perishable goods during transportation.

A rigid cellular structure has enabled EPS to maintain consistent internal temperatures, even in external heat or humidity, making it ideal for food delivery, laboratory samples, and retail packaging. The material has also been engineered to be moisture-resistant and impact-absorbent, further protecting contents against environmental and mechanical stress.
Foam Cooler Box Market Analysis By Material Type

EPS cooler boxes have been mass-produced using low-cost molding processes, which has facilitated widespread adoption in disposable and limited-use scenarios, especially in developing markets and cost-sensitive industries. Despite growing environmental concerns, recycling programs and low material density have supported its continued use in insulated packaging.

As demand for efficient, scalable, and lightweight thermal containers increases, EPS is projected to retain its leading role in foam cooler box manufacturing due to its proven balance of performance, availability, and affordability.

Food & Beverage Industry to Dominate Owing to Perishable Goods Distribution and Delivery Expansion

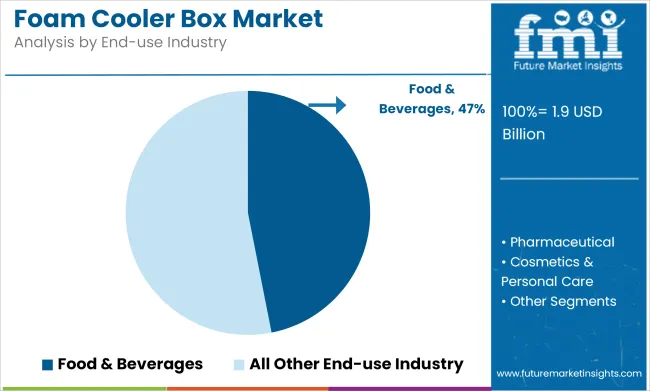
The food and beverages industry is projected to lead the foam cooler box market by 2025, capturing an estimated 46.9% market share, as insulated containers have been extensively used to support last-mile delivery, temperature-sensitive transport, and meal kit distribution. Demand for cold-chain logistics solutions has been intensified by the global rise in e-commerce grocery platforms, online food delivery services, and ready-to-eat packaged goods.
Foam Cooler Box Market Analysis By End Use Industry

Foam cooler boxes have been employed to protect dairy products, frozen meals, fresh produce, seafood, and beverages against spoilage and quality degradation during short- and medium-range transit. Their ability to maintain chilled or frozen conditions for extended periods without external power sources has been widely leveraged by both small-scale vendors and large food chains.

The foodservice sector has increasingly relied on insulated foam containers to meet growing consumer expectations for freshness, safety, and convenience. Lightweight handling, stack ability, and cost-effective production have contributed to their widespread distribution across urban and rural channels alike. As the global food delivery infrastructure expands and temperature integrity becomes a quality differentiator in food logistics, foam cooler boxes used in the food and beverage segment are expected to maintain dominance through 2025 and beyond.

Challenges and Opportunities

Challenges

Environmental Concerns, Regulatory Restrictions, and Competition from Sustainable Alternatives

Rising environmental concerns regarding the use of expanded polystyrene (EPS) and non-biodegradable foam material is a restraint in growth of the market. Because of the many countries introducing bans on plastic, manufacturers are seeking other sustainable materials. Sustainable cooler alternatives are also gaining ground, with biodegradable, reusable and recyclable coolers threatening to become players in the space. Supply chain disruptions and volatile raw-material costs only compound the challenge for manufacturers.

Opportunities

Cold Chain Logistics, Outdoor Recreation, and Green Foam Innovations Will Forge Ahead

This demand leads to low operating margins and increasingly tight supply chains, and that doesn’t seem to be slowing down temperature-specific orders, particularly for pharmaceuticals, food delivery and outdoor recreation. The expansion of the cold chain logistics industry, especially for the movement of vaccines and perishable goods, is pushing the market need for cold chain logistics.

Bio-based foams, recyclable EPS coolers, and lightweight insulation technologies allow producers to achieve sustainability goals without sacrificing product performance. Rising trend of camping, fishing and outdoor leisure activities is further boosting the consumer demand for portable cooler boxes.
Country-Wise Outlook

Country Wise Analysis Of Foam Cooler Box Market

United States

Due to increasing demand for temperature-sensitive packaging in pharmaceuticals, food logistics, and outdoor recreation, the USA foam cooler box market is expanding. The market is on the rise due to high presence of cold chain logistics providers as well as medical supplies transport companies.

The growing popularity of meal-kit delivery services and fresh food e-commerce is also contributing to the demand for lightweight, cost-effective insulation solutions. But growing regulatory pressure to eliminate single-use EPS foam is leading manufacturers to seek out recyclable and plant-based foam alternatives. Industry heavyweight players are also bets on advanced insulation technologies and biodegradable cooling solutions in light of changing regulations.

Country CAGR (2025 to 2035)
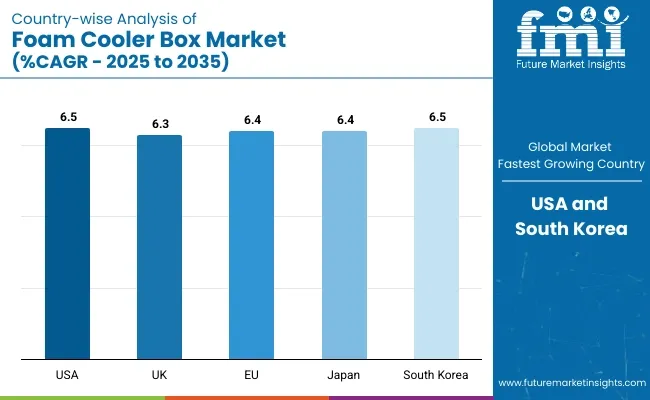
USA 6.5%

United Kingdom

The UK market is growing at a highly robust rate owing to strict eco-friendly legislation, placing a greater emphasis on environmentally friendly packaging. Government regulations are pushing alternative packaging materials like biodegradable and recyclable materials to replace EPS foam that traditionally fills shipping boxes.

The growing food delivery & grocery e-commerce sector and rising demand for cold chain pharmaceutical logistics are fuelling the market growth. To find a middle ground between environmental sustainability and cost-effectiveness, companies are experimenting with hybrid packaging solutions, like foam-corrugated paper combinations. As such, the growing preference towards outdoor recreational activities is anticipated to propel the demand for portable and reusable cooler boxes.

Country CAGR (2025 to 2035)
UK 6.3%

European Union

Its foam cooler box market in Europe is strongly impacted by rigorous sustainability regulations such as bans on single-use plastics and non-recyclable foam packaging. Therein lies another edge of the market, towards low-impact insulation material, bio-based foams and recyclable polymers. The regional pharmaceutical sector, with investments increasing in vaccine cold chain logistics,is propelling demand for sophisticated thermal packaging solutions.

Some grocery & meal delivery services are already introducing eco-friendly insulation options through major retailers & food service companies. The future of market space will be driven by investments in smart cooling technology and IoT based temperature monitoring.

Country CAGR (2025 to 2035)
EU 6.4%

Japan

Growing demand for cold-chain logistics, medical supply transport and high-tech food packaging solutions is driving Japan's foam cooler box market. Due to a good frozen and chilled food distribution network in the country, the show announces lightweight and highly-insulated packaging.

Japan’s drive for smart packaging innovations is also spurring the adoption of IoT-enabled temperature tracking systems in cooler boxes. Increased investment in bio-based and recyclable insulation materials as the government looks to reduce plastic waste.

Country CAGR (2025 to 2035)
Japan 6.4%

South Korea

The growth of online grocery delivery, pharmaceutical logistics, and eco-friendly packaging initiatives are contributing to the increasingly dominant foam cooler box market in South Korea. The country’s robust e-commerce sector, particularly in the fresh food delivery space, is driving demand for insulation solutions that are both durable and cost-effective.

The government’s own aggressive sustainability policies are prompting businesses to invest in biodegradable and reusable cooler boxes. Tech developments around thermal efficiency and AI-powered logistics monitoring are another part of the new dynamic shaping the market. Consumers increasingly are choosing personal size, reusable coolers in a sign of a shift to more sustainable consumer behaviour.

Country CAGR (2025 to 2035)
South Korea 6.5%

Competitive Outlook

In the food, pharmaceuticals, and logistics industries, the foam cooler box market is driven by a growing need for temperature-sensitive packaging solutions. Growing implementation of sustainable and bio-based substitutes, along with ongoing developments in AI-enabled thermal insulating materials technology, will affect the market.

Leading industry players are focused on high-performance insulation materials sustainable packaging innovations and AI-optimized cold chain logistics. Leading segmental participants are packaging manufacturers, cold chain logistics firms, and specialty insulation providers implementing innovative foam cooler box solutions that possess light weighting, durability, and thermal efficiency.
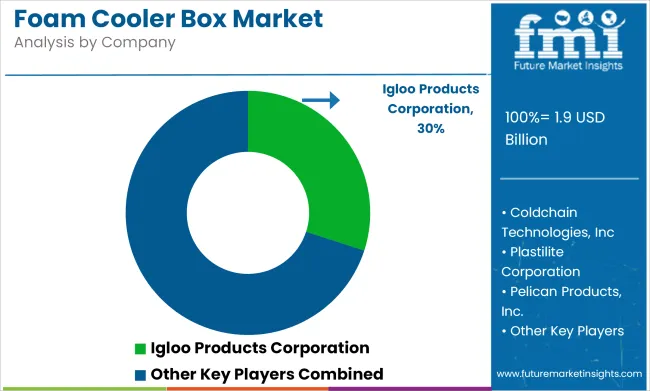
Key Market Insights

Foam Cooler Box Market Analysis By Company

Sonoco ThermoSafe (18-22%)

Sonoco ThermoSafe leads in AI-powered thermal packaging innovations, offering high-performance insulated containers for pharmaceutical cold chain logistics.

Cold Chain Technologies (14-18%)

Cold Chain Technologies specializes in sustainable and AI-driven cold chain packaging, developing reusable and biodegradable foam cooler boxes for global supply chains.

Plastilite Corporation (10-14%)

Plastilite focuses on lightweight and cost-effective foam cooler solutions, optimizing insulation technology for perishable food and beverage transportation.

Cryopak (Integreon Global) (8-12%)

Cryopak integrates AI-assisted temperature stability tracking and phase change material (PCM) technologies for precision thermal packaging in healthcare and logistics.

Lifoam Industries, LLC (6-10%)

Lifoam Industries emphasizes recyclable and biodegradable foam cooler solutions, integrating AI-powered predictive temperature control for outdoor and commercial use.

Other Key Players (30-40% Combined)

Several packaging manufacturers, insulation technology firms, and cold chain logistics providers contribute to next-generation foam cooler box innovations, AI-enhanced temperature regulation, and sustainable packaging solutions. Key contributors include:

  • ICEE Containers (Biodegradable and AI-optimized insulation solutions for medical and food shipping)
  • Therapak Corporation (Custom foam coolers for pharmaceuticals and perishable goods with AI-driven thermal analytics)
  • Intelsius (DGP Intelsius) (Precision cold chain packaging with sustainable thermal insulation technologies)
  • Tempack Packaging Solutions (Eco-friendly and reusable foam coolers for global logistics applications)
  • Snyder Industries, Inc. (Heavy-duty and industrial-grade foam coolers for bulk cold storage)

Key Segmentation

By Capacity:

  • Up to 25 Quart
  • 26-75 Quart
  • Above 150 Quart

By Carrying Method:

  • Side Handles
  • Lid Handles
  • Shoulder Strap

By Material type:

  • Expanded Polystyrene
  • Expanded Polypropylene

By End-use Industry:

  • Food & Beverages
  • Pharmaceutical
  • Cosmetics & Personal Care

By Region:

  • North America
  • Latin America
  • Western Europe
  • Eastern Europe
  • East Asia
  • South Asia Pacific
  • Middle East and Africa

Table of Content

  1. Executive Summary
  2. Industry Introduction, including Taxonomy and Market Definition
  3. Market Trends and Success Factors, including Macro-economic Factors, Market Dynamics, and Recent Industry Developments
  4. Global Market Demand Analysis 2020 to 2024 and Forecast 2025 to 2035, including Historical Analysis and Future Projections
  5. Pricing Analysis
  6. Global Market Analysis 2020 to 2024 and Forecast 2025 to 2035
    • Capacity
    • Carrying Method
    • Material type
    • End-use Industry
  7. Global Market Analysis 2020 to 2024 and Forecast 2025 to 2035, By Capacity
    • Up to 25 Quart
    • 26-75 Quart
    • Above 150 Quart
  8. Global Market Analysis 2020 to 2024 and Forecast 2025 to 2035, By Carrying Method
    • Side Handles
    • Lid Handles
    • Shoulder Strap
  9. Global Market Analysis 2020 to 2024 and Forecast 2025 to 2035, By Material type
    • Expanded Polystyrene
    • Expanded Polypropylene
  10. Global Market Analysis 2020 to 2024 and Forecast 2025 to 2035, By End-use Industry
    • Food & Beverages
    • Pharmaceutical
    • Cosmetics & Personal Care
  11. Global Market Analysis 2020 to 2024 and Forecast 2025 to 2035, By Region
    • North America
    • Latin America
    • Western Europe
    • Eastern Europe
    • East Asia
    • South Asia Pacific
    • Middle East and Africa
  12. North America Sales Analysis 2020 to 2024 and Forecast 2025 to 2035, by Key Segments and Countries
  13. Latin America Sales Analysis 2020 to 2024 and Forecast 2025 to 2035, by Key Segments and Countries
  14. Western Europe Sales Analysis 2020 to 2024 and Forecast 2025 to 2035, by Key Segments and Countries
  15. Eastern Europe Sales Analysis 2020 to 2024 and Forecast 2025 to 2035, by Key Segments and Countries
  16. East Asia Sales Analysis 2020 to 2024 and Forecast 2025 to 2035, by Key Segments and Countries
  17. South Asia Pacific Sales Analysis 2020 to 2024 and Forecast 2025 to 2035, by Key Segments and Countries
  18. Middle East and Africa Sales Analysis 2020 to 2024 and Forecast 2025 to 2035, by Key Segments and Countries
  19. Sales Forecast 2025 to 2035 by Capacity, Carrying Method, Material type, and End-use Industry for 30 Countries
  20. Competition Outlook, including Market Structure Analysis, Company Share Analysis by Key Players, and Competition Dashboard
  21. Company Profile
    • Igloo Products Corporation
    • Cool Ice Box Co Ltd
    • Coldchain Technologies, Inc
    • Plastilite Corporation
    • Pelican Products, Inc.
    • MacNeill Pride Group (ORCA)
    • Bison Coolers
    • RTIC Outdoors LLC
    • Koolatron USA
    • Aohong Industry Co., Ltd.

List of Tables

  • Table 1: Global Market Value (US$ Million) Forecast by Region, 2020 to 2035
  • Table 2: Global Market Volume (Units) Forecast by Region, 2020 to 2035
  • Table 3: Global Market Value (US$ Million) Forecast by Capacity, 2020 to 2035
  • Table 4: Global Market Volume (Units) Forecast by Capacity, 2020 to 2035
  • Table 5: Global Market Value (US$ Million) Forecast by Carrying Method, 2020 to 2035
  • Table 6: Global Market Volume (Units) Forecast by Carrying Method, 2020 to 2035
  • Table 7: Global Market Value (US$ Million) Forecast by Material, 2020 to 2035
  • Table 8: Global Market Volume (Units) Forecast by Material, 2020 to 2035
  • Table 9: Global Market Value (US$ Million) Forecast by End Use Industry, 2020 to 2035
  • Table 10: Global Market Volume (Units) Forecast by End Use Industry, 2020 to 2035
  • Table 11: North America Market Value (US$ Million) Forecast by Country, 2020 to 2035
  • Table 12: North America Market Volume (Units) Forecast by Country, 2020 to 2035
  • Table 13: North America Market Value (US$ Million) Forecast by Capacity, 2020 to 2035
  • Table 14: North America Market Volume (Units) Forecast by Capacity, 2020 to 2035
  • Table 15: North America Market Value (US$ Million) Forecast by Carrying Method, 2020 to 2035
  • Table 16: North America Market Volume (Units) Forecast by Carrying Method, 2020 to 2035
  • Table 17: North America Market Value (US$ Million) Forecast by Material, 2020 to 2035
  • Table 18: North America Market Volume (Units) Forecast by Material, 2020 to 2035
  • Table 19: North America Market Value (US$ Million) Forecast by End Use Industry, 2020 to 2035
  • Table 20: North America Market Volume (Units) Forecast by End Use Industry, 2020 to 2035
  • Table 21: Latin America Market Value (US$ Million) Forecast by Country, 2020 to 2035
  • Table 22: Latin America Market Volume (Units) Forecast by Country, 2020 to 2035
  • Table 23: Latin America Market Value (US$ Million) Forecast by Capacity, 2020 to 2035
  • Table 24: Latin America Market Volume (Units) Forecast by Capacity, 2020 to 2035
  • Table 25: Latin America Market Value (US$ Million) Forecast by Carrying Method, 2020 to 2035
  • Table 26: Latin America Market Volume (Units) Forecast by Carrying Method, 2020 to 2035
  • Table 27: Latin America Market Value (US$ Million) Forecast by Material, 2020 to 2035
  • Table 28: Latin America Market Volume (Units) Forecast by Material, 2020 to 2035
  • Table 29: Latin America Market Value (US$ Million) Forecast by End Use Industry, 2020 to 2035
  • Table 30: Latin America Market Volume (Units) Forecast by End Use Industry, 2020 to 2035
  • Table 31: Europe Market Value (US$ Million) Forecast by Country, 2020 to 2035
  • Table 32: Europe Market Volume (Units) Forecast by Country, 2020 to 2035
  • Table 33: Europe Market Value (US$ Million) Forecast by Capacity, 2020 to 2035
  • Table 34: Europe Market Volume (Units) Forecast by Capacity, 2020 to 2035
  • Table 35: Europe Market Value (US$ Million) Forecast by Carrying Method, 2020 to 2035
  • Table 36: Europe Market Volume (Units) Forecast by Carrying Method, 2020 to 2035
  • Table 37: Europe Market Value (US$ Million) Forecast by Material, 2020 to 2035
  • Table 38: Europe Market Volume (Units) Forecast by Material, 2020 to 2035
  • Table 39: Europe Market Value (US$ Million) Forecast by End Use Industry, 2020 to 2035
  • Table 40: Europe Market Volume (Units) Forecast by End Use Industry, 2020 to 2035
  • Table 41: Asia Pacific Market Value (US$ Million) Forecast by Country, 2020 to 2035
  • Table 42: Asia Pacific Market Volume (Units) Forecast by Country, 2020 to 2035
  • Table 43: Asia Pacific Market Value (US$ Million) Forecast by Capacity, 2020 to 2035
  • Table 44: Asia Pacific Market Volume (Units) Forecast by Capacity, 2020 to 2035
  • Table 45: Asia Pacific Market Value (US$ Million) Forecast by Carrying Method, 2020 to 2035
  • Table 46: Asia Pacific Market Volume (Units) Forecast by Carrying Method, 2020 to 2035
  • Table 47: Asia Pacific Market Value (US$ Million) Forecast by Material, 2020 to 2035
  • Table 48: Asia Pacific Market Volume (Units) Forecast by Material, 2020 to 2035
  • Table 49: Asia Pacific Market Value (US$ Million) Forecast by End Use Industry, 2020 to 2035
  • Table 50: Asia Pacific Market Volume (Units) Forecast by End Use Industry, 2020 to 2035
  • Table 51: MEA Market Value (US$ Million) Forecast by Country, 2020 to 2035
  • Table 52: MEA Market Volume (Units) Forecast by Country, 2020 to 2035
  • Table 53: MEA Market Value (US$ Million) Forecast by Capacity, 2020 to 2035
  • Table 54: MEA Market Volume (Units) Forecast by Capacity, 2020 to 2035
  • Table 55: MEA Market Value (US$ Million) Forecast by Carrying Method, 2020 to 2035
  • Table 56: MEA Market Volume (Units) Forecast by Carrying Method, 2020 to 2035
  • Table 57: MEA Market Value (US$ Million) Forecast by Material, 2020 to 2035
  • Table 58: MEA Market Volume (Units) Forecast by Material, 2020 to 2035
  • Table 59: MEA Market Value (US$ Million) Forecast by End Use Industry, 2020 to 2035
  • Table 60: MEA Market Volume (Units) Forecast by End Use Industry, 2020 to 2035

List of Figures

  • Figure 1: Global Market Value (US$ Million) by Capacity, 2025 to 2035
  • Figure 2: Global Market Value (US$ Million) by Carrying Method, 2025 to 2035
  • Figure 3: Global Market Value (US$ Million) by Material, 2025 to 2035
  • Figure 4: Global Market Value (US$ Million) by End Use Industry, 2025 to 2035
  • Figure 5: Global Market Value (US$ Million) by Region, 2025 to 2035
  • Figure 6: Global Market Value (US$ Million) Analysis by Region, 2020 to 2035
  • Figure 7: Global Market Volume (Units) Analysis by Region, 2020 to 2035
  • Figure 8: Global Market Value Share (%) and BPS Analysis by Region, 2025 to 2035
  • Figure 9: Global Market Y-o-Y Growth (%) Projections by Region, 2025 to 2035
  • Figure 10: Global Market Value (US$ Million) Analysis by Capacity, 2020 to 2035
  • Figure 11: Global Market Volume (Units) Analysis by Capacity, 2020 to 2035
  • Figure 12: Global Market Value Share (%) and BPS Analysis by Capacity, 2025 to 2035
  • Figure 13: Global Market Y-o-Y Growth (%) Projections by Capacity, 2025 to 2035
  • Figure 14: Global Market Value (US$ Million) Analysis by Carrying Method, 2020 to 2035
  • Figure 15: Global Market Volume (Units) Analysis by Carrying Method, 2020 to 2035
  • Figure 16: Global Market Value Share (%) and BPS Analysis by Carrying Method, 2025 to 2035
  • Figure 17: Global Market Y-o-Y Growth (%) Projections by Carrying Method, 2025 to 2035
  • Figure 18: Global Market Value (US$ Million) Analysis by Material, 2020 to 2035
  • Figure 19: Global Market Volume (Units) Analysis by Material, 2020 to 2035
  • Figure 20: Global Market Value Share (%) and BPS Analysis by Material, 2025 to 2035
  • Figure 21: Global Market Y-o-Y Growth (%) Projections by Material, 2025 to 2035
  • Figure 22: Global Market Value (US$ Million) Analysis by End Use Industry, 2020 to 2035
  • Figure 23: Global Market Volume (Units) Analysis by End Use Industry, 2020 to 2035
  • Figure 24: Global Market Value Share (%) and BPS Analysis by End Use Industry, 2025 to 2035
  • Figure 25: Global Market Y-o-Y Growth (%) Projections by End Use Industry, 2025 to 2035
  • Figure 26: Global Market Attractiveness by Capacity, 2025 to 2035
  • Figure 27: Global Market Attractiveness by Carrying Method, 2025 to 2035
  • Figure 28: Global Market Attractiveness by Material, 2025 to 2035
  • Figure 29: Global Market Attractiveness by End Use Industry, 2025 to 2035
  • Figure 30: Global Market Attractiveness by Region, 2025 to 2035
  • Figure 31: North America Market Value (US$ Million) by Capacity, 2025 to 2035
  • Figure 32: North America Market Value (US$ Million) by Carrying Method, 2025 to 2035
  • Figure 33: North America Market Value (US$ Million) by Material, 2025 to 2035
  • Figure 34: North America Market Value (US$ Million) by End Use Industry, 2025 to 2035
  • Figure 35: North America Market Value (US$ Million) by Country, 2025 to 2035
  • Figure 36: North America Market Value (US$ Million) Analysis by Country, 2020 to 2035
  • Figure 37: North America Market Volume (Units) Analysis by Country, 2020 to 2035
  • Figure 38: North America Market Value Share (%) and BPS Analysis by Country, 2025 to 2035
  • Figure 39: North America Market Y-o-Y Growth (%) Projections by Country, 2025 to 2035
  • Figure 40: North America Market Value (US$ Million) Analysis by Capacity, 2020 to 2035
  • Figure 41: North America Market Volume (Units) Analysis by Capacity, 2020 to 2035
  • Figure 42: North America Market Value Share (%) and BPS Analysis by Capacity, 2025 to 2035
  • Figure 43: North America Market Y-o-Y Growth (%) Projections by Capacity, 2025 to 2035
  • Figure 44: North America Market Value (US$ Million) Analysis by Carrying Method, 2020 to 2035
  • Figure 45: North America Market Volume (Units) Analysis by Carrying Method, 2020 to 2035
  • Figure 46: North America Market Value Share (%) and BPS Analysis by Carrying Method, 2025 to 2035
  • Figure 47: North America Market Y-o-Y Growth (%) Projections by Carrying Method, 2025 to 2035
  • Figure 48: North America Market Value (US$ Million) Analysis by Material, 2020 to 2035
  • Figure 49: North America Market Volume (Units) Analysis by Material, 2020 to 2035
  • Figure 50: North America Market Value Share (%) and BPS Analysis by Material, 2025 to 2035
  • Figure 51: North America Market Y-o-Y Growth (%) Projections by Material, 2025 to 2035
  • Figure 52: North America Market Value (US$ Million) Analysis by End Use Industry, 2020 to 2035
  • Figure 53: North America Market Volume (Units) Analysis by End Use Industry, 2020 to 2035
  • Figure 54: North America Market Value Share (%) and BPS Analysis by End Use Industry, 2025 to 2035
  • Figure 55: North America Market Y-o-Y Growth (%) Projections by End Use Industry, 2025 to 2035
  • Figure 56: North America Market Attractiveness by Capacity, 2025 to 2035
  • Figure 57: North America Market Attractiveness by Carrying Method, 2025 to 2035
  • Figure 58: North America Market Attractiveness by Material, 2025 to 2035
  • Figure 59: North America Market Attractiveness by End Use Industry, 2025 to 2035
  • Figure 60: North America Market Attractiveness by Country, 2025 to 2035
  • Figure 61: Latin America Market Value (US$ Million) by Capacity, 2025 to 2035
  • Figure 62: Latin America Market Value (US$ Million) by Carrying Method, 2025 to 2035
  • Figure 63: Latin America Market Value (US$ Million) by Material, 2025 to 2035
  • Figure 64: Latin America Market Value (US$ Million) by End Use Industry, 2025 to 2035
  • Figure 65: Latin America Market Value (US$ Million) by Country, 2025 to 2035
  • Figure 66: Latin America Market Value (US$ Million) Analysis by Country, 2020 to 2035
  • Figure 67: Latin America Market Volume (Units) Analysis by Country, 2020 to 2035
  • Figure 68: Latin America Market Value Share (%) and BPS Analysis by Country, 2025 to 2035
  • Figure 69: Latin America Market Y-o-Y Growth (%) Projections by Country, 2025 to 2035
  • Figure 70: Latin America Market Value (US$ Million) Analysis by Capacity, 2020 to 2035
  • Figure 71: Latin America Market Volume (Units) Analysis by Capacity, 2020 to 2035
  • Figure 72: Latin America Market Value Share (%) and BPS Analysis by Capacity, 2025 to 2035
  • Figure 73: Latin America Market Y-o-Y Growth (%) Projections by Capacity, 2025 to 2035
  • Figure 74: Latin America Market Value (US$ Million) Analysis by Carrying Method, 2020 to 2035
  • Figure 75: Latin America Market Volume (Units) Analysis by Carrying Method, 2020 to 2035
  • Figure 76: Latin America Market Value Share (%) and BPS Analysis by Carrying Method, 2025 to 2035
  • Figure 77: Latin America Market Y-o-Y Growth (%) Projections by Carrying Method, 2025 to 2035
  • Figure 78: Latin America Market Value (US$ Million) Analysis by Material, 2020 to 2035
  • Figure 79: Latin America Market Volume (Units) Analysis by Material, 2020 to 2035
  • Figure 80: Latin America Market Value Share (%) and BPS Analysis by Material, 2025 to 2035
  • Figure 81: Latin America Market Y-o-Y Growth (%) Projections by Material, 2025 to 2035
  • Figure 82: Latin America Market Value (US$ Million) Analysis by End Use Industry, 2020 to 2035
  • Figure 83: Latin America Market Volume (Units) Analysis by End Use Industry, 2020 to 2035
  • Figure 84: Latin America Market Value Share (%) and BPS Analysis by End Use Industry, 2025 to 2035
  • Figure 85: Latin America Market Y-o-Y Growth (%) Projections by End Use Industry, 2025 to 2035
  • Figure 86: Latin America Market Attractiveness by Capacity, 2025 to 2035
  • Figure 87: Latin America Market Attractiveness by Carrying Method, 2025 to 2035
  • Figure 88: Latin America Market Attractiveness by Material, 2025 to 2035
  • Figure 89: Latin America Market Attractiveness by End Use Industry, 2025 to 2035
  • Figure 90: Latin America Market Attractiveness by Country, 2025 to 2035
  • Figure 91: Europe Market Value (US$ Million) by Capacity, 2025 to 2035
  • Figure 92: Europe Market Value (US$ Million) by Carrying Method, 2025 to 2035
  • Figure 93: Europe Market Value (US$ Million) by Material, 2025 to 2035
  • Figure 94: Europe Market Value (US$ Million) by End Use Industry, 2025 to 2035
  • Figure 95: Europe Market Value (US$ Million) by Country, 2025 to 2035
  • Figure 96: Europe Market Value (US$ Million) Analysis by Country, 2020 to 2035
  • Figure 97: Europe Market Volume (Units) Analysis by Country, 2020 to 2035
  • Figure 98: Europe Market Value Share (%) and BPS Analysis by Country, 2025 to 2035
  • Figure 99: Europe Market Y-o-Y Growth (%) Projections by Country, 2025 to 2035
  • Figure 100: Europe Market Value (US$ Million) Analysis by Capacity, 2020 to 2035
  • Figure 101: Europe Market Volume (Units) Analysis by Capacity, 2020 to 2035
  • Figure 102: Europe Market Value Share (%) and BPS Analysis by Capacity, 2025 to 2035
  • Figure 103: Europe Market Y-o-Y Growth (%) Projections by Capacity, 2025 to 2035
  • Figure 104: Europe Market Value (US$ Million) Analysis by Carrying Method, 2020 to 2035
  • Figure 105: Europe Market Volume (Units) Analysis by Carrying Method, 2020 to 2035
  • Figure 106: Europe Market Value Share (%) and BPS Analysis by Carrying Method, 2025 to 2035
  • Figure 107: Europe Market Y-o-Y Growth (%) Projections by Carrying Method, 2025 to 2035
  • Figure 108: Europe Market Value (US$ Million) Analysis by Material, 2020 to 2035
  • Figure 109: Europe Market Volume (Units) Analysis by Material, 2020 to 2035
  • Figure 110: Europe Market Value Share (%) and BPS Analysis by Material, 2025 to 2035
  • Figure 111: Europe Market Y-o-Y Growth (%) Projections by Material, 2025 to 2035
  • Figure 112: Europe Market Value (US$ Million) Analysis by End Use Industry, 2020 to 2035
  • Figure 113: Europe Market Volume (Units) Analysis by End Use Industry, 2020 to 2035
  • Figure 114: Europe Market Value Share (%) and BPS Analysis by End Use Industry, 2025 to 2035
  • Figure 115: Europe Market Y-o-Y Growth (%) Projections by End Use Industry, 2025 to 2035
  • Figure 116: Europe Market Attractiveness by Capacity, 2025 to 2035
  • Figure 117: Europe Market Attractiveness by Carrying Method, 2025 to 2035
  • Figure 118: Europe Market Attractiveness by Material, 2025 to 2035
  • Figure 119: Europe Market Attractiveness by End Use Industry, 2025 to 2035
  • Figure 120: Europe Market Attractiveness by Country, 2025 to 2035
  • Figure 121: Asia Pacific Market Value (US$ Million) by Capacity, 2025 to 2035
  • Figure 122: Asia Pacific Market Value (US$ Million) by Carrying Method, 2025 to 2035
  • Figure 123: Asia Pacific Market Value (US$ Million) by Material, 2025 to 2035
  • Figure 124: Asia Pacific Market Value (US$ Million) by End Use Industry, 2025 to 2035
  • Figure 125: Asia Pacific Market Value (US$ Million) by Country, 2025 to 2035
  • Figure 126: Asia Pacific Market Value (US$ Million) Analysis by Country, 2020 to 2035
  • Figure 127: Asia Pacific Market Volume (Units) Analysis by Country, 2020 to 2035
  • Figure 128: Asia Pacific Market Value Share (%) and BPS Analysis by Country, 2025 to 2035
  • Figure 129: Asia Pacific Market Y-o-Y Growth (%) Projections by Country, 2025 to 2035
  • Figure 130: Asia Pacific Market Value (US$ Million) Analysis by Capacity, 2020 to 2035
  • Figure 131: Asia Pacific Market Volume (Units) Analysis by Capacity, 2020 to 2035
  • Figure 132: Asia Pacific Market Value Share (%) and BPS Analysis by Capacity, 2025 to 2035
  • Figure 133: Asia Pacific Market Y-o-Y Growth (%) Projections by Capacity, 2025 to 2035
  • Figure 134: Asia Pacific Market Value (US$ Million) Analysis by Carrying Method, 2020 to 2035
  • Figure 135: Asia Pacific Market Volume (Units) Analysis by Carrying Method, 2020 to 2035
  • Figure 136: Asia Pacific Market Value Share (%) and BPS Analysis by Carrying Method, 2025 to 2035
  • Figure 137: Asia Pacific Market Y-o-Y Growth (%) Projections by Carrying Method, 2025 to 2035
  • Figure 138: Asia Pacific Market Value (US$ Million) Analysis by Material, 2020 to 2035
  • Figure 139: Asia Pacific Market Volume (Units) Analysis by Material, 2020 to 2035
  • Figure 140: Asia Pacific Market Value Share (%) and BPS Analysis by Material, 2025 to 2035
  • Figure 141: Asia Pacific Market Y-o-Y Growth (%) Projections by Material, 2025 to 2035
  • Figure 142: Asia Pacific Market Value (US$ Million) Analysis by End Use Industry, 2020 to 2035
  • Figure 143: Asia Pacific Market Volume (Units) Analysis by End Use Industry, 2020 to 2035
  • Figure 144: Asia Pacific Market Value Share (%) and BPS Analysis by End Use Industry, 2025 to 2035
  • Figure 145: Asia Pacific Market Y-o-Y Growth (%) Projections by End Use Industry, 2025 to 2035
  • Figure 146: Asia Pacific Market Attractiveness by Capacity, 2025 to 2035
  • Figure 147: Asia Pacific Market Attractiveness by Carrying Method, 2025 to 2035
  • Figure 148: Asia Pacific Market Attractiveness by Material, 2025 to 2035
  • Figure 149: Asia Pacific Market Attractiveness by End Use Industry, 2025 to 2035
  • Figure 150: Asia Pacific Market Attractiveness by Country, 2025 to 2035
  • Figure 151: MEA Market Value (US$ Million) by Capacity, 2025 to 2035
  • Figure 152: MEA Market Value (US$ Million) by Carrying Method, 2025 to 2035
  • Figure 153: MEA Market Value (US$ Million) by Material, 2025 to 2035
  • Figure 154: MEA Market Value (US$ Million) by End Use Industry, 2025 to 2035
  • Figure 155: MEA Market Value (US$ Million) by Country, 2025 to 2035
  • Figure 156: MEA Market Value (US$ Million) Analysis by Country, 2020 to 2035
  • Figure 157: MEA Market Volume (Units) Analysis by Country, 2020 to 2035
  • Figure 158: MEA Market Value Share (%) and BPS Analysis by Country, 2025 to 2035
  • Figure 159: MEA Market Y-o-Y Growth (%) Projections by Country, 2025 to 2035
  • Figure 160: MEA Market Value (US$ Million) Analysis by Capacity, 2020 to 2035
  • Figure 161: MEA Market Volume (Units) Analysis by Capacity, 2020 to 2035
  • Figure 162: MEA Market Value Share (%) and BPS Analysis by Capacity, 2025 to 2035
  • Figure 163: MEA Market Y-o-Y Growth (%) Projections by Capacity, 2025 to 2035
  • Figure 164: MEA Market Value (US$ Million) Analysis by Carrying Method, 2020 to 2035
  • Figure 165: MEA Market Volume (Units) Analysis by Carrying Method, 2020 to 2035
  • Figure 166: MEA Market Value Share (%) and BPS Analysis by Carrying Method, 2025 to 2035
  • Figure 167: MEA Market Y-o-Y Growth (%) Projections by Carrying Method, 2025 to 2035
  • Figure 168: MEA Market Value (US$ Million) Analysis by Material, 2020 to 2035
  • Figure 169: MEA Market Volume (Units) Analysis by Material, 2020 to 2035
  • Figure 170: MEA Market Value Share (%) and BPS Analysis by Material, 2025 to 2035
  • Figure 171: MEA Market Y-o-Y Growth (%) Projections by Material, 2025 to 2035
  • Figure 172: MEA Market Value (US$ Million) Analysis by End Use Industry, 2020 to 2035
  • Figure 173: MEA Market Volume (Units) Analysis by End Use Industry, 2020 to 2035
  • Figure 174: MEA Market Value Share (%) and BPS Analysis by End Use Industry, 2025 to 2035
  • Figure 175: MEA Market Y-o-Y Growth (%) Projections by End Use Industry, 2025 to 2035
  • Figure 176: MEA Market Attractiveness by Capacity, 2025 to 2035
  • Figure 177: MEA Market Attractiveness by Carrying Method, 2025 to 2035
  • Figure 178: MEA Market Attractiveness by Material, 2025 to 2035
  • Figure 179: MEA Market Attractiveness by End Use Industry, 2025 to 2035
  • Figure 180: MEA Market Attractiveness by Country, 2025 to 2035

Frequently Asked Questions

What was the overall size of the foam cooler box market in 2025?

The overall market size for the foam cooler box market was USD 1.9 billion in 2025.

How big is the foam cooler box market expected to be in 2035?

The foam cooler box market is expected to reach USD 3.6 billion in 2035.

What will drive the demand for the foam cooler box market during the forecast period?

The demand for foam cooler boxes is expected to rise due to increasing use in food and beverage transportation, growing demand for temperature-sensitive pharmaceutical packaging, and expanding applications in outdoor recreational activities. Additionally, advancements in insulation materials, the rise of e-commerce food delivery services, and regulatory compliance for perishable goods transportation are further driving market growth.

List the top 5 countries contributing to the foam cooler box market.

The top 5 countries driving the development of the foam cooler box market are the USA, China, Germany, India, and Japan.

Which segment in the material type is expected to lead in the foam cooler box market?

Expanded Polystyrene (EPS) and Polyurethane (PU) Foam Cooler Boxes are expected to command a significant share over the assessment period, driven by their superior thermal insulation properties, lightweight design, and cost-effectiveness in cold chain logistics.

Explore Similar Insights

Future Market Insights

Foam Cooler Box Market