Foam Mesh Sleeves Market Size and Share Forecast Outlook 2025 to 2035

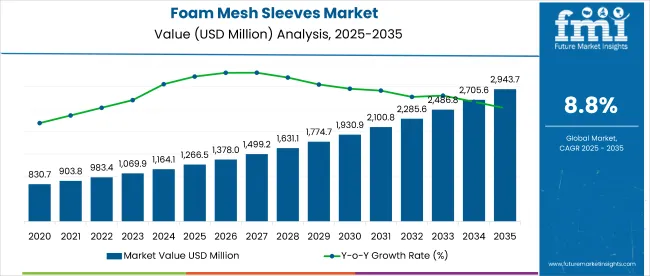
The global foam mesh sleeves market is projected to expand from USD 1,266.5 million 2025 to USD 2,943.7 million by 2035, advancing at a CAGR of 8.8% over the assessment period.
Quick-Stats For Foam Mesh Sleeves Market

  • Market Size 2025: USD 1,266.5 million
  • Market Size 2035: USD 2,943.7 million
  • CAGR (2025 to 2035): 8.8%
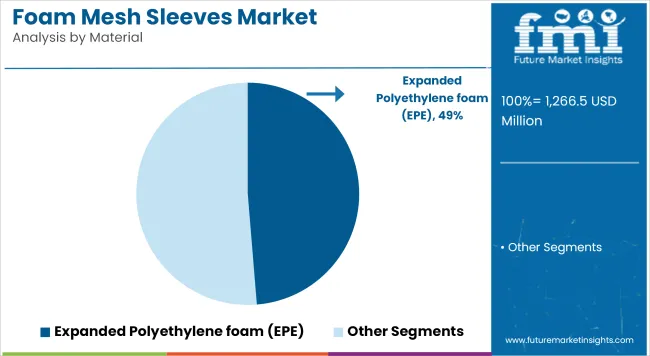
  • Largest Material Segment: Expanded Polyethylene Foam (49%)
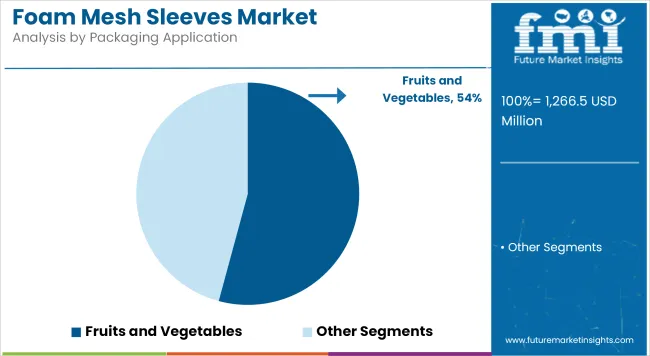
  • Leading Application: Fruits and Vegetables (54%)
  • Fastest-Growing Market: USA (9.0% CAGR)
  • EU CAGR: 9.0%
  • Japan CAGR: 8.8%

Foam Mesh Sleeves Market

In 2025, the foam mesh sleeves segment is expected to account for 5.2% of the global protective packaging market, which is valued at approximately USD 24.5 billion. Demand has been buoyed by increased handling of perishable produce across export supply chains and growing reliance on flexible packaging forms in retail logistics.

Demand for foam mesh sleeves is being driven by increasing fruit and vegetable exports, especially from Asia and Latin America to the EU and North America. Retailers and packers continue to prefer EPE-based mesh sleeves for their durability, cushioning performance, and lightweight design. Growth has also benefited from the proliferation of organized grocery and e-commerce channels in South and East Asia.

However, rising scrutiny of plastic-based packaging-especially polyethylene variants-has created regulatory pressure across the EU and Japan. Suppliers face material substitution risk, prompting a search for bio-based alternatives. Furthermore, price volatility of fossil-derived inputs such as ethylene and polypropylene remains a critical cost-side concern.

Opportunities lie in automation-compatible sleeve formats tailored for high-speed produce sorting lines. Vendors offering custom die-cut and UV-stabilized mesh sleeves have seen measurable gains in repeat orders. Meanwhile, the trend toward reduced SKU damage during transit is fostering partnerships between importers and region-specific sleeve manufacturers. These factors, combined, continue to pull the market toward specialized, performance-driven solutions.

Foam Mesh Sleeves Market by Top Investment Segments

The global foam mesh sleeves market has been analyzed across multiple segments, including Material (Expanded Polyethylene Foam (EPE); Polyethylene (PE) - Low-Density Polyethylene (LDPE), High-Density Polyethylene (HDPE); Polypropylene (PP)); and Packaging Application (Fruits and Vegetables; Glass Bottles and Containers; Electronics; Others).

Regional and country-level assessments cover North America, Latin America, Western Europe, Eastern Europe, East Asia, South Asia & Pacific, and Middle East & Africa, with deeper analysis by key nations such as the USA, Canada, Brazil, Mexico, Argentina, Germany, Italy, France, UK, Spain, China, Japan, South Korea, India, and Australia & New Zealand.
By Material - Expanded Polyethylene Foam (EPE) to Lead with 49% Market Share

Foam Mesh Sleeves Market Analysis By Material

In 2025, Expanded Polyethylene Foam (EPE) leads the material segment with a 49% market share-17 percentage points ahead of Polypropylene (PP). This edge stems from its superior cushioning-to-weight ratio, which makes it ideal for protecting delicate produce and containers in transit.

EPE demand has been sustained by its adaptability across fruit, glassware, and electronics packaging. However, regulatory friction in Europe and Japan over single-use plastics continues to prompt material reassessment by importers and converters.

The disruptor lies in the shift toward UV-resistant EPE variants. These are expected to drive a 15-18% increase in demand from tropical fruit exporters targeting long-haul shipping lanes, encouraging product upgrades among established vendors.
  • Higher yield strength ensures minimal tearing during bulk handling
  • Customizability for automated packaging lines improves throughput
  • Lightweight profile lowers overall freight costs in multi-leg exports

Foam Mesh Sleeves Market Analysis by Application

Foam Mesh Sleeves Market Analysis By Packaging Application

The Foam Mesh Sleeves market is predominantly driven by the fruits and vegetables segment, which accounts for 54% of the total market share, equivalent to approximately USD 683.3 million out of the total market size of USD 1,266.5 million.

This highlights the significant demand for foam mesh sleeves in protecting and packaging fresh produce, emphasizing their critical role in maintaining product quality and reducing damage during transportation and handling.

The remaining 46% of the market comprises other segments, indicating opportunities for growth and diversification in various packaging applications beyond fruits and vegetables.
Foam Mesh Sleeves Market Analysis by Country

Foam Mesh Sleeves Market Cagr Analysis By Country

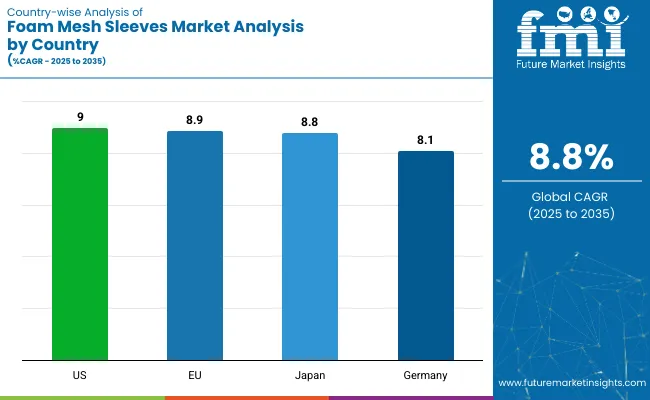
The global foam mesh sleeves market exhibits strong and varied growth across key countries, driven by region-specific demand dynamics and regulatory environments. The United States leads with a robust CAGR of 9.0%, fueled by expanding fresh produce exports, stringent FDA packaging guidelines, and growing adoption of automation in logistics.

The European Union matches this growth rate at 9.0%, driven by heavy intra- and extra-EU trade of perishable goods alongside increasing regulatory pressure to adopt recyclable and biodegradable packaging solutions. Countries within the EU such as Germany, France, and Italy are pivotal markets with rising demand for sustainable foam mesh sleeves, especially for organic and premium fruit segments.

Japan maintains steady growth at 8.8% CAGR, supported by a mature retail sector focused on quality packaging and growing interest in recyclable, thinner-profile foam materials that align with national plastic waste reduction policies. Across these regions, suppliers are innovating with UV-resistant and breathable mesh sleeves tailored to local export profiles and mechanized packing lines.

Collectively, these markets reflect a blend of regulatory-driven material shifts, evolving consumer preferences for freshness and minimal damage, and the rising importance of automation-compatible packaging solutions, setting a global growth benchmark for the foam mesh sleeves sector.

United States Foam Mesh Sleeves Market Analysis

The USA foam mesh sleeves market is forecast to grow at a CAGR of 9.0% between 2025 and 2035, reflecting strong demand driven by expanding fresh produce exports and increased packaging automation in logistics. Valued at approximately USD 330 million in 2025, the market benefits from regulatory encouragement for lightweight, recyclable packaging solutions that reduce waste while protecting perishables.

Stricter FDA and EPA regulations are pushing companies to optimize packaging sustainability, influencing material innovation, especially in polyethylene alternatives. Consumer preference for fresher, visually appealing fruits and vegetables has fueled the uptake of protective foam mesh sleeves that reduce bruising and spoilage.

  • Expansion of cold chain infrastructure
  • Growing e-commerce grocery sales and direct-to-consumer channels
  • Increased investment in sustainable packaging research

European Union Foam Mesh Sleeves Demand Analysis

The EU market is projected to grow at a 8.9% CAGR over the forecast period, supported by robust intra- and extra-EU fruit and vegetable trade flows. Valued near USD 280 million in 2025, the market faces challenges from stringent environmental regulations such as the EU Single-Use Plastics Directive.

Suppliers are increasingly investing in biodegradable and recyclable foam mesh alternatives to comply with evolving policies. The demand for premium-quality packaging that minimizes damage and enhances shelf appeal remains high across major member states such as Germany, France, and Italy.

  • EU regulations accelerating sustainable packaging adoption
  • Rising demand for organic and specialty produce packaging
  • Integration of smart packaging to monitor freshness

Japan Foam Mesh Sleeves Industry Analysis

Japan’s foam mesh sleeves market is set to expand at an 8.8% CAGR, reflecting steady growth driven by a mature retail sector and demand for premium packaging solutions in fruit exports and fragile electronics packaging. Valued around USD 160 million in 2025, the market benefits from consumer expectations for product quality and minimal damage.

High labor costs drive automation adoption in packaging, leading to demand for sleeve designs compatible with mechanized packing lines. Regulatory focus on plastic waste reduction is stimulating innovation in recyclable foam materials and reduced material thickness.
  • Preference for aesthetically appealing packaging in consumer goods
  • Increased use of UV-stabilized foam mesh in tropical fruit exports
  • Strong government push toward circular economy packaging

Foam Mesh Sleeves Market Players and their Strategies

Foam Mesh Sleeves Market Analysis By Company

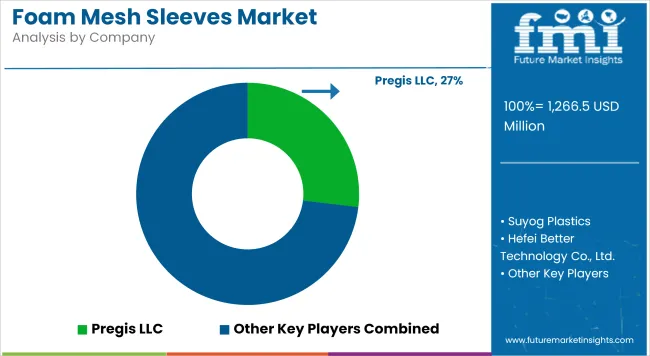
The foam mesh sleeves market is characterized by a mix of global leaders and regional specialists competing on product innovation, customization, and supply chain efficiency. Pregis LLC leads with a 27% market share, leveraging its broad product portfolio and extensive distribution network across North America and Europe. Other key players such as Suyog Plastics and Hefei Better Technology Co., Ltd. maintain strong footholds in Asian markets through cost-competitive manufacturing and tailored product offerings.

Competition has intensified around the development of sustainable and bio-based foam materials, driven by rising regulatory scrutiny on polyethylene and polypropylene products. Companies like Unipack Pte Ltd. and Paramount Packaging are investing in R&D to create recyclable, lightweight mesh sleeves that meet stricter environmental standards without compromising protective performance.

Regional players such as Laizhou Pengzhou Packing Products Co., Ltd. and Kamaksha Thermocol focus on niche applications, serving local agricultural exporters and e-commerce sectors with customized solutions. Meanwhile, Industrial Netting and Indonet Plastic Industries emphasize integrated supply chain services, offering value-added logistics and just-in-time delivery.

The market’s competitive dynamics favor agile manufacturers who can quickly innovate and align with evolving customer and regulatory demands. Smaller firms like Creative Protective Sdn Bhd are gaining traction through specialized product lines, particularly in emerging markets.

Key players

  • Pregis LLC
  • Suyog Plastics
  • Hefei Better Technology Co., Ltd.
  • Unipack Pte Ltd.
  • Paramount Packaging
  • Industrial Netting
  • Laizhou Pengzhou Packing Products Co., Ltd.
  • Kamaksha Thermocol
  • Indonet Plastic Industries
  • Creative Protective Sdn Bhd

Report Scope - Foam Mesh Sleeves Market

Attribute Details
Base Year 2024
Historical Period 2020 to 2024
Forecast Period 2025 to 2035
Market Value Unit USD Million
Segments Covered By Material (Expanded Polyethylene Foam (EPE), Polyethylene (LDPE, HDPE), Polypropylene (PP)); Packaging Application (Fruits and Vegetables, Glass Bottles and Containers, Electronics, Others)
Geographies Covered North America (USA, Canada, Mexico); Latin America (Brazil, Argentina, Rest of LATAM); Western Europe (Germany, Italy, France, UK, Spain, BENELUX, Nordic, Rest of W. Europe); Eastern Europe (Russia, Hungary, Poland, Balkan & Baltics, Rest of E. Europe); East Asia (China, Japan, South Korea); South Asia & Pacific (India, Australia & New Zealand, ASEAN, Rest of SAP); Middle East & Africa (GCC Countries, Northern Africa, South Africa, Turkiye, Rest of MEA)
Key Players Covered Pregis LLC, Suyog Plastics, Hefei Better Technology Co., Ltd., Unipack Pte Ltd., Paramount Packaging, Industrial Netting, Laizhou Pengzhou Packing Products Co., Ltd., Kamaksha Thermocol, Indonet Plastic Industries, Creative Protective Sdn Bhd
Research Methodology Secondary and primary research, market surveys, expert interviews, data triangulation

Foam Mesh Sleeves Market Segmentation

By Material:

  • Expanded Polyethylene foam (EPE)
  • Polyethylene (PE)
    • Low-Density Poly Ethylene (LDPE)
    • High-Density Poly Ethylene (HDPE)
  • Polypropylene (PP)

By Packaging Application:

  • Fruits and Vegetables
  • Glass bottles and containers
  • Electronics
  • Others

By Region:

  • North America
  • Latin America
  • Western Europe
  • Eastern Europe
  • East Asia
  • South Asia Pacific
  • Middle East and Africa

Table of Content

  1. Executive Summary
    • Global Market Outlook
    • Demand-side Trends
    • Supply-side Trends
    • Technology Roadmap Analysis
    • Analysis and Recommendations
  2. Market Overview
    • Market Coverage / Taxonomy
    • Market Definition / Scope / Limitations
  3. Market Background
    • Market Dynamics
      • Drivers
      • Restraints
      • Opportunity
      • Trends
    • Scenario Forecast
      • Demand in Optimistic Scenario
      • Demand in Likely Scenario
      • Demand in Conservative Scenario
    • Opportunity Map Analysis
    • Product Life Cycle Analysis
    • Supply Chain Analysis
      • Supply Side Participants and their Roles
        • Producers
        • Mid-Level Participants (Traders/ Agents/ Brokers)
        • Wholesalers and Distributors
      • Value Added and Value Created at Node in the Supply Chain
      • List of Raw Material Suppliers
      • List of Existing and Potential Buyer’s
    • Investment Feasibility Matrix
    • Value Chain Analysis
      • Profit Margin Analysis
      • Wholesalers and Distributors
      • Retailers
    • PESTLE and Porter’s Analysis
    • Regulatory Landscape
      • By Key Regions
      • By Key Countries
    • Regional Parent Market Outlook
    • Production and Consumption Statistics
    • Import and Export Statistics
  4. Global Market Analysis 2020 to 2024 and Forecast, 2025 to 2035
    • Historical Market Size Value (USD Million) & Volume (Metric Tons) Analysis, 2020 to 2024
    • Current and Future Market Size Value (USD Million) & Volume (Metric Tons) Projections, 2025 to 2035
      • Y-o-Y Growth Trend Analysis
      • Absolute $ Opportunity Analysis
  5. Global Market Pricing Analysis 2020 to 2024 and Forecast 2025 to 2035
  6. Global Market Analysis 2020 to 2024 and Forecast 2025 to 2035, By Material
    • Introduction / Key Findings
    • Historical Market Size Value (USD Million) & Volume (Metric Tons) Analysis By Material, 2020 to 2024
    • Current and Future Market Size Value (USD Million) & Volume (Metric Tons) Analysis and Forecast By Material, 2025 to 2035
      • Expanded Polyethylene Foam (EPE)
      • Polyethylene (PE)
        • Low-Density Polyethylene (LDPE)
        • High-Density Polyethylene (HDPE)
      • Polypropylene (PP)
    • Y-o-Y Growth Trend Analysis By Material, 2020 to 2024
    • Absolute $ Opportunity Analysis By Material, 2025 to 2035
  7. Global Market Analysis 2020 to 2024 and Forecast 2025 to 2035, By Packaging Application
    • Introduction / Key Findings
    • Historical Market Size Value (USD Million) & Volume (Metric Tons) Analysis By Packaging Application, 2020 to 2024
    • Current and Future Market Size Value (USD Million) & Volume (Metric Tons) Analysis and Forecast By Packaging Application, 2025 to 2035
      • Fruits and Vegetables
      • Glass Bottles and Containers
      • Electronics
      • Others
    • Y-o-Y Growth Trend Analysis By Packaging Application, 2020 to 2024
    • Absolute $ Opportunity Analysis By Packaging Application, 2025 to 2035
  8. Global Market Analysis 2020 to 2024 and Forecast 2025 to 2035, By Region
    • Introduction
    • Historical Market Size Value (USD Million) & Volume (Metric Tons) Analysis By Region, 2020 to 2024
    • Current Market Size Value (USD Million) & Volume (Metric Tons) Analysis and Forecast By Region, 2025 to 2035
      • North America
      • Latin America
      • Western Europe
      • Eastern Europe
      • East Asia
      • South Asia & Pacific
      • Middle East and Africa
    • Market Attractiveness Analysis By Region
  9. North America Market Analysis 2020 to 2024 and Forecast 2025 to 2035, By Country
    • Historical Market Size Value (USD Million) & Volume (Metric Tons) Trend Analysis By Market Taxonomy, 2020 to 2024
    • Market Size Value (USD Million) & Volume (Metric Tons) Forecast By Market Taxonomy, 2025 to 2035
      • By Country
        • USA
        • Canada
        • Mexico
      • By Material
      • By Packaging Application
    • Market Attractiveness Analysis
      • By Country
      • By Material
      • By Packaging Application
    • Key Takeaways
  10. Latin America Market Analysis 2020 to 2024 and Forecast 2025 to 2035, By Country
    • Historical Market Size Value (USD Million) & Volume (Metric Tons) Trend Analysis By Market Taxonomy, 2020 to 2024
    • Market Size Value (USD Million) & Volume (Metric Tons) Forecast By Market Taxonomy, 2025 to 2035
      • By Country
        • Brazil
        • Argentina
        • Rest of LATAM
      • By Material
      • By Packaging Application
    • Market Attractiveness Analysis
      • By Country
      • By Material
      • By Packaging Application
    • Key Takeaways
  11. Western Europe Market Analysis 2020 to 2024 and Forecast 2025 to 2035, By Country
    • Historical Market Size Value (USD Million) & Volume (Metric Tons) Trend Analysis By Market Taxonomy, 2020 to 2024
    • Market Size Value (USD Million) & Volume (Metric Tons) Forecast By Market Taxonomy, 2025 to 2035
      • By Country
        • Germany
        • Italy
        • France
        • UK
        • Spain
        • BENELUX
        • Nordic
        • Rest of W.Europe
      • By Material
      • By Packaging Application
    • Market Attractiveness Analysis
      • By Country
      • By Material
      • By Packaging Application
    • Key Takeaways
  12. Eastern Europe Market Analysis 2020 to 2024 and Forecast 2025 to 2035, By Country
    • Historical Market Size Value (USD Million) & Volume (Metric Tons) Trend Analysis By Market Taxonomy, 2020 to 2024
    • Market Size Value (USD Million) & Volume (Metric Tons) Forecast By Market Taxonomy, 2025 to 2035
      • By Country
        • Russia
        • Hungary
        • Poland
        • Balkan & Baltics
        • Rest of E. Europe
      • By Material
      • By Packaging Application
    • Market Attractiveness Analysis
      • By Country
      • By Material
      • By Packaging Application
    • Key Takeaways
  13. East Asia Market Analysis 2020 to 2024 and Forecast 2025 to 2035, By Country
    • Historical Market Size Value (USD Million) & Volume (Metric Tons) Trend Analysis By Market Taxonomy, 2020 to 2024
    • Market Size Value (USD Million) & Volume (Metric Tons) Forecast By Market Taxonomy, 2025 to 2035
      • By Country
        • China
        • Japan
        • South Korea
      • By Material
      • By Packaging Application
    • Market Attractiveness Analysis
      • By Country
      • By Material
      • By Packaging Application
    • Key Takeaways
  14. South Asia & Pacific Market Analysis 2020 to 2024 and Forecast 2025 to 2035, By Country
    • Historical Market Size Value (USD Million) & Volume (Metric Tons) Trend Analysis By Market Taxonomy, 2020 to 2024
    • Market Size Value (USD Million) & Volume (Metric Tons) Forecast By Market Taxonomy, 2025 to 2035
      • By Country
        • India
        • Australia & New Zealand
        • ASEAN
        • Rest of SAP
      • By Material
      • By Packaging Application
    • Market Attractiveness Analysis
      • By Country
      • By Material
      • By Packaging Application
    • Key Takeaways
  15. Middle East and Africa Market Analysis 2020 to 2024 and Forecast 2025 to 2035, By Country
    • Historical Market Size Value (USD Million) & Volume (Metric Tons) Trend Analysis By Market Taxonomy, 2020 to 2024
    • Market Size Value (USD Million) & Volume (Metric Tons) Forecast By Market Taxonomy, 2025 to 2035
      • By Country
        • GCC Countries
        • Northern Africa
        • South Africa
        • Turkiye
        • Rest of MEA
      • By Material
      • By Packaging Application
    • Market Attractiveness Analysis
      • By Country
      • By Material
      • By Packaging Application
    • Key Takeaways
  16. Key Countries Market Analysis
    • USA
      • Pricing Analysis
      • Market Share Analysis, 2024
        • By Material
        • By Packaging Application
    • Canada
      • Pricing Analysis
      • Market Share Analysis, 2024
        • By Material
        • By Packaging Application
    • Brazil
      • Pricing Analysis
      • Market Share Analysis, 2024
        • By Material
        • By Packaging Application
    • Mexico
      • Pricing Analysis
      • Market Share Analysis, 2024
        • By Material
        • By Packaging Application
    • Argentina
      • Pricing Analysis
      • Market Share Analysis, 2024
        • By Material
        • By Packaging Application
  17. Market Structure Analysis
    • Competition Dashboard
    • Competition Benchmarking
    • Market Share Analysis of Top Players
      • By Regional
      • By Material
      • By Packaging Application
  18. Competition Analysis
    • Competition Deep Dive
      • Pregis LLC
        • Overview
        • Product Portfolio
        • Profitability by Market Segments (Product/Age /Sales Channel/Region)
        • Sales Footprint
        • Strategy Overview
          • Marketing Strategy
          • Product Strategy
          • Channel Strategy
      • Suyog Plastics
        • Overview
        • Product Portfolio
        • Profitability by Market Segments (Product/Age /Sales Channel/Region)
        • Sales Footprint
        • Strategy Overview
          • Marketing Strategy
          • Product Strategy
          • Channel Strategy
      • Hefei Better Technology Co., Ltd.
        • Overview
        • Product Portfolio
        • Profitability by Market Segments (Product/Age /Sales Channel/Region)
        • Sales Footprint
        • Strategy Overview
          • Marketing Strategy
          • Product Strategy
          • Channel Strategy
      • Unipack Pte Ltd.
        • Overview
        • Product Portfolio
        • Profitability by Market Segments (Product/Age /Sales Channel/Region)
        • Sales Footprint
        • Strategy Overview
          • Marketing Strategy
          • Product Strategy
          • Channel Strategy
      • Paramount Packaging
        • Overview
        • Product Portfolio
        • Profitability by Market Segments (Product/Age /Sales Channel/Region)
        • Sales Footprint
        • Strategy Overview
          • Marketing Strategy
          • Product Strategy
          • Channel Strategy
      • Industrial Netting
        • Overview
        • Product Portfolio
        • Profitability by Market Segments (Product/Age /Sales Channel/Region)
        • Sales Footprint
        • Strategy Overview
          • Marketing Strategy
          • Product Strategy
          • Channel Strategy
      • Laizhou Pengzhou Packing Products Co., Ltd.
        • Overview
        • Product Portfolio
        • Profitability by Market Segments (Product/Age /Sales Channel/Region)
        • Sales Footprint
        • Strategy Overview
          • Marketing Strategy
          • Product Strategy
          • Channel Strategy
      • Kamaksha Thermocol
        • Overview
        • Product Portfolio
        • Profitability by Market Segments (Product/Age /Sales Channel/Region)
        • Sales Footprint
        • Strategy Overview
          • Marketing Strategy
          • Product Strategy
          • Channel Strategy
      • Indonet Plastic Industries
        • Overview
        • Product Portfolio
        • Profitability by Market Segments (Product/Age /Sales Channel/Region)
        • Sales Footprint
        • Strategy Overview
          • Marketing Strategy
          • Product Strategy
          • Channel Strategy
      • Creative Protective Sdn Bhd
        • Overview
        • Product Portfolio
        • Profitability by Market Segments (Product/Age /Sales Channel/Region)
        • Sales Footprint
        • Strategy Overview
          • Marketing Strategy
          • Product Strategy
          • Channel Strategy
  19. Assumptions & Acronyms Used
  20. Research Methodology

List of Tables

  • Table 1: Global Market Value (USD Million) Forecast by Region, 2020 to 2035
  • Table 2: Global Market Volume (Metric Tons) Forecast by Region, 2020 to 2035
  • Table 3: Global Market Value (USD Million) Forecast by Material, 2020 to 2035
  • Table 4: Global Market Volume (Metric Tons) Forecast by Material, 2020 to 2035
  • Table 5: Global Market Value (USD Million) Forecast by Packaging Application, 2020 to 2035
  • Table 6: Global Market Volume (Metric Tons) Forecast by Packaging Application, 2020 to 2035
  • Table 7: North America Market Value (USD Million) Forecast by Country, 2020 to 2035
  • Table 8: North America Market Volume (Metric Tons) Forecast by Country, 2020 to 2035
  • Table 9: North America Market Value (USD Million) Forecast by Material, 2020 to 2035
  • Table 10: North America Market Volume (Metric Tons) Forecast by Material, 2020 to 2035
  • Table 11: North America Market Value (USD Million) Forecast by Packaging Application, 2020 to 2035
  • Table 12: North America Market Volume (Metric Tons) Forecast by Packaging Application, 2020 to 2035
  • Table 13: Latin America Market Value (USD Million) Forecast by Country, 2020 to 2035
  • Table 14: Latin America Market Volume (Metric Tons) Forecast by Country, 2020 to 2035
  • Table 15: Latin America Market Value (USD Million) Forecast by Material, 2020 to 2035
  • Table 16: Latin America Market Volume (Metric Tons) Forecast by Material, 2020 to 2035
  • Table 17: Latin America Market Value (USD Million) Forecast by Packaging Application, 2020 to 2035
  • Table 18: Latin America Market Volume (Metric Tons) Forecast by Packaging Application, 2020 to 2035
  • Table 19: Western Europe Market Value (USD Million) Forecast by Country, 2020 to 2035
  • Table 20: Western Europe Market Volume (Metric Tons) Forecast by Country, 2020 to 2035
  • Table 21: Western Europe Market Value (USD Million) Forecast by Material, 2020 to 2035
  • Table 22: Western Europe Market Volume (Metric Tons) Forecast by Material, 2020 to 2035
  • Table 23: Western Europe Market Value (USD Million) Forecast by Packaging Application, 2020 to 2035
  • Table 24: Western Europe Market Volume (Metric Tons) Forecast by Packaging Application, 2020 to 2035
  • Table 25: Eastern Europe Market Value (USD Million) Forecast by Country, 2020 to 2035
  • Table 26: Eastern Europe Market Volume (Metric Tons) Forecast by Country, 2020 to 2035
  • Table 27: Eastern Europe Market Value (USD Million) Forecast by Material, 2020 to 2035
  • Table 28: Eastern Europe Market Volume (Metric Tons) Forecast by Material, 2020 to 2035
  • Table 29: Eastern Europe Market Value (USD Million) Forecast by Packaging Application, 2020 to 2035
  • Table 30: Eastern Europe Market Volume (Metric Tons) Forecast by Packaging Application, 2020 to 2035
  • Table 31: East Asia Market Value (USD Million) Forecast by Country, 2020 to 2035
  • Table 32: East Asia Market Volume (Metric Tons) Forecast by Country, 2020 to 2035
  • Table 33: East Asia Market Value (USD Million) Forecast by Material, 2020 to 2035
  • Table 34: East Asia Market Volume (Metric Tons) Forecast by Material, 2020 to 2035
  • Table 35: East Asia Market Value (USD Million) Forecast by Packaging Application, 2020 to 2035
  • Table 36: East Asia Market Volume (Metric Tons) Forecast by Packaging Application, 2020 to 2035
  • Table 37: South Asia & Pacific Market Value (USD Million) Forecast by Country, 2020 to 2035
  • Table 38: South Asia & Pacific Market Volume (Metric Tons) Forecast by Country, 2020 to 2035
  • Table 39: South Asia & Pacific Market Value (USD Million) Forecast by Material, 2020 to 2035
  • Table 40: South Asia & Pacific Market Volume (Metric Tons) Forecast by Material, 2020 to 2035
  • Table 41: South Asia & Pacific Market Value (USD Million) Forecast by Packaging Application, 2020 to 2035
  • Table 42: South Asia & Pacific Market Volume (Metric Tons) Forecast by Packaging Application, 2020 to 2035
  • Table 43: Middle East and Africa Market Value (USD Million) Forecast by Country, 2020 to 2035
  • Table 44: Middle East and Africa Market Volume (Metric Tons) Forecast by Country, 2020 to 2035
  • Table 45: Middle East and Africa Market Value (USD Million) Forecast by Material, 2020 to 2035
  • Table 46: Middle East and Africa Market Volume (Metric Tons) Forecast by Material, 2020 to 2035
  • Table 47: Middle East and Africa Market Value (USD Million) Forecast by Packaging Application, 2020 to 2035
  • Table 48: Middle East and Africa Market Volume (Metric Tons) Forecast by Packaging Application, 2020 to 2035

List of Figures

  • Figure 1: Global Market Volume (Metric Tons) Forecast 2020 to 2035
  • Figure 2: Global Market Pricing Analysis
  • Figure 3: Global Market Value (USD Million) Forecast 2020 to 2035
  • Figure 4: Global Market Value Share and BPS Analysis by Material, 2025 and 2035
  • Figure 5: Global Market Y-o-Y Growth Comparison by Material, 2025 to 2035
  • Figure 6: Global Market Attractiveness Analysis by Material
  • Figure 7: Global Market Value Share and BPS Analysis by Packaging Application, 2025 and 2035
  • Figure 8: Global Market Y-o-Y Growth Comparison by Packaging Application, 2025 to 2035
  • Figure 9: Global Market Attractiveness Analysis by Packaging Application
  • Figure 10: Global Market Value (USD Million) Share and BPS Analysis by Region, 2025 and 2035
  • Figure 11: Global Market Y-o-Y Growth Comparison by Region, 2025 to 2035
  • Figure 12: Global Market Attractiveness Analysis by Region
  • Figure 13: North America Market Incremental $ Opportunity, 2025 to 2035
  • Figure 14: Latin America Market Incremental $ Opportunity, 2025 to 2035
  • Figure 15: Western Europe Market Incremental $ Opportunity, 2025 to 2035
  • Figure 16: Eastern Europe Market Incremental $ Opportunity, 2025 to 2035
  • Figure 17: East Asia Market Incremental $ Opportunity, 2025 to 2035
  • Figure 18: South Asia & Pacific Market Incremental $ Opportunity, 2025 to 2035
  • Figure 19: Middle East and Africa Market Incremental $ Opportunity, 2025 to 2035
  • Figure 20: North America Market Value Share and BPS Analysis by Country, 2025 and 2035
  • Figure 21: North America Market Value Share and BPS Analysis by Material, 2025 and 2035
  • Figure 22: North America Market Y-o-Y Growth Comparison by Material, 2025 to 2035
  • Figure 23: North America Market Attractiveness Analysis by Material
  • Figure 24: North America Market Value Share and BPS Analysis by Packaging Application, 2025 and 2035
  • Figure 25: North America Market Y-o-Y Growth Comparison by Packaging Application, 2025 to 2035
  • Figure 26: North America Market Attractiveness Analysis by Packaging Application
  • Figure 27: Latin America Market Value Share and BPS Analysis by Country, 2025 and 2035
  • Figure 28: Latin America Market Value Share and BPS Analysis by Material, 2025 and 2035
  • Figure 29: Latin America Market Y-o-Y Growth Comparison by Material, 2025 to 2035
  • Figure 30: Latin America Market Attractiveness Analysis by Material
  • Figure 31: Latin America Market Value Share and BPS Analysis by Packaging Application, 2025 and 2035
  • Figure 32: Latin America Market Y-o-Y Growth Comparison by Packaging Application, 2025 to 2035
  • Figure 33: Latin America Market Attractiveness Analysis by Packaging Application
  • Figure 34: Western Europe Market Value Share and BPS Analysis by Country, 2025 and 2035
  • Figure 35: Western Europe Market Value Share and BPS Analysis by Material, 2025 and 2035
  • Figure 36: Western Europe Market Y-o-Y Growth Comparison by Material, 2025 to 2035
  • Figure 37: Western Europe Market Attractiveness Analysis by Material
  • Figure 38: Western Europe Market Value Share and BPS Analysis by Packaging Application, 2025 and 2035
  • Figure 39: Western Europe Market Y-o-Y Growth Comparison by Packaging Application, 2025 to 2035
  • Figure 40: Western Europe Market Attractiveness Analysis by Packaging Application
  • Figure 41: Eastern Europe Market Value Share and BPS Analysis by Country, 2025 and 2035
  • Figure 42: Eastern Europe Market Value Share and BPS Analysis by Material, 2025 and 2035
  • Figure 43: Eastern Europe Market Y-o-Y Growth Comparison by Material, 2025 to 2035
  • Figure 44: Eastern Europe Market Attractiveness Analysis by Material
  • Figure 45: Eastern Europe Market Value Share and BPS Analysis by Packaging Application, 2025 and 2035
  • Figure 46: Eastern Europe Market Y-o-Y Growth Comparison by Packaging Application, 2025 to 2035
  • Figure 47: Eastern Europe Market Attractiveness Analysis by Packaging Application
  • Figure 48: East Asia Market Value Share and BPS Analysis by Country, 2025 and 2035
  • Figure 49: East Asia Market Value Share and BPS Analysis by Material, 2025 and 2035
  • Figure 50: East Asia Market Y-o-Y Growth Comparison by Material, 2025 to 2035
  • Figure 51: East Asia Market Attractiveness Analysis by Material
  • Figure 52: East Asia Market Value Share and BPS Analysis by Packaging Application, 2025 and 2035
  • Figure 53: East Asia Market Y-o-Y Growth Comparison by Packaging Application, 2025 to 2035
  • Figure 54: East Asia Market Attractiveness Analysis by Packaging Application
  • Figure 55: South Asia & Pacific Market Value Share and BPS Analysis by Country, 2025 and 2035
  • Figure 56: South Asia & Pacific Market Value Share and BPS Analysis by Material, 2025 and 2035
  • Figure 57: South Asia & Pacific Market Y-o-Y Growth Comparison by Material, 2025 to 2035
  • Figure 58: South Asia & Pacific Market Attractiveness Analysis by Material
  • Figure 59: South Asia & Pacific Market Value Share and BPS Analysis by Packaging Application, 2025 and 2035
  • Figure 60: South Asia & Pacific Market Y-o-Y Growth Comparison by Packaging Application, 2025 to 2035
  • Figure 61: South Asia & Pacific Market Attractiveness Analysis by Packaging Application
  • Figure 62: Middle East and Africa Market Value Share and BPS Analysis by Country, 2025 and 2035
  • Figure 63: Middle East and Africa Market Value Share and BPS Analysis by Material, 2025 and 2035
  • Figure 64: Middle East and Africa Market Y-o-Y Growth Comparison by Material, 2025 to 2035
  • Figure 65: Middle East and Africa Market Attractiveness Analysis by Material
  • Figure 66: Middle East and Africa Market Value Share and BPS Analysis by Packaging Application, 2025 and 2035
  • Figure 67: Middle East and Africa Market Y-o-Y Growth Comparison by Packaging Application, 2025 to 2035
  • Figure 68: Middle East and Africa Market Attractiveness Analysis by Packaging Application
  • Figure 69: Global Market - Tier Structure Analysis
  • Figure 70: Global Market - Company Share Analysis

Frequently Asked Questions

What is the expected market size of the global foam mesh sleeves market by 2035?

The foam mesh sleeves market is projected to reach approximately USD 2,943.7 million by 2035, growing at a CAGR of 8.8% from 2025 to 2035.

Which material segment holds the largest share in the foam mesh sleeves market?

Expanded Polyethylene Foam (EPE) holds the largest share, accounting for 49% of the market in 2025.

What is the leading application for foam mesh sleeves?

The fruits and vegetables packaging application leads, comprising 54% of the market share in 2025.

Which region is expected to register the highest CAGR in foam mesh sleeves?

The United States is expected to lead with a CAGR of 9.0% from 2025 to 2035.

Who are the top companies operating in the foam mesh sleeves market?

Key players include Pregis LLC, Suyog Plastics, Hefei Better Technology Co., Ltd., Unipack Pte Ltd., and Paramount Packaging among others.

Explore Similar Insights

Future Market Insights

Foam Mesh Sleeves Market