The Foam Market is estimated to be valued at USD 115.1 billion in 2025 and is projected to reach USD 183.0 billion by 2035, registering a compound annual growth rate (CAGR) of 4.8% over the forecast period.
The foam market is exhibiting consistent expansion, driven by growing demand across construction, automotive, packaging, and furniture industries. Foams are increasingly valued for their superior insulation, cushioning, and energy absorption properties, which align with global sustainability and energy-efficiency trends. The market benefits from advancements in polymer chemistry and production techniques that enhance recyclability, structural integrity, and thermal resistance.
The construction sector’s continued focus on green building materials and improved energy conservation has further strengthened demand. Meanwhile, industrial and consumer applications are expanding due to foam’s lightweight and versatile nature.
The current market scenario reflects stable supply chains and rising innovation in bio-based and recyclable foams. Future growth will be supported by stricter energy codes, urbanization, and product diversification across high-performance sectors such as aerospace and healthcare..
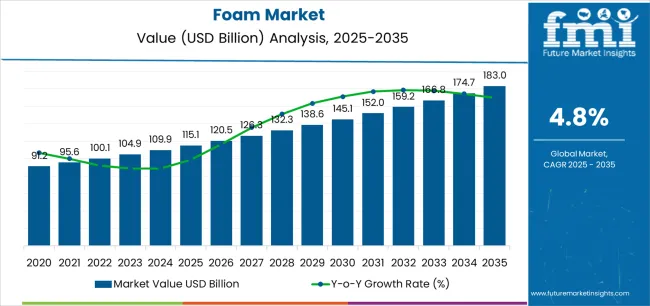
| Metric | Value |
|---|---|
| Foam Market Estimated Value in (2025 E) | USD 115.1 billion |
| Foam Market Forecast Value in (2035 F) | USD 183.0 billion |
| Forecast CAGR (2025 to 2035) | 4.8% |
The market is segmented by Type, Resin Type, and End Use Industry and region. By Type, the market is divided into Flexible Foam and Rigid Foam. In terms of Resin Type, the market is classified into Polyurethane, Polystyrene, Polyolefin, Phenolic, PET, and Others. Based on End Use Industry, the market is segmented into Building & Construction, Packaging, Automotive, and Others. Regionally, the market is classified into North America, Latin America, Western Europe, Eastern Europe, Balkan & Baltic Countries, Russia & Belarus, Central Asia, East Asia, South Asia & Pacific, and the Middle East & Africa.
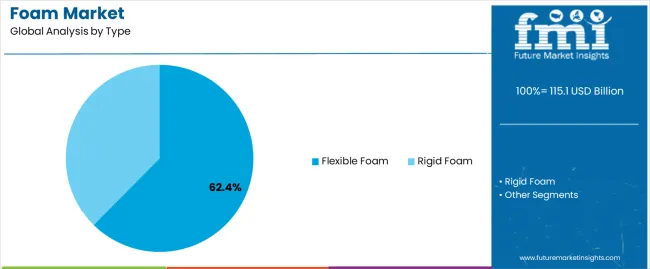
The flexible foam segment dominates the type category with approximately 62.4% share, driven by its wide applicability in furniture, automotive seating, and packaging. This segment’s leadership is attributed to its high elasticity, resilience, and adaptability to various shapes and densities, meeting performance requirements across diverse end uses.
The segment benefits from increased demand for comfort materials and lightweight cushioning solutions in both residential and industrial contexts. Production efficiency and recyclability have improved through innovations in open-cell foam technology, supporting sustainability goals.
Flexible foams are also increasingly integrated into acoustic insulation and vibration control applications, broadening their industrial footprint. With continuous growth in consumer goods and automotive manufacturing, the flexible foam segment is expected to maintain its strong position throughout the forecast horizon..
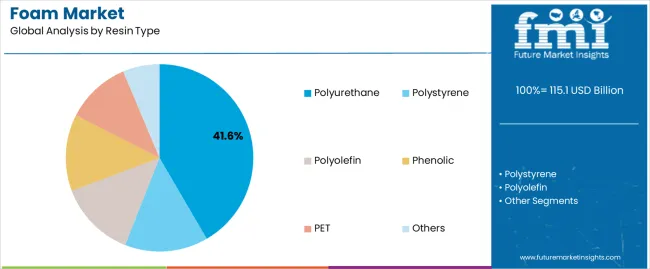
The polyurethane segment accounts for approximately 41.6% share within the resin type category, reflecting its dominance due to versatility and superior mechanical properties. Polyurethane foam’s excellent thermal insulation, chemical resistance, and durability make it suitable for applications spanning construction, furniture, refrigeration, and automotive sectors.
The material’s adaptability to both flexible and rigid forms enhances its market competitiveness. Increasing emphasis on energy efficiency in buildings and appliances continues to drive polyurethane demand.
The development of bio-based and low-VOC polyurethane formulations is further reinforcing market growth, aligning with environmental sustainability standards. With advancements in manufacturing and material performance, polyurethane remains the preferred resin type across major foam-producing industries..
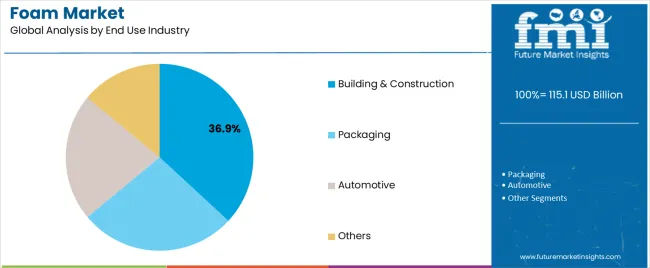
The building and construction segment leads the end use industry category, holding approximately 36.9% share of the foam market. This dominance is supported by the growing adoption of foams for thermal insulation, soundproofing, and structural cushioning in residential and commercial projects.
Rising urbanization and energy conservation regulations have amplified demand for insulating materials that reduce heat transfer and improve building efficiency. Foam products are increasingly utilized in roofing, wall insulation, and flooring systems due to their lightweight and durable characteristics.
With continuous infrastructure development and a global focus on sustainable construction practices, the building and construction segment is anticipated to remain a key growth driver for the foam market..
Foams are Transforming Construction with Unmatched Insulation Performance! The construction sector is significantly fueling the growth of the foam technology market due to its extensive use in insulation applications.
Urbanization Sparks a Surge in Demand for Advanced Foams! Increasing urbanization and infrastructure development activities are fueling the demand for foams in the furniture industry.
Foams Take the Automotive Industry by Storm with Lightweight Solutions! Growing demand from the automotive industry is pushing the automotive foam market expansion considerably.
Foams Dominate the Packaging Industry with Unbeatable Protection and Sustainability! With the rise of eCommerce and online commerce, the packaging sector has an important mark on the foam industry.
Sustainable Foam Solutions Revolutionize Market amidst Oil Price Fluctuations! The recent fluctuation in oil prices, along with the emergence of sustainable foam, significantly impacted the profitability of the foam packaging market.
The product cost structure is determined by raw material price and availability. Toluene, phosgene, polyol, and benzene are the main basic components used to produce foam. These derivatives are derived from petroleum and are subject to price changes.
Conflict and growing global demand are the main reasons why oil prices are still quite erratic. The volatility of petrochemical-based raw material prices has impacted the foam industry in recent years.
Persistent global demand has also LED to a tightening of supply and a spike in the price of raw materials, along with capacity limitations of primary chemicals and resins.
The past several years have experienced extreme pricing pressure on the polyols market as a result of changes in the price of crude oil. The primary cause of the increase in the cost of producing polyols is the growing cost of important raw materials like propylene and propylene oxide, which are petroleum product derivatives.
Producers face increased pricing pressure since capital and raw material expenses make up a large amount of the costs associated with producing foam.
From 2020 to 2025, the foam industry showed promising growth, boasting a 6.0% CAGR. During this time, advancements in manufacturing technologies contributed significantly to the expansion of foam product offerings.
Moreover, as sustainability became a more significant concern, the development of eco-friendly foam alternatives gained traction, driving innovation and market diversification.
| Historical CAGR (2020 to 2025) | 6.0% |
|---|---|
| Forecasted CAGR (2025 to 2035) | 5.0% |
The market for foams is expected to exhibit a lower CAGR compared to the historical period. Despite the anticipated decrease in growth rate, the foam market global forecast anticipates considerable progression driven by increasing emphasis on healthcare and medical applications.
At present, foams are extensively used in medical devices, wound care products, orthopedic supports, and prosthetics. This is due to their excellent cushioning, shock absorption, and pressure distribution properties.
Manufacturer of infection control products, Tristel, requested regulatory clearance in September 2025 for its hand-applied Tristel ULT high-level disinfection foam, which is intended for use as a Class II medical device for endo-cavity ultrasound probes and skin surface transducers.
This is expected to have a highly positive impact on the global demand for foams.
The North America foam market stands out as a dominant force. The region is home to a sizable vehicle manufacturing industry. Additionally, the necessity for efficient packing solutions like packaging foams is fueled by the expansion of the retail industry.
Europe is witnessing continuous and steady growth in demand for foams. Several countries in the region have established advantageous policies and incentives to support businesses that employ eco-friendly, lightweight materials like foams.
The Asia Pacific foam manufacturing market is likely to progress significantly. Growing disposable income and the increasing recognition of online retailers like Flipkart and Amazon represent a few of the reasons propelling the industry.
| Country | United States |
|---|---|
| Forecasted CAGR (2025 to 2035) | 5.3% |
| Market Size by 2035 | USD 32.4 billion |
| Country | United Kingdom |
|---|---|
| Forecasted CAGR (2025 to 2035) | 5.5% |
| Market Size by 2035 | USD 7.1 billion |
| Country | China |
|---|---|
| Forecasted CAGR (2025 to 2035) | 5.9% |
| Market Size by 2035 | USD 29.2 billion |
| Country | Japan |
|---|---|
| Forecasted CAGR (2025 to 2035) | 6.1% |
| Market Size by 2035 | USD 19.9 billion |
| Country | South Korea |
|---|---|
| Forecasted CAGR (2025 to 2035) | 7.5% |
| Market Size by 2035 | USD 10.9 billion |
Demand for foams in the United States is set to rise with an anticipated CAGR of 5.3% through 2035. Key factors influencing the packaging foam market share in this country include:
The market in the United Kingdom is expected to surge at a CAGR of 5.5% through 2035. The topmost aspects supporting the polyurethane foam market extension in the country include:
The China foam market is forecasted to inflate at a CAGR of 5.9% through 2035. Noticeable influences backing up the expanded polystyrene market growth are:
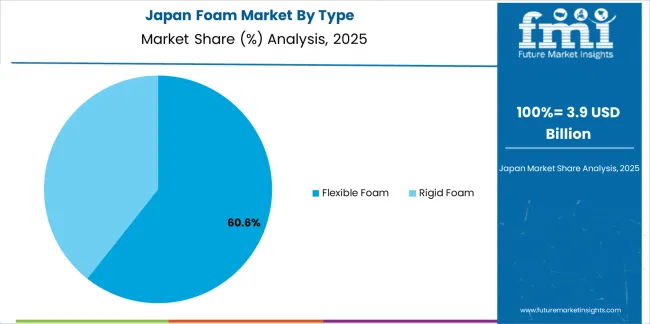
Sales of foams in Japan are estimated to record a CAGR of 6.1% through 2035. The principal factors bolstering the market are:
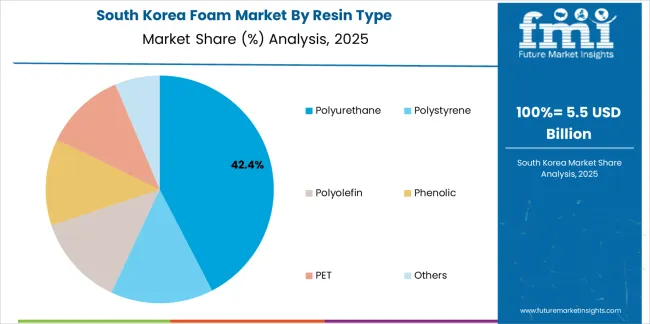
The market in South Korea is likely to exhibit a CAGR of 7.5% through 2035. Reasons supporting the growth of polymer foam market in the country include:
As far as the resin type of foam is concerned, the polyurethane segment is likely to dominate through 2035, registering a CAGR of 4.9%. Similarly, the flexible foam segment is expected to dominate the revenue share of foams in terms of type, with a projected CAGR of 4.8% through 2035.
| Segment | Forecasted CAGR (2025 to 2035) |
|---|---|
| Polyurethane | 4.9% |
| Flexible Foam | 4.8% |
The polyurethane segment is anticipated to lead the way, holding an impressive foam market share. Here are a few key dynamics that contribute to its approval:
The flexible foam type takes the top spot in the foam industry, a trend validated by factors such as:
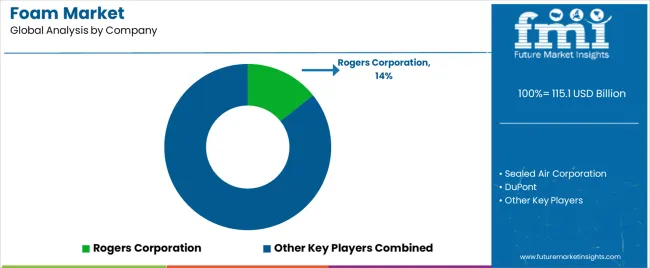
Foam market players employ diverse strategies to gain a competitive edge. Rogers Corporation focuses on innovation, leveraging advanced materials for high-performance applications. Eco-friendly foam solutions are provided by Sealed Air Corporation, which places a strong emphasis on sustainability.
DuPont places a high priority on research and development in an effort to advance foam technology. The Dow Company is an expert at customizing foam products to meet the demands of particular industries.
Nova Chemicals Corp. takes a customer-first stance, offering thorough assistance and adaptable solutions to satisfy a range of market demands.
Recent Developments
The global foam market is estimated to be valued at USD 115.1 billion in 2025.
The market size for the foam market is projected to reach USD 183.0 billion by 2035.
The foam market is expected to grow at a 4.8% CAGR between 2025 and 2035.
The key product types in foam market are flexible foam and rigid foam.
In terms of resin type, polyurethane segment to command 41.6% share in the foam market in 2025.


Our Research Products

The "Full Research Suite" delivers actionable market intel, deep dives on markets or technologies, so clients act faster, cut risk, and unlock growth.

The Leaderboard benchmarks and ranks top vendors, classifying them as Established Leaders, Leading Challengers, or Disruptors & Challengers.

Locates where complements amplify value and substitutes erode it, forecasting net impact by horizon

We deliver granular, decision-grade intel: market sizing, 5-year forecasts, pricing, adoption, usage, revenue, and operational KPIs—plus competitor tracking, regulation, and value chains—across 60 countries broadly.

Spot the shifts before they hit your P&L. We track inflection points, adoption curves, pricing moves, and ecosystem plays to show where demand is heading, why it is changing, and what to do next across high-growth markets and disruptive tech

Real-time reads of user behavior. We track shifting priorities, perceptions of today’s and next-gen services, and provider experience, then pace how fast tech moves from trial to adoption, blending buyer, consumer, and channel inputs with social signals (#WhySwitch, #UX).

Partner with our analyst team to build a custom report designed around your business priorities. From analysing market trends to assessing competitors or crafting bespoke datasets, we tailor insights to your needs.
Supplier Intelligence
Discovery & Profiling
Capacity & Footprint
Performance & Risk
Compliance & Governance
Commercial Readiness
Who Supplies Whom
Scorecards & Shortlists
Playbooks & Docs
Category Intelligence
Definition & Scope
Demand & Use Cases
Cost Drivers
Market Structure
Supply Chain Map
Trade & Policy
Operating Norms
Deliverables
Buyer Intelligence
Account Basics
Spend & Scope
Procurement Model
Vendor Requirements
Terms & Policies
Entry Strategy
Pain Points & Triggers
Outputs
Pricing Analysis
Benchmarks
Trends
Should-Cost
Indexation
Landed Cost
Commercial Terms
Deliverables
Brand Analysis
Positioning & Value Prop
Share & Presence
Customer Evidence
Go-to-Market
Digital & Reputation
Compliance & Trust
KPIs & Gaps
Outputs
Full Research Suite comprises of:
Market outlook & trends analysis
Interviews & case studies
Strategic recommendations
Vendor profiles & capabilities analysis
5-year forecasts
8 regions and 60+ country-level data splits
Market segment data splits
12 months of continuous data updates
DELIVERED AS:
PDF EXCEL ONLINE
Foam Type Vacuum Gripping System Market Size and Share Forecast Outlook 2025 to 2035
Foam Mixing Machine Market Size and Share Forecast Outlook 2025 to 2035
Foam-Free Pad Formers Market Size and Share Forecast Outlook 2025 to 2035
Foam Cups Market Size and Share Forecast Outlook 2025 to 2035
Foam Bottle Technology Market Size and Share Forecast Outlook 2025 to 2035
Foaming Agents Market Size and Share Forecast Outlook 2025 to 2035
Foam Glass Granulate Market Size and Share Forecast Outlook 2025 to 2035
Foam Plastics Market Size and Share Forecast Outlook 2025 to 2035
Foaming Creamer Market Size and Share Forecast Outlook 2025 to 2035
Foam Tape Market Size and Share Forecast Outlook 2025 to 2035
Foam Glass Market Size and Share Forecast Outlook 2025 to 2035
Foamer Pump Market Size, Share & Forecast 2025 to 2035
Foam Food Container Market Size and Share Forecast Outlook 2025 to 2035
Foam Mesh Sleeves Market Growth - Demand & Forecast 2025 to 2035
Foam Edge Protectors Market Size and Share Forecast Outlook 2025 to 2035
Foamer Bottle Market Size and Share Forecast Outlook 2025 to 2035
Foam Cap Liners Market Size and Share Forecast Outlook 2025 to 2035
Foam Pouch Market Analysis - Demand, Size & Industry Outlook 2025 to 2035
Foam Cooler Box Market Analysis - Growth & Trends 2025 to 2035
Foam Packaging Inserts Market Analysis, Size, Share & Forecast 2025 to 2035

Thank you!
You will receive an email from our Business Development Manager. Please be sure to check your SPAM/JUNK folder too.
Chat With
MaRIA