Foamer Pump Market Size and Share Forecast Outlook from 2025 to 2035

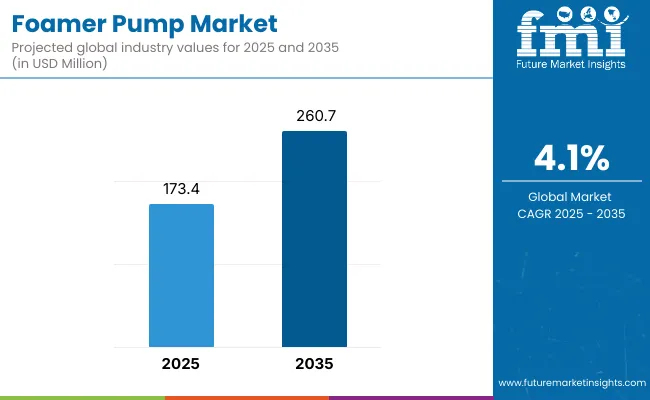
The foamer pump market is projected to grow from USD 872.3 million in 2025 to USD 1,257.5 million by 2035, registering a CAGR of 3.7% during the forecast period. Sales in 2024 reached USD 567.5 million, reflecting the sector's resilience in the personal care packaging landscape.

Much of this growth is driven by the continued consumer preference for foam-based dispensers in facial and body care products, with this segment expected to contribute over 30% of the total market share. The popularity of foamer pumps is largely attributed to their ability to dispense a smooth, rich lather with minimal product usage, offering an enhanced user experience, convenience, and reduced product waste..

Foamer Pump Industry Forecast

Metric Value
Industry Size (2025E) USD 872.3 million
Industry Value (2035F) USD 1,257.5 million
CAGR (2025 to 2035) 3.7%

A significant shift is being observed in material preferences within the industry. Plastic foamer pumps are projected to dominate in terms of market share between 2025 and 2035. This dominance is supported by factors such as cost-efficiency, chemical resistance, and ease of customization.

Their lightweight nature and lower manufacturing cost also enable wide adoption by FMCG companies aiming to balance affordability and user experience. In recent developments, Silgan Dispensing announced the expansion of its foamer pump range in early 2024, targeting personal care and beauty brands looking for customizable, low-foam dose solutions.

In a statement during the launch spokeperson from Siligan dispensing expressed “We are excited to expand the ReVive™ portfolio with the introduction of the 1.4cc dispenser, which is designed to meet the evolving needs of our customers while upholding our commitment to sustainability,” said Stephanie Hawkins, VP Marketing at Silgan Dispensing. “By offering a variety of output sizes that cater to different beauty and personal care applications, we’re helping brands stay ahead of market trends and meet consumer demand for both performance and sustainability.”

The market’s expansion is also supported by the surge in demand for paraben-free, sulfate-free, and organic personal care products that are often packaged with airless and foamer dispensing systems. Brands are leveraging these pumps not only to improve consumer usability but also to align with rising eco-conscious values.

According to Packaging Digest, new entrants in Asia and Latin America have also been boosting production capacities to cater to regional demand spikes in skin care and hygiene. Moreover, the foamer pump market is expected to deliver an incremental opportunity worth USD 385.2 million through 2035, as global brands and local manufacturers increasingly invest in differentiated packaging formats to improve product appeal and dosing precision. With its ability to reduce waste and enhance packaging aesthetics, the foamer pump is positioned as a strategic component in the premiumization of personal care product lines.

Semi Annual Market Update

The below table presents the expected CAGR for the global foamer pump market over several semi-annual periods spanning from 2024 to 2034.

Particular Value CAGR
H1 1.2% (2024 to 2034)
H2 3.0% (2024 to 2034)
H1 2.4% (2025 to 2035)
H2 4.0% (2025 to 2035)

In the first half (H1) of the decade from 2024 to 2034, the business is predicted to surge at a CAGR of 1.2%, followed by a slightly higher growth rate of 3.0% in the second half (H2) of the same decade. Moving into the subsequent period, from H1 2025 to H2 2035, the CAGR is projected to decrease slightly to 2.4% in the first half and remain relatively moderate at 4.0% in the second half. In the first half (H1) the market witnessed a decrease of 120 BPS while in the second half (H2), the market witnessed an increase of 100 BPS.
Analyzing Foamer Pump Market by Top Investing Segments

Rising Preference for Squeeze Foamer Pumps Driven by Affordability, Simplicity, and Enhanced Foam Quality

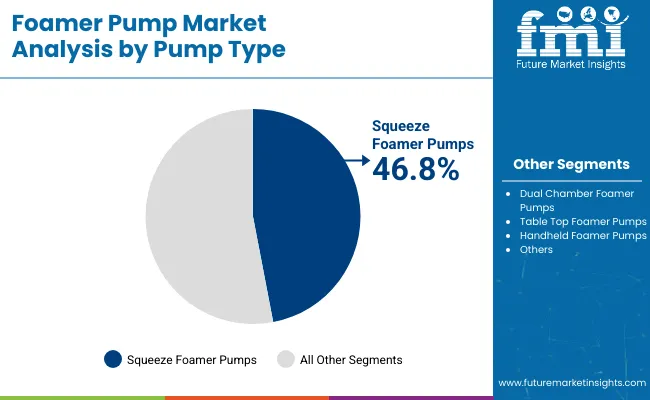
Squeeze foamer pumps are projected to account for approximately 40.1% of the pump type market by 2025, reflecting their rising popularity across personal care and household product applications. These pumps have been favored for their simple and intuitive design, which allows users to dispense pre-foamed product by merely squeezing the bottle, eliminating the need for complex internal components. Their low production cost and compatibility with non-pressurized containers have made them a more sustainable and economical choice compared to traditional dispensing systems.

The foamed product generated by squeeze pumps is typically light, uniform, and easy to apply, contributing to a more pleasant and hygienic user experience. This format has gained traction in hand soaps, sanitizers, and personal care formulations where consistent lather and reduced water usage are desired.

The packaging also limits product wastage by delivering a pre-determined dose that spreads evenly across the applied area. These advantages have been instrumental in the pump’s widespread adoption and are expected to drive continued growth across cost-sensitive and high-volume applications.

Face & Body Wash Application Segment Projected to Lead Due to Controlled Dispensing and Enhanced Sensory Experience

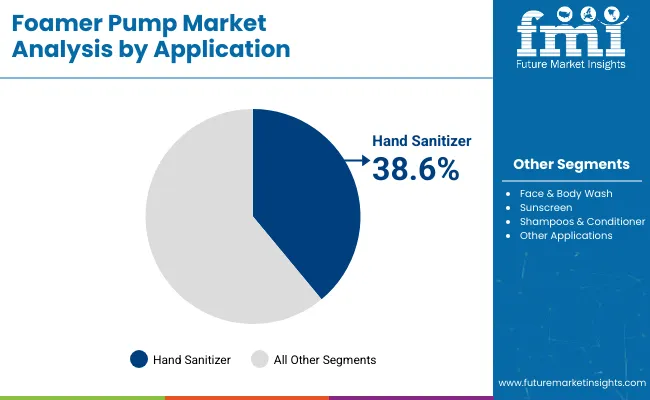
Face and body wash applications to command a 29.2% share of the foamer pump market by 2025, making it the most dominant application category. This leadership is expected to be supported by the rising demand for convenient, mess-free, and skin-friendly dispensing solutions in the personal care sector. Foamer pumps, through their aeration mechanism, transform liquid formulations into soft, lathering foam that enhances spreadability while using less product per application.

This efficient conversion supports both functional and experiential benefits by improving cleansing performance while creating a luxurious, spa-like sensation for users. In facial care products, especially sensitive skin cleansers, foamer pumps ensure gentle application and reduce the risk of overuse or irritation.

The format’s ability to offer controlled, waste-reducing, and aesthetically appealing application has resulted in widespread adoption by skincare brands. As consumers continue to seek premium user experiences in daily hygiene routines, face and body wash categories are expected to remain a central growth driver for foamer pump adoption through the forecast period.

Key Industry Highlights

Increasing Foam-Based Skincare and Hygiene Products Boost Foamer Pump Market

Consumers themselves actively choose foam-based products because of their smooth texture and luxurious feel, which creates demand for foamer pumps. In skincare and personal care, foaming soaps and cleansers produce a smooth lather that is silky on the skin, creating an improved experience. In contrast to liquid soaps, foam is easy to spread, meaning it requires less effort to apply and rinse off.

This makes it appealing to users who look for fast and effective hygiene products. Also, foaming products tend to incorporate milder components, which is why they suit sensitive skin as well as infant care products. Manufacturers take advantage of this penchant by launching upscale foaming forms, further spurring the uptake of foamer pumps. As consumers associate foam with quality and comfort, manufacturers continue to invest in innovative foamer pump solutions to meet demand.

Enhanced safety protocols Increase Foamer Pump Demand in Pharmaceutical & Cleaning Sectors

Safety and regulatory concerns positively influence the need for foamer pumps in a wide range of industries. Spills are minimized, waste is reduced, and user safety is improved through controlled dispensing, making foamer pumps a requirement for pharmaceuticals, household products, and industrial cleaners. Regulations promote their application in certain formulations to avoid direct contact with highly concentrated or harmful liquids, limiting risks of skin irritation and unintentional ingestion.

In the healthcare industry, foamer pumps provide accurate dosing for antiseptics and disinfectants to enhance infection control. Domestic and automotive cleaning products also gain benefits through foam, which adheres longer to surfaces, limiting contact with harsh chemicals. As global safety standards rise and consumer consciousness grows, companies apply foamer pumps to meet standards while enhancing product usability and efficacy.

Foamer Pump Performance Issues My Affect Consumer Satisfaction & Impact Demand

Eventually, foamer pumps may wear down, causing performance problems. The internal workings, depending on the exact mixing of air and liquid, can get worn out, causing clogging or inconsistent dispensing of the foam. This will annoy consumers who are expecting a high-quality consistent experience each time.

If the pump does not dispense the intended foam or clogs, consumers will find it hard to use the product, and this could result in poor reviews. Consumers can also choose other products with more consistent dispensing systems. These performance and durability issues, if not corrected, could undermine the demand for foamer pumps.

Industry Adoption: Key Areas of Investment (2025 to 2035)

Key Investment Area Why It’s Critical for Future Growth
Smart & Touchless Dispensing Solutions Increasing need for sensor-based, hygiene-oriented foamer pumps in medical and public applications.
Advanced Dispensing Technology Improving user experience with accurate dosage adjustment and enhanced foam efficiency.
Healthcare & Pharmaceutical Applications Growing use in medical-grade hand sanitizers, antiseptics, and wound care solutions.
E-commerce & Subscription-Based Packaging Increasing demand for durable, leak-proof foamer pumps for direct-to-consumer shipments.
Customization & Branding Innovations Customers looking for specialty foamer pump designs for differentiation and premium product segmentation.

2020 to 2024 Global Foamer Pump Sales Outlook Compared to Demand Forecast from 2025 to 2035

The global foamer pump market recorded a CAGR of 2.8% during the historical period between 2020 and 2024. Market growth of foamer pump was positive as it reached a value of USD 167.5 million in 2024 from 149.5 million in 2020.

Growing demand for pharmaceutical, household, and personal care applications has spurred considerable growth in foamer pump sales over the past few years. Companies have focused on innovation, incorporating sustainable materials and sophisticated dispensing mechanisms. Users are increasingly looking for controlled product use and improved user experience, which has further strengthened market adoption in diverse industries and increased overall production capacities.

Future demand for foamer pumps will pick up speed, driven by growing sustainability efforts and the trend toward refillable packaging. Increased innovation in lightweight design and airless foaming technology will dominate the landscape, increasing efficiency while reducing costs. Growing e-commerce and evolving consumer behavior will also redefine market dynamics, creating mass acceptance in beauty, hygiene, and cleaning industries.

Market Aspect 2020 to 2024 (Past Trends)
Market Growth Growing usage in personal care with heightened awareness of hygiene, coupled with consistent demand from the house cleaning segments.
Key Applications Used mostly in cosmetics, home cleaning, and skincare, with moderate usage in pharmaceutical packaging.
Technological Advances Development of precise air-liquid mixing for better foam consistency, lightweight materials, and ergonomic dispensing designs.
Consumer Trends Preferential use of luxurious foamy textures in cosmetics and soaps, with post COVID-19 influencing hygiene-driven habits.
Competitive Landscape Global packaging industry dominated by large players, while smaller companies develop cost-effective solutions for specialized segments.
Market Aspect 2025 to 2035 (Future Projections)
Market Growth Rapid expansion driven by sustainability concerns, water conservation needs, and emerging applications in pharmaceuticals and industrial use.
Key Applications Extensive use in healthcare and industrial process-specific formulations, medical foams, cosmetics, and disinfectants.
Technological Advances Incorporation of smart dispensing technologies, refillable cartridge systems, and high-end material engineering to enhance recyclability.
Consumer Trends Strong shift toward refillable, sustainable foamer packaging, with consumer demand for customizable and eco-friendly dispensing solutions.
Competitive Landscape Competitive forces increase with new entrants making use of biodegradable materials, reusable pumps, and IoT-facilitated intelligent dispensing innovation.

Market Concentration

Tier 1 companies comprise market leaders capturing significant market share in global market. These industry leaders stand out for having a large product variety and a high production capacity. These industry giants stand out for having a wide geographic reach, a wealth of production experience in a variety of package styles, and a strong customer base.

They offer a variety of services, such as recycling and manufacturing, using state-of-the-art equipment, according to legal requirements, and offering the best possible quality. Among the well-known businesses in tier 1 are Sappi Limited, Felix Schoeller, SURTECO GmbH and Toppan Europe GmbH.

Tier 2 companies include mid-size players having presence in specific regions and highly influencing the local market. They are distinguished by having a significant international presence and in-depth industry expertise. These market participants may not have cutting-edge technology or a broad worldwide reach, but they do guarantee regulatory compliance and have good technology.

Among the well-known businesses in tier 2 Richmond Containers CTP Ltd., Frapack Packagibg B.V., Raepak Ltd., APackaging Group, Weltrade Packaging, Sun-Rain Sprayer Co., Ltd., ScopeNEXT Ltd., Luencheong Dispensing Pump Ltd. (CLC), Matsa Group Ltd., Taplast srl and Radcom Packaging Private Limited.

Tier 3 includes the majority of small-scale companies operating at the local presence and serving niche markets Due to their specialization in serving the demands of the local market, these companies are classified as belonging to the tier 3 sharing sector. They only operate on a small scale and within a limited geographic area. Within this specific context, Tier 3 is categorized as an unstructured market, denoting an industry that is significantly less formalized and structured than its organized rivals.
Country Wise Insights

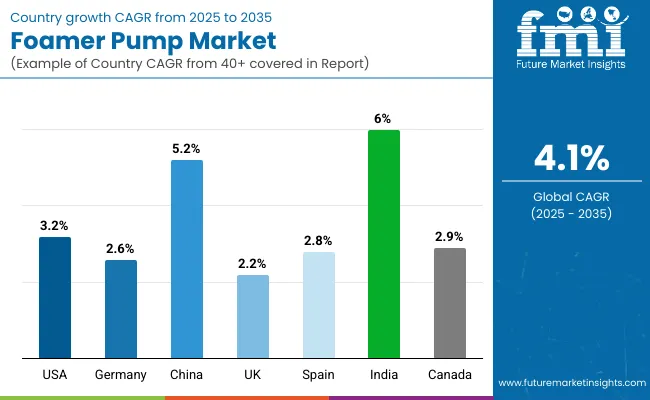
The section below covers the future forecast for the foamer pump market in terms of countries. Information on key countries in several parts of the globe, including North America, Latin America, East Asia, South Asia and Pacific, Western Europe, Eastern Europe and MEA is provided. USA is anticipated to remain at the forefront in North America, with a CAGR of 3.2% through 2035. In Western Europe, Germany is projected to witness a CAGR of 2.6% by 2035.

Countries Value CAGR (2025 to 2035)
USA 3.2%
Germany 2.6%
China 5.2%
UK 2.2%
Spain 2.8%
India 6.0%
Canada 2.9%

Risen Demand for Premium Skincare and Haircare in the USA Boosts Foamer Pump Use

The increasing USA demand for luxury skincare, hand washes, and shampoos fuels foamer pump adoption. Consumers demand high-quality, luxurious products with a rich, foamy feel that improves their overall experience. Brands react by adding foamer pumps to cleansers, facial washes, and liquid soaps to enhance product performance and minimize waste.

The trend towards soft, sulfate-free, and organic formulations is also driving demand for foamer pumps as they provide controlled dispensing and soft application. Meanwhile, social media and influencer marketing enhance visibility of luxury skincare routines to create even greater consumer interest in advanced packaging solutions such as foamer pumps that drive product appeal and functionality in the fast-growing personal care market.

Hygiene Standards in Germany Spurs Foamer Pump Demand in Industrial & Medical Sectors

Germany has a strong focus on hygiene in hospital, industrial, and public settings, and as such, demands for foamer pumps in soap dispensers and disinfectants is high. Hospitals, labs, and production sites need to have efficient touch-free dispensing mechanisms to preserve stringent hygiene requirements. Foamer pumps promote hand hygiene by ensuring a measured volume of disinfectant and saving product.

They are extensively applied in food processing facilities, where contamination hazards are high, allowing workers to sanitize hands efficiently. For instance, a German pharmaceutical firm incorporated foamer pumps into its hospital-grade disinfectants, enhancing application efficiency and minimizing overuse. This transition is consistent with Germany's strict hygiene regulations and sustainability objectives.

Competitive Landscape

Leading companies in the foamer pump are creating and introducing new products with additional benefits and applications to the market. They are expanding their geographic reach and merging with other companies. Few of them are also working together to develop new products in partnerships with start-up businesses and regional brands.

Key Developments in Foamer Pump Market

  • In February 2025, Aptar Beauty launched the HDP, an innovative all-plastic, high-dose dispensing pump for personal care products.
  • In January 2025, Albéa's acquired Conanec Industrie, a mold manufacturing company to enhance its competitiveness in various sectors. The move will strengthen its capabilities by combining expertise from France and China, reducing lead times, optimizing costs, and improving service quality.
  • In January 2025, Rieke Packaging introduced Singolo, a recyclable foaming dispenser pump with a mono-material design, improving recyclability while ensuring efficient foaming. This innovation meets rising demand for sustainable, high-performance dispensing in personal care and household products.
  • In October 2024, Silgan acquired Weener Plastics Holdings B.V., a leading producer of differentiated dispensing solutions for personal care, food and healthcare products.

Vendor Insights in Foamer Pump Industry

Manufacturer Vendor Insights
Albéa S.A. Albéa offers innovative, eco-friendly foamer pumps for personal care, home care, and healthcare, focusing on sustainability and efficient dispensing.
Aptar Group, Inc. Aptar specializes in precise, luxurious foamer pumps for personal and home care, prioritizing functionality, aesthetics, and sustainability.
Silgan Dispensing Systems Corp. Silgan provides durable, high-quality foamer pumps for personal care, food, and household products, focusing on innovation and performance.
Richmond Containers CTP Ltd. Richmond Containers offers customizable foamer pumps with consistent foam output, serving both high-end and value markets in personal care.
Frapack Packaging B.V. Frapack provides cost-effective, high-performance foamer pumps, ensuring reliable foam output for cosmetics, cleaning, and other industries.

Key Players in Foamer Pump Market

  • Albéa S.A.
  • Aptar Group, Inc.
  • Silgan Dispensing Systems Corp
  • Richmond Containers CTP Ltd.
  • Frapack Packagibg B.V.
  • Raepak Ltd.
  • APackaging Group
  • Weltrade Packaging
  • Rieke Corporation
  • Sun-Rain Sprayer Co., Ltd.
  • ScopeNEXT Ltd.
  • Luencheong Dispensing Pump Ltd. (CLC)
  • Matsa Group Ltd.
  • Taplast srl
  • Radcom Packaging Private Limited

Foamer Pump Market Segmentation

By Pump Type:

In terms of pump type, the industry is segmented into squeeze foamer pumps, dual chamber foamer pumps, table top foamer pumps and handheld foamer pumps.

By Material:

In terms of material, the industry is segmented into plastic and metal. Plastic includes polyethylene (PE), polyethylene terephthalate (PET), polyvinyl chloride (PVC), polypropylene (PP) and others.

By Application:

In terms of application, the industry is segmented into hand sanitizer, face & body wash, sunscreen, shampoos & conditioner and other applications.

By Region:

Key countries of North America, Latin America, East Asia, South Asia and Pacific, Western Europe, Eastern Europe, Middle East and Africa are covered.

Table of Content

  1. Executive Summary
  2. Industry Introduction, including Taxonomy and Market Definition
  3. Market Trends and Success Factors, including Macro-economic Factors, Market Dynamics, and Recent Industry Developments
  4. Global Market Demand Analysis 2020 to 2024 and Forecast 2025 to 2035, including Historical Analysis and Future Projections
  5. Global Market Analysis 2020 to 2024 and Forecast 2025 to 2035
    • Pump Type
    • Material
    • Application
  6. Global Market Analysis 2020 to 2024 and Forecast 2025 to 2035, By Pump Type
    • Squeeze Foamer Pumps
    • Dual Chamber Foamer Pumps
    • Table Top Foamer Pumps
    • Handheld Foamer Pumps
  7. Global Market Analysis 2020 to 2024 and Forecast 2025 to 2035, By Material
    • Plastic
    • Metal
  8. Global Market Analysis 2020 to 2024 and Forecast 2025 to 2035, By Application
    • Hand Sanitizer
    • Face & Body Wash
    • Sunscreen
    • Shampoos & Conditioners
    • Other Applications
  9. Global Market Analysis 2020 to 2024 and Forecast 2025 to 2035, By Region
    • North America
    • Latin America
    • East Asia
    • South Asia & Pacific
    • Western Europe
    • Eastern Europe
    • Middle East & Africa
  10. North America Sales Analysis 2020 to 2024 and Forecast 2025 to 2035, by Key Segments and Countries
  11. Latin America Sales Analysis 2020 to 2024 and Forecast 2025 to 2035, by Key Segments and Countries
  12. East Asia Sales Analysis 2020 to 2024 and Forecast 2025 to 2035, by Key Segments and Countries
  13. South Asia & Pacific Sales Analysis 2020 to 2024 and Forecast 2025 to 2035, by Key Segments and Countries
  14. Western Europe Sales Analysis 2020 to 2024 and Forecast 2025 to 2035, by Key Segments and Countries
  15. Eastern Europe Sales Analysis 2020 to 2024 and Forecast 2025 to 2035, by Key Segments and Countries
  16. Middle East & Africa Sales Analysis 2020 to 2024 and Forecast 2025 to 2035, by Key Segments and Countries
  17. Sales Forecast 2025 to 2035 by Pump Type, Material, and Application for 30 Countries
  18. Competition Outlook, including Market Structure Analysis, Company Share Analysis by Key Players, and Competition Dashboard
  19. Company Profile
    • Albéa S.A.
    • Aptar Group, Inc.
    • Silgan Dispensing Systems Corp
    • Richmond Containers CTP Ltd.
    • Frapack Packaging B.V.
    • Raepak Ltd.
    • APackaging Group
    • Weltrade Packaging
    • Rieke Corporation
    • Sun-Rain Sprayer Co., Ltd.

List of Tables

Table 01: Global Value (US$ million) Forecast by Region, 2015 to 2033

Table 02: Global Volume (Units) Forecast by Region, 2015 to 2033

Table 03: Global Value (US$ million) Forecast by Pump Type, 2015 to 2033

Table 04: Global Volume (Units) Forecast by Pump Type, 2015 to 2033

Table 05: Global Value (US$ million) Forecast by Material, 2015 to 2033

Table 06: Global Volume (Units) Forecast by Material, 2015 to 2033

Table 07: Global Value (US$ million) Forecast by Application, 2015 to 2033

Table 08: Global Volume (Units) Forecast by Application, 2015 to 2033

Table 09: North America Value (US$ million) Forecast by Country, 2015 to 2033

Table 10: North America Volume (Units) Forecast by Country, 2015 to 2033

Table 11: North America Value (US$ million) Forecast by Pump Type, 2015 to 2033

Table 12: North America Volume (Units) Forecast by Pump Type, 2015 to 2033

Table 13: North America Value (US$ million) Forecast by Material, 2015 to 2033

Table 14: North America Volume (Units) Forecast by Material, 2015 to 2033

Table 15: North America Value (US$ million) Forecast by Application, 2015 to 2033

Table 16: North America Volume (Units) Forecast by Application, 2015 to 2033

Table 17: Latin America Value (US$ million) Forecast by Country, 2015 to 2033

Table 18: Latin America Volume (Units) Forecast by Country, 2015 to 2033

Table 19: Latin America Value (US$ million) Forecast by Pump Type, 2015 to 2033

Table 20: Latin America Volume (Units) Forecast by Pump Type, 2015 to 2033

Table 21: Latin America Value (US$ million) Forecast by Material, 2015 to 2033

Table 22: Latin America Volume (Units) Forecast by Material, 2015 to 2033

Table 23: Latin America Value (US$ million) Forecast by Application, 2015 to 2033

Table 24: Latin America Volume (Units) Forecast by Application, 2015 to 2033

Table 25: East Asia Value (US$ million) Forecast by Country, 2015 to 2033

Table 26: East Asia Volume (Units) Forecast by Country, 2015 to 2033

Table 27: East Asia Value (US$ million) Forecast by Pump Type, 2015 to 2033

Table 28: East Asia Volume (Units) Forecast by Pump Type, 2015 to 2033

Table 29: East Asia Value (US$ million) Forecast by Material, 2015 to 2033

Table 30: East Asia Volume (Units) Forecast by Material, 2015 to 2033

Table 31: East Asia Value (US$ million) Forecast by Application, 2015 to 2033

Table 32: East Asia Volume (Units) Forecast by Application, 2015 to 2033

Table 33: South Asia & Pacific Value (US$ million) Forecast by Country, 2015 to 2033

Table 34: South Asia & Pacific Volume (Units) Forecast by Country, 2015 to 2033

Table 35: South Asia & Pacific Value (US$ million) Forecast by Pump Type, 2015 to 2033

Table 36: South Asia & Pacific Volume (Units) Forecast by Pump Type, 2015 to 2033

Table 37: South Asia & Pacific Value (US$ million) Forecast by Material, 2015 to 2033

Table 38: South Asia & Pacific Volume (Units) Forecast by Material, 2015 to 2033

Table 39: South Asia & Pacific Value (US$ million) Forecast by Application, 2015 to 2033

Table 40: South Asia & Pacific Volume (Units) Forecast by Application, 2015 to 2033

Table 41: Western Europe Value (US$ million) Forecast by Country, 2015 to 2033

Table 42: Western Europe Volume (Units) Forecast by Country, 2015 to 2033

Table 43: Western Europe Value (US$ million) Forecast by Pump Type, 2015 to 2033

Table 44: Western Europe Volume (Units) Forecast by Pump Type, 2015 to 2033

Table 45: Western Europe Value (US$ million) Forecast by Material, 2015 to 2033

Table 46: Western Europe Volume (Units) Forecast by Material, 2015 to 2033

Table 47: Western Europe Value (US$ million) Forecast by Application, 2015 to 2033

Table 48: Western Europe Volume (Units) Forecast by Application, 2015 to 2033

Table 49: Eastern Europe Value (US$ million) Forecast by Country, 2015 to 2033

Table 50: Eastern Europe Volume (Units) Forecast by Country, 2015 to 2033

Table 51: Eastern Europe Value (US$ million) Forecast by Pump Type, 2015 to 2033

Table 52: Eastern Europe Volume (Units) Forecast by Pump Type, 2015 to 2033

Table 53: Eastern Europe Value (US$ million) Forecast by Material, 2015 to 2033

Table 54: Eastern Europe Volume (Units) Forecast by Material, 2015 to 2033

Table 55: Eastern Europe Value (US$ million) Forecast by Application, 2015 to 2033

Table 56: Eastern Europe Volume (Units) Forecast by Application, 2015 to 2033

Table 57: Central Asia Value (US$ million) Forecast by Country, 2015 to 2033

Table 58: Central Asia Volume (Units) Forecast by Country, 2015 to 2033

Table 59: Central Asia Value (US$ million) Forecast by Pump Type, 2015 to 2033

Table 60: Central Asia Volume (Units) Forecast by Pump Type, 2015 to 2033

Table 61: Central Asia Value (US$ million) Forecast by Material, 2015 to 2033

Table 62: Central Asia Volume (Units) Forecast by Material, 2015 to 2033

Table 63: Central Asia Value (US$ million) Forecast by Application, 2015 to 2033

Table 64: Central Asia Volume (Units) Forecast by Application, 2015 to 2033

Table 65: Russia & Belarus Value (US$ million) Forecast by Country, 2015 to 2033

Table 66: Russia & Belarus Volume (Units) Forecast by Country, 2015 to 2033

Table 67: Russia & Belarus Value (US$ million) Forecast by Pump Type, 2015 to 2033

Table 68: Russia & Belarus Volume (Units) Forecast by Pump Type, 2015 to 2033

Table 69: Russia & Belarus Value (US$ million) Forecast by Material, 2015 to 2033

Table 70: Russia & Belarus Volume (Units) Forecast by Material, 2015 to 2033

Table 71: Russia & Belarus Value (US$ million) Forecast by Application, 2015 to 2033

Table 72: Russia & Belarus Volume (Units) Forecast by Application, 2015 to 2033

Table 73: Balkan Countries Value (US$ million) Forecast by Country, 2015 to 2033

Table 74: Balkan Countries Volume (Units) Forecast by Country, 2015 to 2033

Table 75: Balkan Countries Value (US$ million) Forecast by Pump Type, 2015 to 2033

Table 76: Balkan Countries Volume (Units) Forecast by Pump Type, 2015 to 2033

Table 77: Balkan Countries Value (US$ million) Forecast by Material, 2015 to 2033

Table 78: Balkan Countries Volume (Units) Forecast by Material, 2015 to 2033

Table 79: Balkan Countries Value (US$ million) Forecast by Application, 2015 to 2033

Table 80: Balkan Countries Volume (Units) Forecast by Application, 2015 to 2033

Table 81: Baltic Countries Value (US$ million) Forecast by Country, 2015 to 2033

Table 82: Baltic Countries Volume (Units) Forecast by Country, 2015 to 2033

Table 83: Baltic Countries Value (US$ million) Forecast by Pump Type, 2015 to 2033

Table 84: Baltic Countries Volume (Units) Forecast by Pump Type, 2015 to 2033

Table 85: Baltic Countries Value (US$ million) Forecast by Material, 2015 to 2033

Table 86: Baltic Countries Volume (Units) Forecast by Material, 2015 to 2033

Table 87: Baltic Countries Value (US$ million) Forecast by Application, 2015 to 2033

Table 88: Baltic Countries Volume (Units) Forecast by Application, 2015 to 2033

Table 89: Middle East and Africa Value (US$ million) Forecast by Country, 2015 to 2033

Table 90: Middle East and Africa Volume (Units) Forecast by Country, 2015 to 2033

Table 91: Middle East and Africa Value (US$ million) Forecast by Pump Type, 2015 to 2033

Table 92: Middle East and Africa Volume (Units) Forecast by Pump Type, 2015 to 2033

Table 93: Middle East and Africa Value (US$ million) Forecast by Material, 2015 to 2033

Table 94: Middle East and Africa Volume (Units) Forecast by Material, 2015 to 2033

Table 95: Middle East and Africa Value (US$ million) Forecast by Application, 2015 to 2033

Table 96: Middle East and Africa Volume (Units) Forecast by Application, 2015 to 2033

Table 97: USA Value (US$ million) Forecast by Pump Type, Packaging, and End-user (2023(E) & 2033(F))

Table 98: Canada Value (US$ million) Forecast by Pump Type, Packaging, and End-user (2023(E) & 2033(F))

Table 99: Brazil Value (US$ million) Forecast by Pump Type, Packaging, and End-user (2023(E) & 2033(F))

Table 100: Mexico Value (US$ million) Forecast by Pump Type, Packaging, and End-user (2023(E) & 2033(F))

Table 101: Germany Value (US$ million) Forecast by Pump Type, Packaging, and End-user (2023(E) & 2033(F))

Table 102: Italy Value (US$ million) Forecast by Pump Type, Packaging, and End-user (2023(E) & 2033(F))

Table 103: France Value (US$ million) Forecast by Pump Type, Packaging, and End-user (2023(E) & 2033(F))

Table 104: Spain Value (US$ million) Forecast by Pump Type, Packaging, and End-user (2023(E) & 2033(F))

Table 105: United Kingdom Value (US$ million) Forecast by Pump Type, Packaging, and End-user (2023(E) & 2033(F))

Table 106: China Value (US$ million) Forecast by Pump Type, Packaging, and End-user (2023(E) & 2033(F))

Table 107: Japan Value (US$ million) Forecast by Pump Type, Packaging, and End-user (2023(E) & 2033(F))

Table 108: India Value (US$ million) Forecast by Pump Type, Packaging, and End-user (2023(E) & 2033(F))

Table 109: Australia & New Zealand Value (US$ million) Forecast by Pump Type, Packaging, and End-user (2023(E) & 2033(F))

Table 110: Gulf Cooperation Council Countries Value (US$ million) Forecast by Pump Type, Packaging, and End-user (2023(E) & 2033(F))

Table 111: South Africa Value (US$ million) Forecast by Pump Type, Packaging, and End-user (2023(E) & 2033(F))

List of Figures

Figure 01: Global Value (US$ million) by Pump Type, 2023 to 2033

Figure 02: Global Value (US$ million) by Material, 2023 to 2033

Figure 03: Global Value (US$ million) by Application, 2023 to 2033

Figure 04: Global Value (US$ million) by Region, 2023 to 2033

Figure 05: Global Value (US$ million) Analysis by Region, 2015 to 2022

Figure 06: Global Volume (Units) Analysis by Region, 2015 to 2033

Figure 07: Global Value Share (%) and BPS Analysis by Region, 2023 & 2033

Figure 08: Global Y-o-Y Growth (%) Projections by Region, 2023 to 2033

Figure 09: Global Value (US$ million) Analysis by Pump Type, 2015 to 2022

Figure 10: Global Volume (Units) Analysis by Pump Type, 2015 to 2033

Figure 11: Global Value Share (%) and BPS Analysis by Pump Type, 2023 & 2033

Figure 12: Global Y-o-Y Growth (%) Projections by Pump Type, 2023 to 2033

Figure 13: Global Value (US$ million) Analysis by Material, 2015 to 2022

Figure 14: Global Volume (Units) Analysis by Material, 2015 to 2033

Figure 15: Global Value Share (%) and BPS Analysis by Material, 2023 & 2033

Figure 16: Global Y-o-Y Growth (%) Projections by Material, 2023 to 2033

Figure 17: Global Value (US$ million) Analysis by Application, 2015 to 2022

Figure 18: Global Volume (Units) Analysis by Application, 2015 to 2033

Figure 19: Global Value Share (%) and BPS Analysis by Application, 2023 & 2033

Figure 20: Global Y-o-Y Growth (%) Projections by Application, 2023 to 2033

Figure 21: Global Attractiveness by Pump Type, 2023 to 2033

Figure 22: Global Attractiveness by Material, 2023 to 2033

Figure 23: Global Attractiveness by Application, 2023 to 2033

Figure 24: Global Attractiveness by Application, 2023 to 2033

Figure 25: Global Attractiveness by Region, 2023 to 2033

Figure 26: North America Value (US$ million) by Pump Type, 2023 to 2033

Figure 27: North America Value (US$ million) by Material, 2023 to 2033

Figure 28: North America Value (US$ million) by Application, 2023 to 2033

Figure 29: North America Value (US$ million) by Country, 2023 to 2033

Figure 30: North America Value (US$ million) Analysis by Country, 2015 to 2022

Figure 31: North America Volume (Units) Analysis by Country, 2015 to 2033

Figure 32: North America Value Share (%) and BPS Analysis by Country, 2023 & 2033

Figure 33: North America Y-o-Y Growth (%) Projections by Country, 2023 to 2033

Figure 34: North America Value (US$ million) Analysis by Pump Type, 2015 to 2022

Figure 35: North America Volume (Units) Analysis by Pump Type, 2015 to 2033

Figure 36: North America Value Share (%) and BPS Analysis by Pump Type, 2023 & 2033

Figure 37: North America Y-o-Y Growth (%) Projections by Pump Type, 2023 to 2033

Figure 38: North America Value (US$ million) Analysis by Material, 2015 to 2022

Figure 39: North America Volume (Units) Analysis by Material, 2015 to 2033

Figure 40: North America Value Share (%) and BPS Analysis by Material, 2023 & 2033

Figure 41: North America Y-o-Y Growth (%) Projections by Material, 2023 to 2033

Figure 42: North America Value (US$ million) Analysis by Application, 2015 to 2022

Figure 43: North America Volume (Units) Analysis by Application, 2015 to 2033

Figure 44: North America Value Share (%) and BPS Analysis by Application, 2023 & 2033

Figure 45: North America Y-o-Y Growth (%) Projections by Application, 2023 to 2033

Figure 46: North America Attractiveness by Pump Type, 2023 to 2033

Figure 47: North America Attractiveness by Material, 2023 to 2033

Figure 48: North America Attractiveness by Application, 2023 to 2033

Figure 49: North America Attractiveness by Country, 2023 to 2033

Figure 50: Latin America Value (US$ million) by Pump Type, 2023 & 2033

Figure 51: Latin America Value (US$ million) by Pump Type, 2023 to 2033

Figure 52: Latin America Value (US$ million) by Application, 2023 to 2033

Figure 53: Latin America Value (US$ million) by Country, 2023 to 2033

Figure 54: Latin America Value (US$ million) Analysis by Country, 2015 to 2022

Figure 55: Latin America Volume (Units) Analysis by Country, 2015 to 2033

Figure 56: Latin America Value Share (%) and BPS Analysis by Country, 2023 & 2033

Figure 57: Latin America Y-o-Y Growth (%) Projections by Country, 2023 to 2033

Figure 58: Latin America Value (US$ million) Analysis by Pump Type, 2015 to 2022

Figure 59: Latin America Volume (Units) Analysis by Pump Type, 2015 to 2033

Figure 60: Latin America Value Share (%) and BPS Analysis by Pump Type, 2023 & 2033

Figure 61: Latin America Y-o-Y Growth (%) Projections by Pump Type, 2023 to 2033

Figure 62: Latin America Value (US$ million) Analysis by Pump Type, 2015 to 2022

Figure 63: Latin America Volume (Units) Analysis by Pump Type, 2015 to 2033

Figure 64: Latin America Value Share (%) and BPS Analysis by Pump Type, 2023 & 2033

Figure 65: Latin America Y-o-Y Growth (%) Projections by Pump Type, 2023 to 2033

Figure 66: Latin America Value (US$ million) Analysis by Application, 2015 to 2022

Figure 67: Latin America Volume (Units) Analysis by Application, 2015 to 2033

Figure 68: Latin America Value Share (%) and BPS Analysis by Application, 2023 & 2033

Figure 69: Latin America Y-o-Y Growth (%) Projections by Application, 2023 to 2033

Figure 70: Latin America Attractiveness by Pump Type, 2023 to 2033

Figure 71: Latin America Attractiveness by Pump Type, 2023 to 2033

Figure 72: Latin America Attractiveness by Application, 2023 to 2033

Figure 73: Latin America Attractiveness by Country, 2023 to 2033

Figure 74: East Asia Value (US$ million) by Pump Type, 2023 to 2033

Figure 75: East Asia Value (US$ million) by Pump Type, 2023 to 2033

Figure 76: East Asia Value (US$ million) by Application, 2023 to 2033

Figure 77: East Asia Value (US$ million) by Country, 2023 to 2033

Figure 78: East Asia Value (US$ million) Analysis by Country, 2015 to 2022

Figure 79: East Asia Volume (Units) Analysis by Country, 2015 to 2033

Figure 80: East Asia Value Share (%) and BPS Analysis by Country, 2023 & 2033

Figure 81: East Asia Y-o-Y Growth (%) Projections by Country, 2023 to 2033

Figure 82: East Asia Value (US$ million) Analysis by Pump Type, 2015 to 2022

Figure 83: East Asia Volume (Units) Analysis by Pump Type, 2015 to 2033

Figure 84: East Asia Value Share (%) and BPS Analysis by Pump Type, 2023 & 2033

Figure 85: East Asia Y-o-Y Growth (%) Projections by Pump Type, 2023 to 2033

Figure 86: East Asia Value (US$ million) Analysis by Pump Type, 2015 to 2022

Figure 87: East Asia Volume (Units) Analysis by Pump Type, 2015 to 2033

Figure 88: East Asia Value Share (%) and BPS Analysis by Pump Type, 2023 & 2033

Figure 89: East Asia Y-o-Y Growth (%) Projections by Pump Type, 2023 to 2033

Figure 90: East Asia Value (US$ million) Analysis by Application, 2015 to 2022

Figure 91: East Asia Volume (Units) Analysis by Application, 2015 to 2033

Figure 92: East Asia Value Share (%) and BPS Analysis by Application, 2023 & 2033

Figure 93: East Asia Y-o-Y Growth (%) Projections by Application, 2023 to 2033

Figure 94: East Asia Attractiveness by Pump Type, 2023 to 2033

Figure 95: East Asia Attractiveness by Pump Type, 2023 to 2033

Figure 96: East Asia Attractiveness by Application, 2023 to 2033

Figure 97: East Asia Attractiveness by Country, 2023 to 2033

Figure 98: South Asia & Pacific Value (US$ million) by Pump Type, 2023 to 2033

Figure 99: South Asia & Pacific Value (US$ million) by Material, 2023 to 2033

Figure 100: South Asia & Pacific Value (US$ million) by Application, 2023 to 2033

Figure 101: South Asia & Pacific Value (US$ million) by Country, 2023 to 2033

Figure 102: South Asia & Pacific Value (US$ million) Analysis by Country, 2015 to 2022

Figure 103: South Asia & Pacific Volume (Units) Analysis by Country, 2015 to 2033

Figure 104: South Asia & Pacific Value Share (%) and BPS Analysis by Country, 2023 & 2033

Figure 105: South Asia & Pacific Y-o-Y Growth (%) Projections by Country, 2023 to 2033

Figure 106: South Asia & Pacific Value (US$ million) Analysis by Pump Type, 2015 to 2022

Figure 107: South Asia & Pacific Volume (Units) Analysis by Pump Type, 2015 to 2033

Figure 108: South Asia & Pacific Value Share (%) and BPS Analysis by Pump Type, 2023 & 2033

Figure 109: South Asia & Pacific Y-o-Y Growth (%) Projections by Pump Type, 2023 to 2033

Figure 110: South Asia & Pacific Value (US$ million) Analysis by Material, 2015 to 2022

Figure 111: South Asia & Pacific Volume (Units) Analysis by Material, 2015 to 2033

Figure 112: South Asia & Pacific Value Share (%) and BPS Analysis by Material, 2023 & 2033

Figure 113: South Asia & Pacific Y-o-Y Growth (%) Projections by Material, 2023 to 2033

Figure 114: South Asia & Pacific Value (US$ million) Analysis by Application, 2015 to 2022

Figure 115: South Asia & Pacific Volume (Units) Analysis by Application, 2015 to 2033

Figure 116: South Asia & Pacific Value Share (%) and BPS Analysis by Application, 2023 & 2033

Figure 117: South Asia & Pacific Y-o-Y Growth (%) Projections by Application, 2023 to 2033

Figure 118: South Asia & Pacific Attractiveness by Pump Type, 2023 to 2033

Figure 119: South Asia & Pacific Attractiveness by Material, 2023 to 2033

Figure 120: South Asia & Pacific Attractiveness by Application, 2023 to 2033

Figure 121: South Asia & Pacific Attractiveness by Country, 2023 to 2033

Figure 123: Western Europe Value (US$ million) by Pump Type, 2023 to 2033

Figure 124: Western Europe Value (US$ million) by Pump Type, 2023 to 2033

Figure 125: Western Europe Value (US$ million) by Application, 2023 to 2033

Figure 126: Western Europe Value (US$ million) by Country, 2023 to 2033

Figure 127: Western Europe Value (US$ million) Analysis by Country, 2015 to 2022

Figure 128: Western Europe Volume (Units) Analysis by Country, 2015 to 2033

Figure 129: Western Europe Value Share (%) and BPS Analysis by Country, 2023 & 2033

Figure 130: Western Europe Y-o-Y Growth (%) Projections by Country, 2023 to 2033

Figure 131: Western Europe Value (US$ million) Analysis by Pump Type, 2015 to 2022

Figure 132: Western Europe Volume (Units) Analysis by Pump Type, 2015 to 2033

Figure 133: Western Europe Value Share (%) and BPS Analysis by Pump Type, 2023 & 2033

Figure 134: Western Europe Y-o-Y Growth (%) Projections by Pump Type, 2023 to 2033

Figure 135: Western Europe Value (US$ million) Analysis by Pump Type, 2015 to 2022

Figure 136: Western Europe Volume (Units) Analysis by Pump Type, 2015 to 2033

Figure 137: Western Europe Value Share (%) and BPS Analysis by Pump Type, 2023 & 2033

Figure 138: Western Europe Y-o-Y Growth (%) Projections by Pump Type, 2023 to 2033

Figure 139: Western Europe Value (US$ million) Analysis by Application, 2015 to 2022

Figure 140: Western Europe Volume (Units) Analysis by Application, 2015 to 2033

Figure 141: Western Europe Value Share (%) and BPS Analysis by Application, 2023 & 2033

Figure 142: Western Europe Y-o-Y Growth (%) Projections by Application, 2023 to 2033

Figure 143: Western Europe Attractiveness by Pump Type, 2023 to 2033

Figure 144: Western Europe Attractiveness by Pump Type, 2023 to 2033

Figure 145: Western Europe Attractiveness by Application, 2023 to 2033

Figure 146: Western Europe Attractiveness by Country, 2023 to 2033

Figure 147: Eastern Europe Value (US$ million) by Pump Type, 2023 to 2033

Figure 148: Eastern Europe Value (US$ million) by Pump Type, 2023 to 2033

Figure 149: Eastern Europe Value (US$ million) by Application, 2023 to 2033

Figure 150: Eastern Europe Value (US$ million) by Country, 2023 to 2033

Figure 151: Eastern Europe Value (US$ million) Analysis by Country, 2015 to 2022

Figure 152: Eastern Europe Volume (Units) Analysis by Country, 2015 to 2033

Figure 153: Eastern Europe Value Share (%) and BPS Analysis by Country, 2023 & 2033

Figure 154: Eastern Europe Y-o-Y Growth (%) Projections by Country, 2023 to 2033

Figure 155: Eastern Europe Value (US$ million) Analysis by Pump Type, 2015 to 2022

Figure 156: Eastern Europe Volume (Units) Analysis by Pump Type, 2015 to 2033

Figure 157: Eastern Europe Value Share (%) and BPS Analysis by Pump Type, 2023 & 2033

Figure 158: Eastern Europe Y-o-Y Growth (%) Projections by Pump Type, 2023 to 2033

Figure 159: Eastern Europe Value (US$ million) Analysis by Pump Type, 2015 to 2022

Figure 160: Eastern Europe Volume (Units) Analysis by Pump Type, 2015 to 2033

Figure 161: Eastern Europe Value Share (%) and BPS Analysis by Pump Type, 2023 & 2033

Figure 162: Eastern Europe Y-o-Y Growth (%) Projections by Pump Type, 2023 to 2033

Figure 163: Eastern Europe Value (US$ million) Analysis by Application, 2015 to 2022

Figure 164: Eastern Europe Volume (Units) Analysis by Application, 2015 to 2033

Figure 165: Eastern Europe Value Share (%) and BPS Analysis by Application, 2023 & 2033

Figure 166: Eastern Europe Y-o-Y Growth (%) Projections by Application, 2023 to 2033

Figure 167: Eastern Europe Attractiveness by Pump Type, 2023 to 2033

Figure 168: Eastern Europe Attractiveness by Pump Type, 2023 to 2033

Figure 169: Eastern Europe Attractiveness by Application, 2023 to 2033

Figure 170: Eastern Europe Attractiveness by Country, 2023 to 2033

Figure 171: Central Asia Value (US$ million) by Pump Type, 2023 to 2033

Figure 172: Central Asia Value (US$ million) by Pump Type, 2023 to 2033

Figure 173: Central Asia Value (US$ million) by Application, 2023 to 2033

Figure 174: Central Asia Value (US$ million) by Country, 2023 to 2033

Figure 175: Central Asia Value (US$ million) Analysis by Country, 2015 to 2022

Figure 176: Central Asia Volume (Units) Analysis by Country, 2015 to 2033

Figure 177: Central Asia Value Share (%) and BPS Analysis by Country, 2023 & 2033

Figure 178: Central Asia Y-o-Y Growth (%) Projections by Country, 2023 to 2033

Figure 179: Central Asia Value (US$ million) Analysis by Pump Type, 2015 to 2022

Figure 180: Central Asia Volume (Units) Analysis by Pump Type, 2015 to 2033

Figure 181: Central Asia Value Share (%) and BPS Analysis by Pump Type, 2023 & 2033

Figure 182: Central Asia Y-o-Y Growth (%) Projections by Pump Type, 2023 to 2033

Figure 183: Central Asia Value (US$ million) Analysis by Pump Type, 2015 to 2022

Figure 184: Central Asia Volume (Units) Analysis by Pump Type, 2015 to 2033

Figure 185: Central Asia Value Share (%) and BPS Analysis by Pump Type, 2023 & 2033

Figure 186: Central Asia Y-o-Y Growth (%) Projections by Pump Type, 2023 to 2033

Figure 187: Central Asia Value (US$ million) Analysis by Application, 2015 to 2022

Figure 188: Central Asia Volume (Units) Analysis by Application, 2015 to 2033

Figure 189: Central Asia Value Share (%) and BPS Analysis by Application, 2023 & 2033

Figure 190: Central Asia Y-o-Y Growth (%) Projections by Application, 2023 to 2033

Figure 191: Central Asia Attractiveness by Pump Type, 2023 to 2033

Figure 192: Central Asia Attractiveness by Pump Type, 2023 to 2033

Figure 193: Central Asia Attractiveness by Application, 2023 to 2033

Figure 194: Central Asia Attractiveness by Country, 2023 to 2033

Figure 195: Russia & Belarus Value (US$ million) by Pump Type, 2023 to 2033

Figure 196: Russia & Belarus Value (US$ million) by Pump Type, 2023 to 2033

Figure 197: Russia & Belarus Value (US$ million) by Application, 2023 to 2033

Figure 198: Russia & Belarus Value (US$ million) by Country, 2023 to 2033

Figure 199: Russia & Belarus Value (US$ million) Analysis by Country, 2015 to 2022

Figure 200: Russia & Belarus Volume (Units) Analysis by Country, 2015 to 2033

Figure 201: Russia & Belarus Value Share (%) and BPS Analysis by Country, 2023 & 2033

Figure 202: Russia & Belarus Y-o-Y Growth (%) Projections by Country, 2023 to 2033

Figure 203: Russia & Belarus Value (US$ million) Analysis by Pump Type, 2015 to 2022

Figure 204: Russia & Belarus Volume (Units) Analysis by Pump Type, 2015 to 2033

Figure 205: Russia & Belarus Value Share (%) and BPS Analysis by Pump Type, 2023 & 2033

Figure 206: Russia & Belarus Y-o-Y Growth (%) Projections by Pump Type, 2023 to 2033

Figure 207: Russia & Belarus Value (US$ million) Analysis by Pump Type, 2015 to 2022

Figure 208: Russia & Belarus Volume (Units) Analysis by Pump Type, 2015 to 2033

Figure 209: Russia & Belarus Value Share (%) and BPS Analysis by Pump Type, 2023 & 2033

Figure 210: Russia & Belarus Y-o-Y Growth (%) Projections by Pump Type, 2023 to 2033

Figure 211: Russia & Belarus Value (US$ million) Analysis by Application, 2015 to 2022

Figure 212: Russia & Belarus Volume (Units) Analysis by Application, 2015 to 2033

Figure 213: Russia & Belarus Value Share (%) and BPS Analysis by Application, 2023 & 2033

Figure 214: Russia & Belarus Y-o-Y Growth (%) Projections by Application, 2023 to 2033

Figure 215: Russia & Belarus Attractiveness by Pump Type, 2023 to 2033

Figure 216: Russia & Belarus Attractiveness by Pump Type, 2023 to 2033

Figure 217: Russia & Belarus Attractiveness by Application, 2023 to 2033

Figure 218: Russia & Belarus Attractiveness by Country, 2023 to 2033

Figure 219: Balkan Countries Value (US$ million) by Pump Type, 2023 to 2033

Figure 220: Balkan Countries Value (US$ million) by Pump Type, 2023 to 2033

Figure 221: Balkan Countries Value (US$ million) by Application, 2023 to 2033

Figure 222: Balkan Countries Value (US$ million) by Country, 2023 to 2033

Figure 223: Balkan Countries Value (US$ million) Analysis by Country, 2015 to 2022

Figure 224: Balkan Countries Volume (Units) Analysis by Country, 2015 to 2033

Figure 225: Balkan Countries Value Share (%) and BPS Analysis by Country, 2023 & 2033

Figure 226: Balkan Countries Y-o-Y Growth (%) Projections by Country, 2023 to 2033

Figure 227: Balkan Countries Value (US$ million) Analysis by Pump Type, 2015 to 2022

Figure 228: Balkan Countries Volume (Units) Analysis by Pump Type, 2015 to 2033

Figure 229: Balkan Countries Value Share (%) and BPS Analysis by Pump Type, 2023 & 2033

Figure 230: Balkan Countries Y-o-Y Growth (%) Projections by Pump Type, 2023 to 2033

Figure 231: Balkan Countries Value (US$ million) Analysis by Pump Type, 2015 to 2022

Figure 232: Balkan Countries Volume (Units) Analysis by Pump Type, 2015 to 2033

Figure 233: Balkan Countries Value Share (%) and BPS Analysis by Pump Type, 2023 & 2033

Figure 234: Balkan Countries Y-o-Y Growth (%) Projections by Pump Type, 2023 to 2033

Figure 235: Balkan Countries Value (US$ million) Analysis by Application, 2015 to 2022

Figure 236: Balkan Countries Volume (Units) Analysis by Application, 2015 to 2033

Figure 237: Balkan Countries Value Share (%) and BPS Analysis by Application, 2023 & 2033

Figure 238: Balkan Countries Y-o-Y Growth (%) Projections by Application, 2023 to 2033

Figure 239: Balkan Countries Attractiveness by Pump Type, 2023 to 2033

Figure 240: Balkan Countries Attractiveness by Pump Type, 2023 to 2033

Figure 241: Balkan Countries Attractiveness by Application, 2023 to 2033

Figure 242: Balkan Countries Attractiveness by Country, 2023 to 2033

Figure 243: Baltic Countries Value (US$ million) by Pump Type, 2023 to 2033

Figure 244: Baltic Countries Value (US$ million) by Pump Type, 2023 to 2033

Figure 245: Baltic Countries Value (US$ million) by Application, 2023 to 2033

Figure 246: Baltic Countries Value (US$ million) by Country, 2023 to 2033

Figure 247: Baltic Countries Value (US$ million) Analysis by Country, 2015 to 2022

Figure 248: Baltic Countries Volume (Units) Analysis by Country, 2015 to 2033

Figure 249: Baltic Countries Value Share (%) and BPS Analysis by Country, 2023 & 2033

Figure 250: Baltic Countries Y-o-Y Growth (%) Projections by Country, 2023 to 2033

Figure 251: Baltic Countries Value (US$ million) Analysis by Pump Type, 2015 to 2022

Figure 252: Baltic Countries Volume (Units) Analysis by Pump Type, 2015 to 2033

Figure 253: Baltic Countries Value Share (%) and BPS Analysis by Pump Type, 2023 & 2033

Figure 254: Baltic Countries Y-o-Y Growth (%) Projections by Pump Type, 2023 to 2033

Figure 255: Baltic Countries Value (US$ million) Analysis by Pump Type, 2015 to 2022

Figure 256: Baltic Countries Volume (Units) Analysis by Pump Type, 2015 to 2033

Figure 257: Baltic Countries Value Share (%) and BPS Analysis by Pump Type, 2023 & 2033

Figure 258: Baltic Countries Y-o-Y Growth (%) Projections by Pump Type, 2023 to 2033

Figure 259: Baltic Countries Value (US$ million) Analysis by Application, 2015 to 2022

Figure 260: Baltic Countries Volume (Units) Analysis by Application, 2015 to 2033

Figure 261: Baltic Countries Value Share (%) and BPS Analysis by Application, 2023 & 2033

Figure 262: Baltic Countries Y-o-Y Growth (%) Projections by Application, 2023 to 2033

Figure 263: Baltic Countries Attractiveness by Pump Type, 2023 to 2033

Figure 264: Baltic Countries Attractiveness by Pump Type, 2023 to 2033

Figure 265: Baltic Countries Attractiveness by Application, 2023 to 2033

Figure 266: Baltic Countries Attractiveness by Country, 2023 to 2033

Figure 267: Middle East and Africa Value (US$ million) by Pump Type, 2023 to 2033

Figure 268: Middle East and Africa Value (US$ million) by Material, 2023 to 2033

Figure 269: Middle East and Africa Value (US$ million) by Application, 2023 to 2033

Figure 270: Middle East and Africa Value (US$ million) by Country, 2023 to 2033

Figure 271: Middle East and Africa Value (US$ million) Analysis by Country, 2015 to 2022

Figure 272: Middle East and Africa Volume (Units) Analysis by Country, 2015 to 2033

Figure 273: Middle East and Africa Value Share (%) and BPS Analysis by Country, 2023 & 2033

Figure 274: Middle East and Africa Y-o-Y Growth (%) Projections by Country, 2023 to 2033

Figure 275: Middle East and Africa Value (US$ million) Analysis by Pump Type, 2015 to 2022

Figure 276: Middle East and Africa Volume (Units) Analysis by Pump Type, 2015 to 2033

Figure 277: Middle East and Africa Value Share (%) and BPS Analysis by Pump Type, 2023 & 2033

Figure 278: Middle East and Africa Y-o-Y Growth (%) Projections by Pump Type, 2023 to 2033

Figure 279: Middle East and Africa Value (US$ million) Analysis by Material, 2015 to 2022

Figure 280: Middle East and Africa Volume (Units) Analysis by Material, 2015 to 2033

Figure 281: Middle East and Africa Value Share (%) and BPS Analysis by Material, 2023 & 2033

Figure 282: Middle East and Africa Y-o-Y Growth (%) Projections by Material, 2023 to 2033

Figure 283: Middle East and Africa Value (US$ million) Analysis by Application, 2015 to 2022

Figure 284: Middle East and Africa Volume (Units) Analysis by Application, 2015 to 2033

Figure 285: Middle East and Africa Value Share (%) and BPS Analysis by Application, 2023 & 2033

Figure 286: Middle East and Africa Y-o-Y Growth (%) Projections by Application, 2023 to 2033

Figure 287: Middle East and Africa Attractiveness by Pump Type, 2023 to 2033

Figure 288: Middle East and Africa Attractiveness by Material, 2023 to 2033

Figure 289: Middle East and Africa Attractiveness by Application, 2023 to 2033

Figure 290: Middle East and Africa Attractiveness by Country, 2023 to 2033

Frequently Asked Questions

What is the future of foamer pump industry?

The foamer pump industry is projected to witness CAGR of 3.7% between 2025 and 2035.

What was the worth of the foamer pump industry in 2024?

The global foamer pump industry stood at USD 567.5 million in 2024.

What will the worth of global foamer pump industry by 2035 end?

Global foamer pump industry is anticipated to reach USD 872.3 million by 2035 end.

Which region to showcase the highest CAGR during forecast period?

South Asia & Pacific is set to record a CAGR of 5.6% in assessment period.

Who are the key players of global foamer pump industry?

The key players operating in the foamer pump industry are Silgan Dispensing Systems Corporation, Albéa S.A., Rieke Corporation and AptarGroup.

Explore Similar Insights

Future Market Insights

Foamer Pump Market