Pump & Dispenser Market
Market Insights on Pump & Dispenser covering sales outlook, demand forecast & up-to-date key trends
Pump & Dispenser Market By Product Type (Trigger Pumps, Lotion & Cream Pumps, Mist Spray Pump, Bottle Top, Crimp Dispenser, Burette, and Others), By Material Type (Plastic, Glass, Metal), By Application (Body Lotions, Hand Care Lotions, Reagents, Perfumes & Deodorants, Liquid Soap, Shampoos & Conditioners, and Others), End-use (Cosmetics & Personal Care, Homecare, Pharmaceutical, Chemicals & Fertilizers, Laboratories, Automotive, and Others) & Region for 2022 - 2030
Pump & Dispenser Market Outlook (2022-2030)
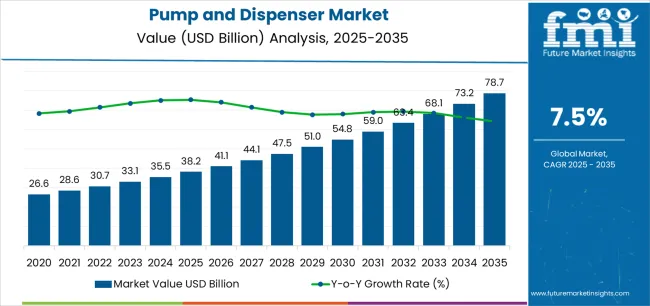
[193 Pages Report] The global pump & dispenser market is stipulated to grow on the linear grounds between 2022 and 2030, reaching US$ 12.4 Bn by the year 2030 at a CAGR of 4.3%.
Pump & Dispenser Market Size (2022) |
US$ 8.5 Bn |
Projected Market Value (2030) |
US$ 12.4 Bn |
Global Market Growth Rate (2022-2030) |
4.3% CAGR |
Collective Value Share: Top 5 Companies (2022E) |
13% |
The pump & dispenser market is likely record 4.8% growth between 2025 and 2026. Promising end users such as pharmaceutical, homecare, cosmetics & personal care, food & beverage are demanding new customized pumps & dispensers to experience high-end results in various applications.
Pumps & dispensers are being increasingly adopted in various other fields also due to their high end features such as being lightweight, easy-to-dispense, chemical resistant and likewise. Leading pumps & dispensers manufacturers are introducing more sustainable products made from bioplastic and 100% recycled contents for their eco-conscious consumers.
Let us know your requirement to get
100% FREE customization
How The Market Progressed Till June 2022?
Particulars |
Details |
H1 2021 |
0.6% |
H1 2022 Projected |
4.3% |
H1 2022 Expected |
4.5% |
BPS Change - H1, 2022 (O) – H1, 2022 (P) |
(+) 20 ↑ |
BPS Change – H1, 2022 (O) – H1, 2021 |
(+) 390 ↑ |
Future Market Insights predict a comparison and review analysis of the dynamics of the pump & dispenser market, which is principally subjected to an array of industry factors along with a few definite influences regarding fluctuating raw material prices of polypropylene (PP) and high-density polyethylene (HDPE) is expected to limit the market growth.
Some new developments that have taken place in the market include the use of airless pump which has a significant dispensing option. In April 2022, Novvia Group acquired Southern Container, LLC a distributor packaging products.
The market for pumps & dispensers is expected to surge by 390 basis share points (BPS) in H1-2022 (O) against comparison with H1-2021, according to an FMI analysis. However, when comparing the H1-2022 projected and H1-2022 outlook period, a rise in BPS change by 20 BPS has been noticed. The reason for this growth change is due to their high-end features such as being lightweight, chemical resistant and easy-to-dispense.
Despite these possibilities, a variety of end-use industries including the cosmetic, homecare, and pharmaceutical sectors, have multiple uses for liquid dispensing pumps that supports market growth.
Pump & Dispenser Demand Analysis (2015 To 2021) Vs Market Outlook (2022 To 2030)
Trigger pumps have been identified as the most prominently used product. They are light-weight, child safe and easy to use, which allows for different commercial and household liquids to be used economically. Besides, consistent demand for pump & dispenser from cosmetics & personal care industries uplifts market growth.
Europe is projected to hold approximately 33% of the global pump & dispenser market value share in 2022 due to presence of top operating players of pumps & dispensers in the region.
What’s With Cosmetics And Perfumes Packaging Sector?
“Smart Packaging Gaining Popularity”
Luxury packaging of beauty cosmetics and the other products such as perfumes always gains attention of the customers and results in impulsive purchase of the product. Thus, manufacturers of cosmetics and perfumes are mostly focused on ensuring premium quality packaging of their products. This type of packaging usually includes silk, leather, canvas or wood that enhances buyers’ satisfaction and repurchasing of the product.
The global market for luxury packaging for cosmetics and perfumes grew with the peak y-o-y of 9.5% during 2020-21. This has significant impact on the sales of smart pump and dispensers for ensuring quality packaging by presenting luxury cosmetic packaging effects for pump & dispenser, such as matte varnishes, glitter coatings, pearlescent coatings, metallic sheens, and soft touch. Key players are aiming to escalate their product lines.
Attributing to this, the profit gaining margin of pump and dispenser manufacturers is expected to increase in the years to come.
Find your sweet spots for generating winning opportunities in this market.
Talk to AnalystDevelopments To Take Shape Based On
“Need for Better Dispensing System changing the course”
In the packaging market, the adoption of pump & dispenser is rapidly increasing, attributing to better and more cost-effective dispensing system for liquid cosmetics and personal care items. Pump & dispenser are gaining more attention among manufacturers due to minimal production cost and greater profit margins.
Flourishing e-commerce platforms and online shopping are further boosting sales of pump & dispenser. Besides, advancements in printing technology and product innovations for improving the aesthetic appeal of the product are anticipated to increase the demand for pump and dispenser in the foreseeable future. Additionally, eco-friendly materials used for manufacturing pump and dispensers are grabbing more attention of the customers.
Limited Applications Of Pump And Dispenser?
“Improper Composition to act as a Restraint”
Pump & dispenser used in sprayers are suitable for dispensing deodorants, perfume, fertilizer, pesticides, and room fresheners.
While different types of pump & dispenser such as trigger sprayers and fingertip sprayers are available in the market, these have a limited number of applications as such systems cannot be used to dispense viscous or semi-liquid products. Moreover, while spraying chemicals such as fertilizers and pesticides, pump & dispenser sometimes face problems related to improper mixing of chemicals and diluted liquid gets sprayed as a result.

A unified Market Research Subscription Platform, built for today's disparate research needs.
How Has Covid-19 Impacted The Pumps And Dispenser Market?
“COVID-19 brings Increased Visibility for Pump and Dispenser”
COVID-19 had disrupted the worldwide manufacturing supply chain between March 2020 and Sep 2021, thereby affecting the packaging industry as well. The market was severely affected by the discontinuation of production in multiple regions such as North America, Europe, and Asia, which have been responsible for the significant use of pump and dispenser.
The automotive and construction industries were among the hardest hit industries, as individuals showed less interest in investing in new cars or homes, rather than buying more than ever essential medical needs.
Manufacturers are seeing strong consumer demands for sanitizers, liquid soap, and the other products where heavy volumes of pump & dispenser are used for dispensing applications. So, the upcoming period could bring wonderful opportunities for pump and dispenser manufacturers.
Category-Wise Insights
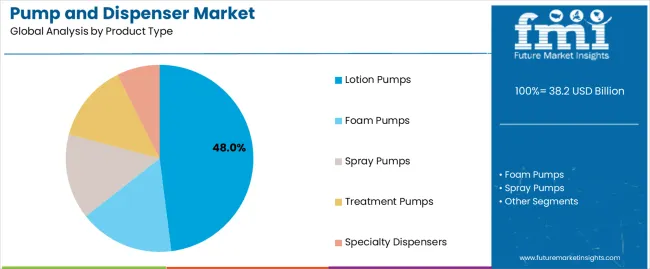
By type of product, out of trigger pumps, lotion & cream pumps, mist spray pumps, bottle top, crimp dispenser, burette, and others, trigger pumps do lead at present, but are expected to be taken over by mist spray pumps in the near future. This could be attributed to increasing applications with regards to offering leak-proof packaging solutions.
By material, out of plastic, metal, and glass, plastic is leading right now, but will be certainly taken over by glass or metal in the near future considering the concerns regarding environment. Application-wise, liquid soap triggers the demand for pump & dispenser. Growing awareness towards hygiene, especially in between Covid-19 and thereafter is responsible for this market share.
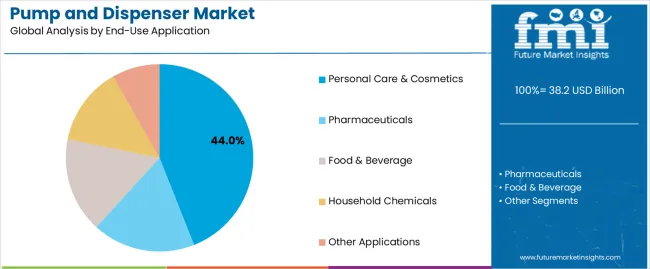
The otyher applications are body lotions, hand care lotions, reagents, perfumes & deodrants, shampoos & conditioners, and likewise. By end-use, cosmetics and personal care rule the roost with an ever-increasinf demand for various beauty products. The other end-users are homecare, pharmaceuticals, chemicals & fertilizers, laboratories, automotive, and likewise.
In the global pump & dispenser market, trigger pumps are expected to lose market share only by 10 BPS of current market share as they are already at the matured side of the market. However, nearly 21% of the pump & dispenser market share is already captured by the trigger pumps segment. This is attributable to the robust demand for liquid soap applications in the different industries where trigger pumps are highly used.
Future Market Insights analysts indicate that, mist spray pump segment is estimated to grab whopping 390 BPS of current market share, by the end of 2030. This is mainly due to vigorous use of mist spray pumps in the pharmaceutical, homecare, cosmetics & personal care, automotive and others industries.
Region-Wise Insights
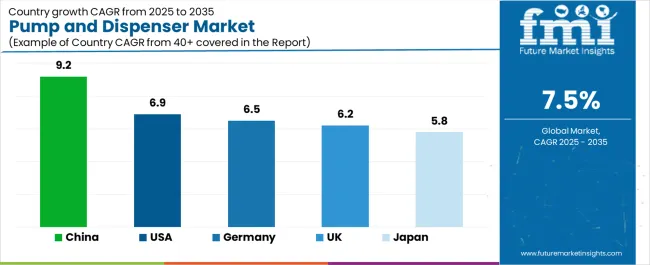
North America, followed by Europe and the Asian subcontinent are expected to drive the pump & dispenser market. Coming to cleanliness, even LATAM and MEA are not behind. On the whole, the entire world would be vying for pump & dispenser in the forecast period.
Competitive Landscape
The global pump & dispenser market has key manufacturers focusing on providing customized solutions. The leading manufacturers operating in the global pump & dispenser market are focusing on maximizing production volume, expanding their reach globally, and providing sustainable pump & dispenser solutions.
- Aptar, in March 2020, came up with the very first certified recycled plastic beauty packaging approved by ISCC (International Sustainability and Carbon Certification).
- Aptar, in the year 2019, entered into partnership with MONAT for producing an exclusive dispensing of Studio One Strong Flexi-Hold Hairspray. It was also the recipient of 2019 ADF Innovation Award.
Pump & Dispenser Industry Report Scope
Attribute |
Details |
Forecast Period |
2022-2030 |
Historical Data Available for |
2015-2021 |
Market Analysis |
US$ Mn/Bn for Value |
Key Regions Covered |
North America, Latin America, Europe, South Asia, East Asia, Oceania, and the Middle East & Africa |
Key Countries Covered |
U.S., Canada, Brazil, Mexico, Germany, U.K., France, Italy, Spain, Benelux, Russia, China, Japan, South Korea, India, Thailand, Indonesia, Malaysia, Singapore, China, Japan, South Korea, Australia, New Zealand, Turkey, Egypt, North Africa, South Africa, and GCC Countries |
Key Market Segments Covered |
Product Type, Material Type, Application, End-user, and Region |
Key Companies Profiled |
|
Pricing |
Available upon Request |
Key Segments Covered In Pump & Dispenser Industry Research
By Product Type :
- Trigger Pumps
- Lotion & Cream Pumps
- Mist Spray Pump
- Bottle Top
- Crimp Dispenser
- Burette
- Others
By Material Type :
- Plastic
- Polyethylene (PE)
- High – Density Polyethylene (HDPE)
- Low – Density Polyethylene (LDPE)
- Polyethylene Terephthalate (PET)
- Polyvinyl Chloride (PVC)
- Polypropylene (PP)
- Others
- Polyethylene (PE)
- Metal
- Glass
By Application :
- Body Lotions
- Hand Care Lotions
- Reagents
- Perfumes & Deodorants
- Liquid Soap
- Shampoos & Conditioners
- Others
By End-use :
- Cosmetics & Personal Care
- Homecare
- Pharmaceutical
- Chemicals & Fertilizers
- Laboratories
- Automotive
- Others
By Region :
- North America Pump & Dispenser Market
- Latin America Pump & Dispenser Market
- Europe Pump & Dispenser Market
- East Asia Pump & Dispenser Market
- South Asia Pump & Dispenser Market
- Oceania Pump & Dispenser Market
- Middle East & Africa (MEA) Pump & Dispenser Market
Frequently Asked Questions
How much is the Pump & Dispenser market currently worth?
The global Pump & Dispenser market is expected to be worth US$ 8.5 Bn in the year 2022.
What is the sales forecast for Pump & Dispenser through 2030?
The market for Pump & Dispenser is expected to reach US$ 12.4 Bn by 2030, expanding at a CAGR of 4.3%.
What is the share of top 5 companies?
The top 5 companies hold 13% of the market share.
Who are the key manufacturing companies for Pump & Dispenser?
Aptar Group, Inc., Rieke Corporation, C.L. Smith Company, DARIN CO.,Ltd., Richmond Containers CTP Ltd., TAPLAST S.r.l., Frapak Packaging B.V., RAEPAK Ltd., PKP Plastic Products Inc., UNICOM International Ltd., Weltrade Pty Ltd., TYH Container Enterprise Co., Ltd., Zhejiang Sun-Rain Industrial Co., Ltd., ScopeNEXT Ltd.
What’s with “North America”?
North America holds 19% of the market share.
Table of Content
1. Executive Summary 1.1. Global Market Outlook 1.2. Demand Side Trends 1.3. Supply Side Trends 1.4. Analysis and Recommendations 2. Market Overview 2.1. Market Coverage 2.2. Market Definition 3. Key Market Trends 3.1. Key Trends Impacting the Market 3.2. Product Innovation 4. Key Success Factors 4.1. Product Adoption 4.2. Product USPs 5. Global Pump & Dispenser Market Demand Analysis 2015-2021 and Forecast, 2022-2030 5.1. Historical Market Volume (Units) & Value (US$ Mn) Analysis, 2015-2021 5.2. Current and Future Market Volume (Units) & Value (US$ Mn) Projections, 2022-2030 5.2.1. Y-o-Y Growth Trend Analysis 5.2.2. Absolute $ Opportunity Analysis 6. Global Pump & Dispenser Market - Pricing Analysis 6.1. Regional Pricing Analysis By Product Type 6.2. Pricing Break-up 6.3. Global Average Pricing Analysis Benchmark 7. Market Background 7.1. Macro-Economic Factors 7.1.1. Global GDP Growth 7.1.2. Rigid Packaging Market Growth 7.1.3. Pharmaceutical Industry Growth 7.1.4. Cosmetic Industry Growth 7.1.5. Industrial Sector Growth 7.2. Forecast Factors - Relevance & Impact 7.2.1. Global Packaging Industry Growth 7.2.2. Global Rigid Packaging Market Growth 7.2.3. Global Cosmetics Industry Growth 7.2.4. Global Pharmaceutical Packaging Market 7.2.5. Global Cosmetic Packaging Market Growth 7.2.6. Historic Revenue Growth of Key Players 7.3. Value Chain 7.3.1. Key Participants 7.3.1.1. Raw Material Suppliers 7.3.1.2. Pump & Dispenser Manufacturers 7.3.1.3. End Users 7.3.2. Profitability Margin 7.4. Market Dynamics 7.4.1. Drivers 7.4.2. Restraints 7.4.3. Opportunity Analysis 8. Impact of COVID-19 8.1. Current Statistics and Probable Future Impact 8.2. Current Economic Projection – GDP/GVA and Probable Impact 8.3. Comparison of SAARs and Market Recovery, for Key Countries 8.4. Comparison to 2008 Financial Crisis and Market Recovery, for Key Countries 8.5. Impact of COVID-19 on Pump & Dispenser Market 9. Global Pump & Dispenser Market Analysis 2015-2021 and Forecast 2022-2030, by Product Type 9.1. Introduction 9.2. Historical Market Size (US$ Mn) and Volume (Units) Analysis By Product Type, 2015-2021 9.3. Current and Future Market Size (US$ Mn) and Volume (Units) Analysis and Forecast By Product Type, 2022-2030 9.3.1. Trigger Pumps 9.3.2. Lotion & Cream Pumps 9.3.3. Mist Spray Pump 9.3.4. Bottle Top 9.3.5. Crimp Dispenser 9.3.6. Burette 9.3.7. Others 9.4. Market Attractiveness Analysis By Product Type 10. Global Pump & Dispenser Market Analysis 2015-2021 and Forecast 2022-2030, by Material Type 10.1. Introduction 10.2. Historical Market Size (US$ Mn) and Volume (Units) Analysis Material Type, 2015-2021 10.3. Current and Future Market Size (US$ Mn) and Volume (Units) Analysis and Forecast By Material Type, 2022-2030 10.3.1. Plastic 10.3.1.1. Polyethylene (PE) 10.3.1.1.1. High - Density Polyethylene (HDPE) 10.3.1.1.2. Low - Density Polyethylene (LDPE) 10.3.1.2. Polyethylene Terephthalate (PET) 10.3.1.3. Polyvinyl Chloride (PVC) 10.3.1.4. Polypropylene (PP) 10.3.1.5. Others 10.3.2. Metal 10.3.3. Glass 10.4. Market Attractiveness Analysis By Material Type 11. Global Pump & Dispenser Market Analysis 2015-2021 and Forecast 2022-2030, by Application 11.1. Introduction 11.2. Historical Market Size (US$ Mn) and Volume (Units) Analysis Application, 2015-2021 11.3. Current and Future Market Size (US$ Mn) and Volume (Units) Analysis and Forecast By Application, 2022-2030 11.3.1. Body Lotions 11.3.2. Hand Care Lotions 11.3.3. Reagents 11.3.4. Perfumes & Deodorants 11.3.5. Liquid Soap 11.3.6. Shampoos & Conditioners 11.3.7. Others 11.4. Market Attractiveness Analysis By Application 12. Global Pump & Dispenser Market Analysis 2015-2021 and Forecast 2022-2030, by End Use 12.1. Introduction 12.2. Historical Market Size (US$ Mn) and Volume (Units) Analysis By End Use, 2015-2021 12.3. Current and Future Market Size (US$ Mn) and Volume (Units) Analysis and Forecast By End Use, 2022-2030 12.3.1. Cosmetics & Personal Care 12.3.2. Homecare 12.3.3. Pharmaceutical 12.3.4. Chemicals & Fertilizers 12.3.5. Laboratories 12.3.6. Automotive 12.3.7. Others 12.4. Market Attractiveness Analysis By End Use 13. Global Pump & Dispenser Market Analysis 2015-2021 and Forecast 2022-2030, by Region 13.1. Introduction 13.2. Historical Market Size (US$ Mn) and Volume (Units) Analysis By Region, 2015-2021 13.3. Current Market Size (US$ Mn) and Volume (Units) Analysis and Forecast By Region, 2022-2030 13.3.1. North America 13.3.2. Latin America 13.3.3. Europe 13.3.4. Middle East and Africa (MEA) 13.3.5. East Asia 13.3.6. South Asia 13.3.7. Oceania 13.3.8. Emerging Countries 13.4. Market Attractiveness Analysis By Region 14. North America Pump & Dispenser Market Analysis 2015-2021 and Forecast 2022-2030 14.1. Introduction 14.2. Pricing Analysis 14.3. Historical Market Size (US$ Mn) and Volume (Units) Trend Analysis By Market Taxonomy, 2015-2021 14.4. Market Size (US$ Mn) and Volume (Units) Forecast By Market Taxonomy, 2022-2030 14.4.1. By Country 14.4.1.1. U.S. 14.4.1.2. Canada 14.4.2. By Product Type 14.4.3. By Material Type 14.4.4. By Application 14.4.5. By End Use 14.5. Market Attractiveness Analysis 14.5.1. By Country 14.5.2. By Product Type 14.5.3. By Material Type 14.5.4. By Application 14.5.5. By End Use 14.6. Market Trends 14.7. Key Market Participants - Intensity Mapping 14.8. Drivers and Restraints - Impact Analysis 15. Latin America Pump & Dispenser Market Analysis 2015-2021 and Forecast 2022-2030 15.1. Introduction 15.2. Pricing Analysis 15.3. Historical Market Size (US$ Mn) and Volume (Units) Trend Analysis By Market Taxonomy, 2015-2021 15.4. Market Size (US$ Mn) and Volume (Units) Forecast By Market Taxonomy, 2022-2030 15.4.1. By Country 15.4.1.1. Brazil 15.4.1.2. Mexico 15.4.1.3. Argentina 15.4.1.4. Rest of Latin America 15.4.2. By Product Type 15.4.3. By Material Type 15.4.4. By Application 15.4.5. By End Use 15.5. By End Use Market Attractiveness Analysis 15.5.1. By Country 15.5.2. By Product Type 15.5.3. By Material Type 15.5.4. By Application 15.5.5. By End Use 15.6. Market Trends 15.7. Key Market Participants - Intensity Mapping 15.8. Drivers and Restraints - Impact Analysis 16. Europe Pump & Dispenser Market Analysis 2015-2021 and Forecast 2022-2030 16.1. Introduction 16.2. Pricing Analysis 16.3. Historical Market Size (US$ Mn) and Volume (Units) Trend Analysis By Market Taxonomy, 2015-2021 16.4. Market Size (US$ Mn) and Volume (Units) Forecast By Market Taxonomy, 2022-2030 16.4.1. By Country 16.4.1.1. Germany 16.4.1.2. Italy 16.4.1.3. France 16.4.1.4. U.K. 16.4.1.5. Spain 16.4.1.6. BENELUX 16.4.1.7. Russia 16.4.1.8. Rest of Europe 16.4.2. By Product Type 16.4.3. By Material Type 16.4.4. By Application 16.4.5. By End Use 16.5. Market Attractiveness Analysis 16.5.1. By Country 16.5.2. By Product Type 16.5.3. By Material Type 16.5.4. By Application 16.5.5. By End Use 16.6. Market Trends 16.7. Key Market Participants - Intensity Mapping 16.8. Drivers and Restraints - Impact Analysis 17. Middle East & Africa Pump & Dispenser Market Analysis 2015-2021 and Forecast 2022-2030 17.1. Introduction 17.2. Pricing Analysis 17.3. Historical Market Size (US$ Mn) and Volume (Units) Trend Analysis By Market Taxonomy, 2015-2021 17.4. Market Size (US$ Mn) and Volume (Units) Forecast By Market Taxonomy, 2022-2030 17.4.1. By Country 17.4.1.1. GCC Countries 17.4.1.2. Turkey 17.4.1.3. Northern Africa 17.4.1.4. South Africa 17.4.1.5. Rest of Middle East and Africa 17.4.2. By Product Type 17.4.3. By Material Type 17.4.4. By Application 17.4.5. By End Use 17.5. Market Attractiveness Analysis 17.5.1. By Country 17.5.2. By Product Type 17.5.3. By Material Type 17.5.4. By Application 17.5.5. By End Use 17.6. Market Trends 17.7. Key Market Participants - Intensity Mapping 17.8. Drivers and Restraints - Impact Analysis 18. East Asia Pump & Dispenser Market Analysis 2015-2021 and Forecast 2022-2030 18.1. Introduction 18.2. Pricing Analysis 18.3. Historical Market Size (US$ Mn) and Volume (Units) Trend Analysis By Market Taxonomy, 2015-2021 18.4. Market Size (US$ Mn) and Volume (Units) Forecast By Market Taxonomy, 2022-2030 18.4.1. By Country 18.4.1.1. China 18.4.1.2. Japan 18.4.1.3. South Korea 18.4.2. By Product Type 18.4.3. By Material Type 18.4.4. By Application 18.4.5. By End Use 18.5. Market Attractiveness Analysis 18.5.1. By Country 18.5.2. By Product Type 18.5.3. By Material Type 18.5.4. By Application 18.5.5. By End Use 18.6. Market Trends 18.7. Key Market Participants - Intensity Mapping 18.8. Drivers and Restraints - Impact Analysis 19. South Asia Pump & Dispenser Market Analysis 2015-2021 and Forecast 2022-2030 19.1. Introduction 19.2. Pricing Analysis 19.3. Historical Market Size (US$ Mn) and Volume (Units) Trend Analysis By Market Taxonomy, 2015-2021 19.4. Market Size (US$ Mn) and Volume (Units) Forecast By Market Taxonomy, 2022-2030 19.4.1. By Country 19.4.1.1. India 19.4.1.2. Thailand 19.4.1.3. Indonesia 19.4.1.4. Malaysia 19.4.1.5. Rest of South Asia 19.4.2. By Product Type 19.4.3. By Material Type 19.4.4. By Application 19.4.5. By End Use 19.5. Market Attractiveness Analysis 19.5.1. By Country 19.5.2. By Product Type 19.5.3. By Material Type 19.5.4. By Application 19.5.5. By End Use 19.6. Market Trends 19.7. Key Market Participants - Intensity Mapping 19.8. Drivers and Restraints - Impact Analysis 20. Oceania Pump & Dispenser Market Analysis 2015-2021 and Forecast 2022-2030 20.1. Introduction 20.2. Pricing Analysis 20.3. Historical Market Size (US$ Mn) and Volume (Units) Trend Analysis By Market Taxonomy, 2015-2021 20.4. Market Size (US$ Mn) and Volume (Units) Forecast By Market Taxonomy, 2022-2030 20.4.1. By Country 20.4.1.1. Australia 20.4.1.2. New Zealand 20.4.2. By Product Type 20.4.3. By Material Type 20.4.4. By Application 20.4.5. By End Use 20.5. Market Attractiveness Analysis 20.5.1. By Country 20.5.2. By Product Type 20.5.3. By Material Type 20.5.4. By Application 20.5.5. By End Use 20.6. Market Trends 20.7. Key Market Participants - Intensity Mapping 20.8. Drivers and Restraints - Impact Analysis 21. Pump & Dispenser Market Country wise Analysis 2022 & 2030 21.1. US Pump & Dispenser Market Analysis 21.1.1. Market Volume (Units) and Value (US$ Mn) Analysis and Forecast, by Market Taxonomy 21.1.1.1. By Product Type 21.1.1.2. By Material Type 21.1.1.3. By Application 21.1.1.4. By End Use 21.2. Canada Pump & Dispenser Market Analysis 21.2.1. Market Volume (Units) and Value (US$ Mn) Analysis and Forecast, by Market Taxonomy 21.2.1.1. By Product Type 21.2.1.2. By Material Type 21.2.1.3. By Application 21.2.1.4. By End Use 21.3. Brazil Pump & Dispenser Market Analysis 21.3.1. Market Volume (Units) and Value (US$ Mn) Analysis and Forecast, by Market Taxonomy 21.3.1.1. By Product Type 21.3.1.2. By Material Type 21.3.1.3. By Application 21.3.1.4. By End Use 21.4. Mexico Pump & Dispenser Market Analysis 21.4.1. Market Volume (Units) and Value (US$ Mn) Analysis and Forecast, by Market Taxonomy 21.4.1.1. By Product Type 21.4.1.2. By Material Type 21.4.1.3. By Application 21.4.1.4. By End Use 21.5. Germany Pump & Dispenser Market Analysis 21.5.1. Market Volume (Units) and Value (US$ Mn) Analysis and Forecast, by Market Taxonomy 21.5.1.1. By Product Type 21.5.1.2. By Material Type 21.5.1.3. By Application 21.5.1.4. By End Use 21.6. Italy Pump & Dispenser Market Analysis 21.6.1. Market Volume (Units) and Value (US$ Mn) Analysis and Forecast, by Market Taxonomy 21.6.1.1. By Product Type 21.6.1.2. By Material Type 21.6.1.3. By Application 21.6.1.4. By End Use 21.7. France Pump & Dispenser Market Analysis 21.7.1. Market Volume (Units) and Value (US$ Mn) Analysis and Forecast, by Market Taxonomy 21.7.1.1. By Product Type 21.7.1.2. By Material Type 21.7.1.3. By Application 21.7.1.4. By End Use 21.8. U.K. Pump & Dispenser Market Analysis 21.8.1. Market Volume (Units) and Value (US$ Mn) Analysis and Forecast, by Market Taxonomy 21.8.1.1. By Product Type 21.8.1.2. By Material Type 21.8.1.3. By Application 21.8.1.4. By End Use 21.9. Spain Pump & Dispenser Market Analysis 21.9.1. Market Volume (Units) and Value (US$ Mn) Analysis and Forecast, by Market Taxonomy 21.9.1.1. By Product Type 21.9.1.2. By Material Type 21.9.1.3. By Application 21.9.1.4. By End Use 21.10. Russia Pump & Dispenser Market Analysis 21.10.1. Market Volume (Units) and Value (US$ Mn) Analysis and Forecast, by Market Taxonomy 21.10.1.1. By Product Type 21.10.1.2. By Material Type 21.10.1.3. By Application 21.10.1.4. By End Use 21.11. Poland Pump & Dispenser Market Analysis 21.11.1. Market Volume (Units) and Value (US$ Mn) Analysis and Forecast, by Market Taxonomy 21.11.1.1. By Product Type 21.11.1.2. By Material Type 21.11.1.3. By Application 21.11.1.4. By End Use 21.12. Turkey Pump & Dispenser Market Analysis 21.12.1. Market Volume (Units) and Value (US$ Mn) Analysis and Forecast, by Market Taxonomy 21.12.1.1. By Product Type 21.12.1.2. By Material Type 21.12.1.3. By Application 21.12.1.4. By End Use 21.13. South Africa Pump & Dispenser Market Analysis 21.13.1. Market Volume (Units) and Value (US$ Mn) Analysis and Forecast, by Market Taxonomy 21.13.1.1. By Product Type 21.13.1.2. By Material Type 21.13.1.3. By Application 21.13.1.4. By End Use 21.14. GCC Countries Pump & Dispenser Market Analysis 21.14.1. Market Volume (Units) and Value (US$ Mn) Analysis and Forecast, by Market Taxonomy 21.14.1.1. By Product Type 21.14.1.2. By Material Type 21.14.1.3. By Application 21.14.1.4. By End Use 21.15. Japan Pump & Dispenser Market Analysis 21.15.1. Market Volume (Units) and Value (US$ Mn) Analysis and Forecast, by Market Taxonomy 21.15.1.1. By Product Type 21.15.1.2. By Material Type 21.15.1.3. By Application 21.15.1.4. By End Use 21.16. South Korea Pump & Dispenser Market Analysis 21.16.1. Market Volume (Units) and Value (US$ Mn) Analysis and Forecast, by Market Taxonomy 21.16.1.1. By Machine Type 21.16.1.2. By End Use Industry 21.17. India Pump & Dispenser Market Analysis 21.17.1. Market Volume (Units) and Value (US$ Mn) Analysis and Forecast, by Market Taxonomy 21.17.1.1. By Product Type 21.17.1.2. By Material Type 21.17.1.3. By Application 21.17.1.4. By End Use 21.18. China Pump & Dispenser Market Analysis 21.18.1. Market Volume (Units) and Value (US$ Mn) Analysis and Forecast, by Market Taxonomy 21.18.1.1. By Product Type 21.18.1.2. By Material Type 21.18.1.3. By Application 21.18.1.4. By End Use 21.19. Australia Pump & Dispenser Market Analysis 21.19.1. Market Volume (Units) and Value (US$ Mn) Analysis and Forecast, by Market Taxonomy 21.19.1.1. By Product Type 21.19.1.2. By Material Type 21.19.1.3. By Application 21.19.1.4. By End Use 21.20. New Zealand Pump & Dispenser Market Analysis 21.20.1. Market Volume (Units) and Value (US$ Mn) Analysis and Forecast, by Market Taxonomy 21.20.1.1. By Product Type 21.20.1.2. By Material Type 21.20.1.3. By Application 21.20.1.4. By End Use 22. Market Structure Analysis 22.1. Market Analysis by Tier of Pump & Dispenser Companies 22.2. Market Share Analysis of Top Players 22.3. Market Presence Analysis 22.3.1. By Regional footprint of Players 22.3.2. Product foot print by Players 22.3.3. Channel Foot Print by Players 23. Competition Analysis 23.1. Competition Dashboard 23.2. Competition Benchmarking 23.3. Competition Deep Dive 23.3.1. Silgan Holdings Inc. 23.3.1.1. Overview 23.3.1.2. Product Portfolio 23.3.1.3. Profitability by Market Segments 23.3.1.4. Sales Footprint 23.3.1.5. Strategy Overview 23.3.1.5.1. Marketing Strategy 23.3.1.5.2. Product Strategy 23.3.1.5.3. Channel Strategy 23.3.2. Aptar Group, Inc. 23.3.2.1. Overview 23.3.2.2. Product Portfolio 23.3.2.3. Profitability by Market Segments 23.3.2.4. Sales Footprint 23.3.2.5. Strategy Overview 23.3.2.5.1. Marketing Strategy 23.3.2.5.2. Product Strategy 23.3.2.5.3. Channel Strategy 23.3.3. Rieke Corporation 23.3.3.1. Overview 23.3.3.2. Product Portfolio 23.3.3.3. Profitability by Market Segments 23.3.3.4. Sales Footprint 23.3.3.5. Strategy Overview 23.3.3.5.1. Marketing Strategy 23.3.3.5.2. Product Strategy 23.3.3.5.3. Channel Strategy 23.3.4. C.L. Smith Company 23.3.4.1. Overview 23.3.4.2. Product Portfolio 23.3.4.3. Profitability by Market Segments 23.3.4.4. Sales Footprint 23.3.4.5. Strategy Overview 23.3.4.5.1. Marketing Strategy 23.3.4.5.2. Product Strategy 23.3.4.5.3. Channel Strategy 23.3.5. DARIN CO., Ltd. 23.3.5.1. Overview 23.3.5.2. Product Portfolio 23.3.5.3. Profitability by Market Segments 23.3.5.4. Sales Footprint 23.3.5.5. Strategy Overview 23.3.5.5.1. Marketing Strategy 23.3.5.5.2. Product Strategy 23.3.5.5.3. Channel Strategy 23.3.6. Richmond Containers CTP Ltd. 23.3.6.1. Overview 23.3.6.2. Product Portfolio 23.3.6.3. Profitability by Market Segments 23.3.6.4. Sales Footprint 23.3.6.5. Strategy Overview 23.3.6.5.1. Marketing Strategy 23.3.6.5.2. Product Strategy 23.3.6.5.3. Channel Strategy 23.3.7. TAPLAST S.r.l. 23.3.7.1. Overview 23.3.7.2. Product Portfolio 23.3.7.3. Profitability by Market Segments 23.3.7.4. Sales Footprint 23.3.7.5. Strategy Overview 23.3.7.5.1. Marketing Strategy 23.3.7.5.2. Product Strategy 23.3.7.5.3. Channel Strategy 23.3.8. Frapak Packaging B.V. 23.3.8.1. Overview 23.3.8.2. Product Portfolio 23.3.8.3. Profitability by Market Segments 23.3.8.4. Sales Footprint 23.3.8.5. Strategy Overview 23.3.8.5.1. Marketing Strategy 23.3.8.5.2. Product Strategy 23.3.8.5.3. Channel Strategy 23.3.9. RAEPAK Ltd. 23.3.9.1. Overview 23.3.9.2. Product Portfolio 23.3.9.3. Profitability by Market Segments 23.3.9.4. Sales Footprint 23.3.9.5. Strategy Overview 23.3.9.5.1. Marketing Strategy 23.3.9.5.2. Product Strategy 23.3.9.5.3. Channel Strategy 23.3.10. PKP Plastic Products Inc. 23.3.10.1. Overview 23.3.10.2. Product Portfolio 23.3.10.3. Profitability by Market Segments 23.3.10.4. Sales Footprint 23.3.10.5. Strategy Overview 23.3.10.5.1. Marketing Strategy 23.3.10.5.2. Product Strategy 23.3.10.5.3. Channel Strategy 23.3.11. UNICOM International Ltd. 23.3.11.1. Overview 23.3.11.2. Product Portfolio 23.3.11.3. Profitability by Market Segments 23.3.11.4. Sales Footprint 23.3.11.5. Strategy Overview 23.3.11.5.1. Marketing Strategy 23.3.11.5.2. Product Strategy 23.3.11.5.3. Channel Strategy 23.3.12. Weltrade Pty Ltd. 23.3.12.1. Overview 23.3.12.2. Product Portfolio 23.3.12.3. Profitability by Market Segments 23.3.12.4. Sales Footprint 23.3.12.5. Strategy Overview 23.3.12.5.1. Marketing Strategy 23.3.12.5.2. Product Strategy 23.3.12.5.3. Channel Strategy 23.3.13. TYH Container Enterprise Co., Ltd. 23.3.13.1. Overview 23.3.13.2. Product Portfolio 23.3.13.3. Profitability by Market Segments 23.3.13.4. Sales Footprint 23.3.13.5. Strategy Overview 23.3.13.5.1. Marketing Strategy 23.3.13.5.2. Product Strategy 23.3.13.5.3. Channel Strategy 23.3.14. Zhejiang Sun-Rain Industrial Co., Ltd. 23.3.14.1. Overview 23.3.14.2. Product Portfolio 23.3.14.3. Profitability by Market Segments 23.3.14.4. Sales Footprint 23.3.14.5. Strategy Overview 23.3.14.5.1. Marketing Strategy 23.3.14.5.2. Product Strategy 23.3.14.5.3. Channel Strategy 23.3.15. ScopeNEXT Ltd. 23.3.15.1. Overview 23.3.15.2. Product Portfolio 23.3.15.3. Profitability by Market Segments 23.3.15.4. Sales Footprint 23.3.15.5. Strategy Overview 23.3.15.5.1. Marketing Strategy 23.3.15.5.2. Product Strategy 23.3.15.5.3. Channel Strategy 24. Assumptions and Acronyms Used 25. Research Methodology
Let us know your requirement to get
100% FREE customization
List of Tables
Table 01: Global Pump & Dispenser Market Volume, by Product Type Table 02: Global Pump & Dispenser Market Value, by Product Type Table 03: Global Pump & Dispenser Market Volume, by Material Type Table 04: Global Pump & Dispenser Market Value, by Material Type Table 05: Global Pump & Dispenser Market Volume, by Application Table 06: Global Pump & Dispenser Market Value, by Application Table 07: Global Pump & Dispenser Market Volume, by End Use Table 08: Global Pump & Dispenser Market Value, by End Use Table 09: Global Pump & Dispenser Market Volume, by Region Table 10: Global Pump & Dispenser Market Value, by Region Table 11: North America Global Pump & Dispenser Market Volume, by Product Type & Material Type Table 12: North America Pump & Dispenser Market Volume, by Application & End Use Table 13: North America Pump & Dispenser Market Value, by Product Type & Material Type Table 14: North America Pump & Dispenser Market Value, by Application & End Use Table 15: North America Pump & Dispenser Market Volume, by Country Table 16: North America Pump & Dispenser Market Value, by Country Table 17: Latin America Pump & Dispenser Market Volume, by Product Type & Material Type Table 18: Latin America Pump & Dispenser Market Volume, by Application & End Use Table 19: Latin America Pump & Dispenser Market Value, by Product Type & Material Type Table 20: Latin America Pump & Dispenser Market Value, by Application & End Use Table 21: Latin America Pump & Dispenser Market Volume, by Country Table 22: Latin America Pump & Dispenser Market Value, by Country Table 23: Europe Pump & Dispenser Market Volume, by Product Type & Material Type Table 24: Europe Pump & Dispenser Market Volume, by Application & End Use Table 25: Europe Pump & Dispenser Market Value, by Product Type & Material Type Table 26: Europe Pump & Dispenser Market Value, by Application & End Use Table 27: Europe Pump & Dispenser Market Volume, by Country Table 28: Europe Pump & Dispenser Market Value, by Country Table 29: MEA Pump & Dispenser Market Volume, by Product Type & Material Type Table 30: MEA Pump & Dispenser Market Volume, by Application & End Use Table 31: MEA Pump & Dispenser Market Value, by Product Type & Material Type Table 32: MEA Pump & Dispenser Market Value, by Application & End Use Table 33: MEA Pump & Dispenser Market Volume, by Country Table 34: MEA Pump & Dispenser Market Value, by Country Table 35: East Asia Pump & Dispenser Market Volume, by Product Type & Material Type Table 36: East Asia Pump & Dispenser Market Volume, by Application & End Use Table 37: East Asia Pump & Dispenser Market Value, by Product Type & Material Type Table 38: East Asia Pump & Dispenser Market Value, by Application & End Use Table 39: East Asia Pump & Dispenser Market Volume, by Country Table 40: East Asia Pump & Dispenser Market Value, by Country Table 41: South Asia Pump & Dispenser Market Volume, by Product Type & Material Type Table 42: South Asia Pump & Dispenser Market Volume, by Application & End Use Table 43: South Asia Pump & Dispenser Market Value, by Product Type & Material Type Table 44: South Asia Pump & Dispenser Market Value, by Application & End Use Table 45: South Asia Pump & Dispenser Market Volume, by Country Table 46: South Asia Pump & Dispenser Market Value, by Country Table 47: Oceania Pump & Dispenser Market Volume, by Product Type & Material Type Table 48: Oceania Pump & Dispenser Market Volume, by Application & End Use Table 49: Oceania Pump & Dispenser Market Value, by Product Type & Material Type Table 50: Oceania Pump & Dispenser Market Value, by Application & End Use Table 51: Oceania Pump & Dispenser Market Volume, by Country Table 52: Oceania Pump & Dispenser Market Value, by Country Table 53: United States Pump & Dispenser Market Analysis, by Product Type, Material Type, Application & End Use (1/2) Table 54: United States Pump & Dispenser Market Analysis, by Product Type, Material Type, Application & End Use (2/2) Table 55: Canada Pump & Dispenser Market Analysis, by Product Type, Material Type, Application & End Use (1/2) Table 56: Canada Pump & Dispenser Market Analysis, by Product Type, Material Type, Application & End Use (2/2) Table 57: Brazil Pump & Dispenser Market Analysis, by Product Type, Material Type, Application & End Use (1/2) Table 58: Brazil Pump & Dispenser Market Analysis, by Product Type, Material Type, Application & End Use (2/2) Table 59: Mexico Pump & Dispenser Market Analysis, by Product Type, Material Type, Application & End Use (1/2) Table 60: Mexico Pump & Dispenser Market Analysis, by Product Type, Material Type, Application & End Use (2/2) Table 61: Germany Pump & Dispenser Market Analysis, by Product Type, Material Type, Application & End Use (1/2) Table 62: Germany Pump & Dispenser Market Analysis, by Product Type, Material Type, Application & End Use (2/2) Table 63: Italy Pump & Dispenser Market Analysis, by Product Type, Material Type, Application & End Use (1/2) Table 64: Italy Pump & Dispenser Market Analysis, by Product Type, Material Type, Application & End Use (2/2) Table 65: France Pump & Dispenser Market Analysis, by Product Type, Material Type, Application & End Use (1/2) Table 66: France Pump & Dispenser Market Analysis, by Product Type, Material Type, Application & End Use (2/2) Table 67: U.K. Pump & Dispenser Market Analysis, by Product Type, Material Type, Application & End Use (1/2) Table 68: U.K. Pump & Dispenser Market Analysis, by Product Type, Material Type, Application & End Use (2/2) Table 69: Spain Pump & Dispenser Market Analysis, by Product Type, Material Type, Application & End Use (1/2) Table 70: Spain Pump & Dispenser Market Analysis, by Product Type, Material Type, Application & End Use (2/2) Table 71: BENELUX Pump & Dispenser Market Analysis, by Product Type, Material Type, Application & End Use (1/2) Table 72: BENELUX Pump & Dispenser Market Analysis, by Product Type, Material Type, Application & End Use (2/2) Table 73: Russia Pump & Dispenser Market Analysis, by Product Type, Material Type, Application & End Use (1/2) Table 74: Russia Pump & Dispenser Market Analysis, by Product Type, Material Type, Application & End Use (2/2) Table 75: Turkey Pump & Dispenser Market Analysis, by Product Type, Material Type, Application & End Use (1/2) Table 76: Turkey Pump & Dispenser Market Analysis, by Product Type, Material Type, Application & End Use (2/2) Table 77: GCC Pump & Dispenser Market Analysis, by Product Type, Material Type, Application & End Use (1/2) Table 78: GCC Pump & Dispenser Market Analysis, by Product Type, Material Type, Application & End Use (2/2) Table 79: China Pump & Dispenser Market Analysis, by Product Type, Material Type, Application & End Use (1/2) Table 80: China Pump & Dispenser Market Analysis, by Product Type, Material Type, Application & End Use (2/2) Table 81: Japan Pump & Dispenser Market Analysis, by Product Type, Material Type, Application & End Use (1/2) Table 82: Japan Pump & Dispenser Market Analysis, by Product Type, Material Type, Application & End Use (2/2) Table 83: South Korea Pump & Dispenser Market Analysis, by Product Type, Material Type, Application & End Use (1/2) Table 84: South Korea Pump & Dispenser Market Analysis, by Product Type, Material Type, Application & End Use (2/2) Table 85: India Pump & Dispenser Market Analysis, by Product Type, Material Type, Application & End Use (1/2) Table 86: India Pump & Dispenser Market Analysis, by Product Type, Material Type, Application & End Use (2/2) Table 87: Australia Pump & Dispenser Market Analysis, by Product Type, Material Type, Application & End Use (1/2) Table 88: Australia Pump & Dispenser Market Analysis, by Product Type, Material Type, Application & End Use (2/2) Table 89: New Zealand Pump & Dispenser Market Analysis, by Product Type, Material Type, Application & End Use (1/2) Table 90: New Zealand Pump & Dispenser Market Analysis, by Product Type, Material Type, Application & End Use (2/2)
Find your sweet spots for generating winning opportunities in this market.
Talk to AnalystList of Charts
Figure 01: Global Pump & Dispenser Market Attractiveness Analysis by Product Type 2022(E) - 2030(F) Figure 02: Global Pump & Dispenser Market Value Share by Product Type 2022(E) & 2030(F) Figure 03: Global Pump & Dispenser Market Volume (Mn Units) by Product Type 2022(E)-2030(F) Figure 04: Global Pump & Dispenser Market Attractiveness Analysis by Material Type 2022(E) - 2030(F) Figure 05: Global Pump & Dispenser Market Value Share by Material Type 2022(E) & 2030(F) Figure 06: Global Pump & Dispenser Market Volume (Mn Units) by Material Type 2022(E)-2030(F) Figure 07: Global Pump & Dispenser Market Attractiveness Analysis by Application 2022(E) - 2030(F) Figure 08: Global Pump & Dispenser Market Value Share by Application 2022(E) & 2030(F) Figure 09: Global Pump & Dispenser Market Volume (Mn Units) by Application 2022(E)-2030(F) Figure 10: Global Pump & Dispenser Market Attractiveness Analysis by End Use 2022(E) - 2030(F) Figure 11: Global Pump & Dispenser Market Value Share by End Use 2022(E) & 2030(F) Figure 12: Global Pump & Dispenser Market Volume (Mn Units) by End Use 2022(E)-2030(F) Figure 13: Global Pump & Dispenser Market Attractiveness Analysis by Region 2022(E) - 2030(F) Figure 14: Global Pump & Dispenser Market Value Share by Region 2022(E) & 2030(F) Figure 15: Global Pump & Dispenser Market Volume (Mn Units) by Region 2022(E)-2030(F) Figure 16: North America Pump & Dispenser Market Analysis, by Product Type (2022) Figure 17: North America Pump & Dispenser Market Analysis, by Material Type (2022) Figure 18: North America Pump & Dispenser Market Analysis, by Application (2022) Figure 19: North America Pump & Dispenser Market Analysis, by End Use (2022) Figure 20: North America Pump & Dispenser Market Attractiveness Analysis by Country 2022(E) - 2030(F) Figure 21: North America Pump & Dispenser Market Value Share by Country 2022(E) & 2030(F) Figure 22: North America Pump & Dispenser Market Volume (Mn Units) by Country 2022(E)-2030(F) Figure 23: Latin America Pump & Dispenser Market Analysis, by Product Type (2022) Figure 24: Latin America Pump & Dispenser Market Analysis, by Material Type (2022) Figure 25: Latin America Pump & Dispenser Market Analysis, by Application (2022) Figure 26: Latin America Pump & Dispenser Market Analysis, by End Use (2022) Figure 27: Latin America Pump & Dispenser Market Attractiveness Analysis by Country 2022(E) - 2030(F) Figure 28: Latin America Pump & Dispenser Market Value Share by Country 2022(E) & 2030(F) Figure 29: Latin America Pump & Dispenser Market Volume (Mn Units) by Country 2022(E)-2030(F) Figure 30: Europe Pump & Dispenser Market Analysis, by Product Type (2022) Figure 31: Europe Pump & Dispenser Market Analysis, by Material Type (2022) Figure 32: Europe Pump & Dispenser Market Analysis, by Application (2022) Figure 33: Europe Pump & Dispenser Market Analysis, by End Use (2022) Figure 34: Europe Pump & Dispenser Market Attractiveness Analysis by Country 2022(E) - 2030(F) Figure 35: Europe Pump & Dispenser Market Value Share by Country 2022(E) & 2030(F) Figure 36: Europe Pump & Dispenser Market Volume (Mn Units) by Country 2022(E)-2030(F) Figure 37: MEA Pump & Dispenser Market Analysis, by Product Type (2022) Figure 38: MEA Pump & Dispenser Market Analysis, by Material Type (2022) Figure 39: MEA Pump & Dispenser Market Analysis, by Application (2022) Figure 40: MEA Pump & Dispenser Market Analysis, by End Use (2022) Figure 41: MEA Pump & Dispenser Market Attractiveness Analysis by Country 2022(E) - 2030(F) Figure 42: MEA Pump & Dispenser Market Value Share by Country 2022(E) & 2030(F) Figure 43: MEA Pump & Dispenser Market Volume (Mn Units) by Country 2022(E)-2030(F) Figure 44: East Asia Pump & Dispenser Market Analysis, by Product Type (2022) Figure 45: East Asia Pump & Dispenser Market Analysis, by Material Type (2022) Figure 46: East Asia Pump & Dispenser Market Analysis, by Application (2022) Figure 47: East Asia Pump & Dispenser Market Analysis, by End Use (2022) Figure 48: East Asia Pump & Dispenser Market Attractiveness Analysis by Country 2022(E) - 2030(F) Figure 49: East Asia Pump & Dispenser Market Value Share by Country 2022(E) & 2030(F) Figure 50: East Asia Pump & Dispenser Market Volume (Mn Units) by Country 2022(E)-2030(F) Figure 51: South Asia Pump & Dispenser Market Analysis, by Product Type (2022) Figure 52: South Asia Pump & Dispenser Market Analysis, by Material Type (2022) Figure 53: South Asia Pump & Dispenser Market Analysis, by Application (2022) Figure 54: South Asia Pump & Dispenser Market Analysis, by End Use (2022) Figure 55: South Asia Pump & Dispenser Market Attractiveness Analysis by Country 2022(E) - 2030(F) Figure 56: South Asia Pump & Dispenser Market Value Share by Country 2022(E) & 2030(F) Figure 57: South Asia Pump & Dispenser Market Volume (Mn Units) by Country 2022(E)-2030(F) Figure 58: Oceania Pump & Dispenser Market Analysis, by Product Type (2022) Figure 59: Oceania Pump & Dispenser Market Analysis, by Material Type (2022) Figure 60: Oceania Pump & Dispenser Market Analysis, by Application (2022) Figure 61: Oceania Pump & Dispenser Market Analysis, by End Use (2022) Figure 62: Oceania Pump & Dispenser Market Attractiveness Analysis by Country 2022(E) - 2030(F) Figure 63: Oceania Pump & Dispenser Market Value Share by Country 2022(E) & 2030(F) Figure 64: Oceania Pump & Dispenser Market Volume (Mn Units) by Country 2022(E)-2030(F)
Need specific information?
Request CustomizationExplore Packaging Insights
View Reports