The heat pump industry stands at the threshold of a decade-long expansion trajectory that promises to reshape building heating technology, renewable energy integration solutions, and electrified climate control applications. The market's journey from USD 56.9 billion in 2025 to USD 150.3 billion by 2035 represents substantial growth at a 10.2% CAGR, demonstrating the accelerating adoption of advanced heat pump configurations and refrigerant technology across residential heating, commercial HVAC, industrial process heating, and building decarbonization sectors.
The first half of the decade (2025-2030) will witness the market climbing from USD 56.9 billion to approximately USD 92.5 billion, adding USD 35.6 billion in value, which constitutes 38% of the total forecast growth period. This phase will be characterized by the rapid adoption of air-to-air heat pump systems, driven by increasing building electrification requirements and the growing need for high-efficiency heating solutions capable of replacing fossil fuel boilers worldwide. Advanced inverter capabilities and natural refrigerant systems will become standard expectations rather than premium options.
The latter half (2030-2035) will witness accelerated growth from USD 92.5 billion to USD 150.3 billion, representing an addition of USD 57.8 billion or 62% of the decade's expansion. This period will be defined by mass market penetration of natural refrigerant heat pumps, integration with comprehensive building energy management platforms, and seamless compatibility with existing heating distribution infrastructure. The market trajectory signals fundamental shifts in how building owners approach decarbonization optimization and energy efficiency management, with participants positioned to benefit from sustained demand across multiple equipment types and end-user segments.
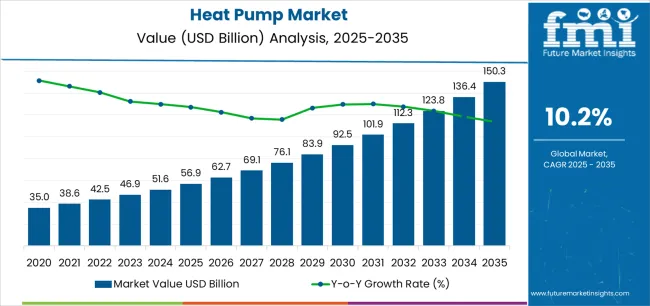
The Heat Pump market demonstrates distinct growth phases with varying market characteristics and competitive dynamics. Between 2025 and 2030, the market progresses through its mainstream adoption phase, expanding from USD 56.9 billion to USD 92.5 billion with strong annual increments averaging 10.2% growth. This period showcases the transition from conventional gas boilers and electric resistance heating to advanced air-source heat pump systems with enhanced cold-climate capabilities and integrated smart controls becoming mainstream features.
The 2025-2030 phase adds USD 35.6 billion to market value, representing 38% of total decade expansion. Market maturation factors include standardization of inverter-driven compressor technology, declining component costs for air-source heat pump equipment, and increasing industry awareness of operational efficiency benefits reaching 300-400% seasonal performance factors in moderate climates. Competitive landscape evolution during this period features established HVAC manufacturers like Daikin and Carrier expanding their heat pump portfolios while specialty manufacturers focus on natural refrigerant development and cold-climate performance capabilities.
From 2030 to 2035, market dynamics shift toward comprehensive building decarbonization and global heating electrification, with growth continuing from USD 92.5 billion to USD 150.3 billion, adding USD 57.8 billion or 62% of total expansion. This phase transition centers on fully integrated heat pump systems with renewable energy coupling, compatibility with district heating networks, and deployment across diverse climate zones and building retrofit scenarios, becoming standard rather than specialized applications. The competitive environment matures with focus shifting from basic heating capability to comprehensive energy optimization systems and integration with grid flexibility platforms.
| Metric | Value |
|---|---|
| Market Value (2025) | USD 56.9 billion |
| Market Forecast (2035) | USD 150.3 billion |
| Growth Rate | 10.2% CAGR |
| Leading Product Type | Air-Air Heat Pump (44.3% share) |
| Primary End User | Residential Segment (54.0% share) |
The market demonstrates strong fundamentals with air-to-air heat pump systems capturing a dominant 44.3% share through advanced ductless mini-split technology and versatile heating-cooling capabilities. Residential applications drive primary demand at 54.0% share, supported by increasing building electrification mandates and fossil fuel boiler replacement technology requirements. Geographic expansion remains concentrated in developed markets with established decarbonization policies, while emerging economies show accelerating adoption rates driven by urbanization expansion and rising climate control standards.
Market expansion rests on three fundamental shifts driving adoption across the residential, commercial, and industrial building sectors. First, building decarbonization mandates create compelling operational advantages through heat pump technology that provides efficient heating without direct fossil fuel combustion, enabling building owners to achieve net-zero emissions targets while maintaining thermal comfort and reducing operational energy costs compared to conventional gas boilers and electric resistance systems. Second, energy efficiency modernization accelerates as building owners worldwide seek advanced heat pump systems that deliver 300-400% efficiency ratios through refrigeration cycle technology, enabling operational cost reduction and carbon footprint minimization that align with environmental regulations and energy security objectives.
Third, renewable energy integration drives adoption from residential homeowners and commercial facility managers requiring effective electrified heating solutions that complement solar photovoltaic installations and enable demand flexibility during renewable energy generation periods and grid optimization operations. The growth faces headwinds from upfront capital cost challenges that vary across building types regarding the installation of heat pump equipment and associated distribution system modifications, which may limit adoption in price-sensitive renovation markets. Technical limitations also persist regarding cold-climate performance and defrost cycle requirements that may reduce effectiveness in extreme winter locations and continuous heating demand scenarios, which affect system sizing and backup heating integration.
The market represents a transformative building technology opportunity driven by expanding global decarbonization commitments, fossil fuel heating phase-out programs, and the need for superior energy efficiency in diverse climate applications. As building owners worldwide seek to achieve 50-70% heating cost reduction, eliminate direct carbon emissions, and integrate heat pumps with renewable energy systems and smart grid platforms, heat pumps are evolving from niche heating alternatives to mainstream climate control solutions ensuring thermal comfort and environmental compliance.
The market's growth trajectory from USD 56.9 billion in 2025 to USD 150.3 billion by 2035 at a 10.2% CAGR reflects fundamental shifts in building energy requirements and heating sector electrification. Geographic expansion opportunities are particularly pronounced in European and Asian markets, while the dominance of air-to-air heat pump systems (44.3% market share) and residential applications (54.0% share) provides clear strategic focus areas.
Strengthening the dominant air-to-air heat pump segment (44.3% market share) through enhanced inverter-driven compressor configurations, superior cold-climate performance ratings down to -25°C operation, and advanced ductless mini-split systems with multi-zone capabilities. This pathway focuses on optimizing refrigeration cycle efficiency, improving heating capacity retention at low ambient temperatures, extending operational effectiveness to comprehensive year-round climate control, and developing whisper-quiet indoor units for residential retrofit applications. Market leadership consolidation through advanced inverter engineering and natural refrigerant integration enables premium positioning while defending competitive advantages against conventional air conditioning equipment. Expected revenue pool: USD 6.8-8.9 billion
Rapid building heating electrification and boiler phase-out programs across Europe create substantial expansion opportunities through local manufacturing capabilities and certified installer network development. Growing renewable energy mandates and stringent Energy Performance of Buildings Directive compliance drive sustained demand for advanced heat pump systems. Regional market strategies including tailored air-to-water configurations, district heating compatibility, and building renovation financing programs position companies advantageously for national heat pump deployment initiatives while accessing rapidly growing replacement heating markets. Expected revenue pool: USD 5.9-7.7 billion
Expansion within the dominant residential segment (54.0% market share) through specialized equipment addressing single-family retrofit standards, multi-family building integration, and new construction heating requirements. This pathway encompasses compact outdoor unit designs, low-noise operation specifications, and compatibility with existing radiator distribution systems. Premium positioning reflects superior thermal comfort delivery and comprehensive seasonal efficiency supporting modern residential heating-cooling applications and fossil fuel heating replacement. Expected revenue pool: USD 5.1-6.7 billion
Strategic advancement in natural refrigerant adoption (18.0% share growing rapidly) requires enhanced R290 propane system development and specialized CO₂ transcritical configurations addressing environmental compliance requirements. This pathway addresses zero-GWP heating solutions, regulatory compliance with F-Gas phase-down mandates, and next-generation refrigerant platforms with advanced safety engineering for flammable refrigerant handling. Premium pricing reflects environmental leadership and future regulatory compliance while reducing dependency on synthetic HFC refrigerants facing phase-out pressures. Expected revenue pool: USD 4.4-5.8 billion
Development of specialized cold-climate heat pumps maintaining heating capacity and efficiency at -25°C to -30°C ambient temperatures, addressing specific northern climate requirements and continuous heating demands. This pathway encompasses enhanced vapor injection technology, variable-speed compressor optimization, and advanced defrost cycle management for harsh winter environments. Technology differentiation through proprietary cold-climate engineering enables diversified revenue streams while reducing dependency on moderate-climate equipment specifications. Expected revenue pool: USD 3.8-5.0 billion
Expansion targeting commercial office buildings, retail facilities, and light industrial applications through specialized rooftop heat pump configurations and integrated ventilation systems. This pathway encompasses modular capacity staging, building automation integration, and simultaneous heating-cooling capabilities for mixed-use commercial buildings. Market development through application-specific engineering enables differentiated positioning while accessing rapidly growing commercial building electrification markets requiring scalable heating solutions. Expected revenue pool: USD 3.3-4.3 billion
Development of comprehensive heat pump monitoring systems addressing grid flexibility optimization and demand response integration requirements across residential and commercial installations. This pathway encompasses IoT connectivity, AI-powered predictive defrost algorithms, and comprehensive building energy management platforms enabling dynamic electricity pricing response. Premium positioning reflects operational excellence and total cost of ownership optimization while enabling access to utility demand-response programs and smart home ecosystem integration. Expected revenue pool: USD 2.9-3.8 billion
Primary Product Classification: The market segments by product type into Air-Air Heat Pump, Air-Water Heat Pump, Ground Source (Geothermal), and Water Source categories, representing the evolution from basic air conditioning systems to comprehensive heating-cooling solutions for diverse building applications.
Secondary Refrigerant Classification: Refrigerant segmentation divides the market into Hydro-fluorocarbon (HFC), Natural Refrigerants (Propane/R290, CO₂), CO₂ (R744), Ammonia (R717), and Others categories, reflecting distinct environmental impact profiles, regulatory compliance requirements, and operational performance standards.
Tertiary End-User Classification: End-user segmentation encompasses Residential, Commercial, and Industrial categories, demonstrating varying heating capacity requirements and application characteristics.
Quaternary Power Classification: Power level segmentation includes Small (<10 kW), Medium (10-100 kW), and Large (>100 kW) categories, reflecting diverse building size requirements and heating load specifications.
Regional Classification: Geographic distribution covers Asia Pacific, Europe, North America, Latin America, Africa, and the Middle East, with developed markets leading decarbonization adoption while emerging economies show accelerating growth patterns driven by urbanization and climate control modernization programs.
The segmentation structure reveals technology progression from conventional HFC-based air conditioning toward natural refrigerant heat pump systems with enhanced heating capabilities and smart control integration, while application diversity spans from residential space heating to specialized industrial process heating applications requiring advanced heat pump solutions.
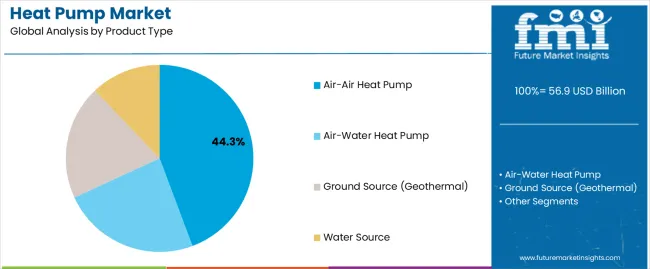
Market Position: Air-to-air heat pump systems command the leading position in the Heat Pump market with approximately 44.3% market share through advanced ductless mini-split features, including superior heating-cooling versatility, efficient inverter-driven compressor technology, and installation flexibility that enable building owners to achieve optimal climate control across diverse residential and light commercial environments without requiring hydronic distribution systems.
Value Drivers: The segment benefits from homeowner and contractor preference for versatile HVAC systems that provide both heating and cooling capability, reduced installation complexity compared to ducted systems, and zone control optimization without requiring extensive infrastructure modifications. Advanced inverter features enable continuous capacity modulation, whisper-quiet operation, and integration with smart thermostats and building automation, where seasonal efficiency and multi-zone capability represent critical selection requirements.
Competitive Advantages: Air-to-air heat pumps differentiate through proven reliability in moderate climates, optimal installed cost-to-performance ratios, and compatibility with existing electrical infrastructure that enhance adoption effectiveness while maintaining equipment costs suitable for diverse residential retrofit and new construction applications.
Key market characteristics:
Air-to-water heat pump systems maintain 32.1% market share due to their essential compatibility with hydronic heating distribution including radiators and underfloor heating systems prevalent in European building stock. Ground source (geothermal) heat pumps capture 17.2% share through superior efficiency performance and stable ground temperature utilization in premium residential and commercial installations. Water source heat pumps demonstrate 6.4% adoption in specialized applications requiring lake, river, or groundwater heat exchange capabilities.

Market Context: Residential applications dominate the Heat Pump market with approximately 32.1% market share due to widespread adoption across single-family homes, multi-family buildings, and residential new construction applications that maximize individual homeowner heating cost reduction while supporting national building decarbonization objectives and fossil fuel heating phase-out programs.
Appeal Factors: Homeowners prioritize heating cost reduction achieving 50-70% operational savings compared to oil and propane heating, installation flexibility through ductless mini-split configurations, and integration with residential solar photovoltaic systems that enables self-consumption optimization. The segment benefits from substantial government incentive programs including tax credits, rebates, and zero-interest financing supporting residential heat pump adoption across retrofit and new construction applications.
Growth Drivers: Boiler replacement cycles and fossil fuel heating bans in new construction drive sustained residential heat pump demand, while rising natural gas prices and carbon pricing mechanisms enhance heat pump economic competitiveness. Smart home integration and utility demand response programs create additional value streams beyond basic heating cost savings.
Market Challenges: Upfront capital costs ranging USD 8,000-15,000 for complete installations may limit adoption among cost-constrained homeowners, while electrical service upgrade requirements add incremental costs in older housing stock.
End-user dynamics include:
Commercial applications maintain 34.0% share through office buildings, retail facilities, hotels, and institutional buildings requiring scalable heating-cooling solutions and building automation integration. Industrial operations account for 12.0% share serving process heating, space conditioning, and waste heat recovery applications where high-temperature heat pump configurations and large-capacity systems address specialized industrial requirements.
Growth Accelerators: Building decarbonization mandates drive primary adoption as heat pump technology provides efficient electrified heating that enables building owners to eliminate direct fossil fuel combustion while achieving net-zero carbon emissions targets, supporting climate action commitments and regulatory missions that require heating sector transformation. Energy cost reduction demand accelerates market expansion as heat pumps deliver 300-400% efficiency ratios compared to 90-95% efficiency gas boilers, enabling operational cost savings reaching 50-70% versus oil and propane heating while maintaining thermal comfort during extended heating seasons. Renewable energy integration spending increases worldwide, creating sustained demand for electrified heating equipment that complements solar photovoltaic generation and provides demand flexibility enabling grid optimization and renewable energy self-consumption maximization.
Growth Inhibitors: Upfront capital cost challenges vary across building types regarding the installation of heat pump equipment including outdoor units, indoor air handlers, and distribution system modifications, which may limit operational flexibility and market penetration in cost-constrained renovation markets or price-sensitive developing economies. Cold-climate performance limitations persist regarding heating capacity degradation and efficiency reduction at ambient temperatures below -10°C to -15°C, which may reduce effectiveness in extreme northern climates and necessitate supplemental heating systems, affecting total system costs and operational reliability. Electrical infrastructure constraints across aging building stock create upgrade requirements including electrical service panel capacity, circuit breaker sizing, and supply wiring that add incremental installation costs and complexity.
Market Evolution Patterns: Adoption accelerates in high-efficiency building stock and premium residential segments where environmental priorities justify heat pump investments, with geographic concentration in policy-driven markets transitioning toward mainstream adoption in moderate climates driven by fossil fuel price increases and incentive program expansion. Technology development focuses on natural refrigerant systems including R290 propane configurations, improved cold-climate performance through enhanced vapor injection, and integration with building energy management platforms that optimize heat pump operation for dynamic electricity pricing. The market could face disruption if alternative heating technologies including hydrogen-ready boilers or advanced biomass systems achieve competitive economics, though the fundamental efficiency advantages of heat pump technology and alignment with building electrification strategies continues to make heat pumps irreplaceable in decarbonization pathways.
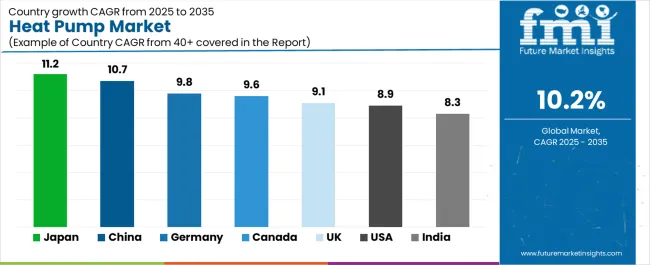
The heat pump market demonstrates varied regional dynamics with Growth Leaders including Japan (11.2% CAGR) and China (10.7% CAGR) driving expansion through residential electrification capacity additions, manufacturing scale advantages, and comprehensive building efficiency programs. Strong Performers encompass Germany (9.8% CAGR), Canada (9.6% CAGR), and the United Kingdom (9.1% CAGR), benefiting from established decarbonization policies and fossil fuel heating phase-out mandates. Steady Performers feature the United States (8.9% CAGR) and India (8.3% CAGR), where residential adoption growth and commercial building electrification support consistent expansion patterns.
| Country | CAGR (2025-2035) |
|---|---|
| Japan | 11.2% |
| China | 10.7% |
| Germany | 9.8% |
| Canada | 9.6% |
| United Kingdom | 9.1% |
| United States | 8.9% |
| India | 8.3% |
Regional synthesis reveals Asia Pacific markets leading adoption through residential air conditioning-heating integration and manufacturing scale advantages, while European countries maintain strong expansion supported by stringent building energy regulations and boiler phase-out timelines. North American markets show steady growth driven by utility incentive programs and cold-climate technology advancement enabling adoption in harsh winter climates.

Japan leads growth momentum with an 11.2% CAGR, driven by strong government incentives for high-efficiency heating systems, compact urban building retrofits ideally suited for ductless mini-split installations, and advanced natural refrigerant product launches including R290 propane heat pumps addressing environmental regulations across major metropolitan areas including Tokyo, Osaka, and Nagoya. Ministry of Economy, Trade and Industry subsidy programs and local government rebate initiatives drive primary heat pump adoption, while building energy efficiency mandates support replacement of aging kerosene heating equipment with advanced inverter-driven heat pumps.
The convergence of limited residential space requiring compact equipment solutions, established air conditioning market infrastructure enabling heat pump channel distribution, and advanced manufacturing capabilities producing premium efficiency equipment positions Japan as the leading growth market for heat pump technology. Commercial building renovation programs and hotel sector modernization accelerate multi-zone VRF heat pump installations, while cold-climate performance improvements enable adoption in northern regions including Hokkaido previously dominated by fossil fuel heating.
Performance Metrics:
The Chinese market emphasizes extensive heat pump manufacturing capacity with documented operational scale in residential air-to-air systems and commercial VRF installations through integration with domestic appliance manufacturing and HVAC supply chains. The country leverages manufacturing expertise in compressor technology, heat exchanger production, and inverter control systems to maintain substantial market presence at 10.7% CAGR. Urban regions including Beijing, Shanghai, Guangzhou, and Shenzhen showcase large-scale installations where heat pumps integrate with residential apartment buildings and commercial office complexes to optimize heating-cooling efficiency and support air quality improvement initiatives. Chinese equipment manufacturers prioritize cost-competitive production and domestic market domination, creating supply advantages through vertically integrated manufacturing controlling compressor production, refrigerant sourcing, and component fabrication meeting national energy efficiency standards.
State-owned utility companies and municipal governments drive substantial heat pump deployment through clean heating programs replacing coal-fired boilers, while residential building codes mandate high-efficiency HVAC systems. Northern heating region electrification programs create concentrated demand for cold-climate heat pump configurations capable of replacing district heating connections.
Market Intelligence Brief:
Germany's advanced building market demonstrates sophisticated heat pump deployment with documented operational effectiveness in residential new construction and retrofit applications through integration with renewable energy systems and building automation platforms. The country leverages engineering expertise in building technology and energy efficiency to maintain strong heat pump adoption at 9.8% CAGR. Building regions across Bavaria, North Rhine-Westphalia, and Baden-Württemberg showcase premium installations where heat pumps integrate with solar photovoltaic systems, thermal storage tanks, and smart building controls to optimize renewable energy self-consumption and grid flexibility. German building owners prioritize operational efficiency, renewable energy integration, and long-term decarbonization compliance, creating demand for premium heat pump equipment with advanced controls including weather-compensated operation, thermal storage integration, and building energy management system connectivity.
Stringent Energy Performance of Buildings Directive implementation and BEG subsidy programs drive sustained heat pump adoption in residential retrofits and new construction, while commercial building renovations incorporate heat pump technology replacing aging fossil fuel boilers. Natural refrigerant adoption accelerates through R290 propane heat pump availability and F-Gas regulation compliance driving environmental performance standards.
Strategic Market Indicators:
Canada demonstrates consistent market presence at 9.6% CAGR through cold-climate heat pump adoption, particularly in provinces implementing aggressive electrification programs including British Columbia, Quebec, and Ontario replacing oil heating and natural gas systems with advanced air-source technology. Federal and provincial government programs including Canada Greener Homes Grant and utility rebate initiatives drive substantial heat pump procurement for residential heating applications, while building code updates mandate high-efficiency heating systems in new construction. Cold-climate performance validation programs and field testing initiatives support technology advancement enabling reliable operation at -25°C to -30°C ambient temperatures through enhanced vapor injection compressor technology.
The emphasis on fossil fuel heating phase-out and building electrification creates concentrated demand for heat pumps proven effective in harsh Canadian winter conditions, while hydroelectric grid resources in Quebec and British Columbia provide low-carbon electricity supporting emission reduction objectives. Indigenous community programs and remote area installations demonstrate heat pump viability replacing diesel heating in off-grid applications.
Performance Metrics:
The United Kingdom emphasizes heat pump adoption through boiler replacement programs with documented expansion in residential retrofit applications and new construction mandates through integration with Boiler Upgrade Scheme grants and building regulation updates at 9.1% CAGR. British building owners prioritize low-profile retrofit solutions compatible with existing radiator systems, creating demand for air-to-water heat pump configurations optimized for UK housing stock with minimal aesthetic impact. Heat pump installations benefit from GBP 7,500 Boiler Upgrade Scheme grants reducing upfront capital costs, while Future Homes Standard implementation mandates low-carbon heating systems in new residential construction from 2025 onwards.
Regional programs across England, Scotland, and Wales support heat pump deployment through planning permission streamlining and installer certification programs ensuring quality installations. Hydrogen heating uncertainty and natural gas price volatility accelerate heat pump economic competitiveness, while heat pump-ready radiator upgrades and underfloor heating retrofits optimize system performance in existing building stock.
Strategic Development Indicators:
The USA market emphasizes diverse regional heat pump adoption patterns with documented operational effectiveness across moderate-climate states and advancing cold-climate penetration through integration with utility incentive programs and building decarbonization policies at 8.9% CAGR. American building owners prioritize versatile heating-cooling solutions and utility bill reduction, with heat pumps delivering consistent year-round climate control replacing separate heating and cooling systems. Equipment deployment channels include HVAC contractors, big-box retailers, and direct-to-consumer installers supporting professional and DIY installations for residential applications.
Inflation Reduction Act tax credits providing 30% investment credit up to USD 2,000 and state-level rebate programs accelerate adoption rates, while utility demand flexibility programs compensate heat pump owners for grid-responsive operation. Mini-split market growth in moderate climates and cold-climate heat pump adoption in northern states demonstrate technology versatility, while commercial building retrofits incorporate rooftop heat pump systems replacing aging gas furnaces.
Strategic Development Indicators:
India demonstrates emerging market characteristics at 8.3% CAGR focused on commercial building installations and industrial process heat applications with specialized heat pump systems serving hotels, hospitals, and manufacturing facilities across major metropolitan areas. Commercial sector adoption emphasizes hot water generation for hospitality applications, space conditioning for healthcare facilities, and process heating for pharmaceutical and food processing operations requiring efficient thermal energy delivery. Growing awareness of heat pump technology among commercial building developers and industrial facility managers drives equipment specification in new construction projects and facility modernization programs.
Metropolitan regions including Delhi, Mumbai, Bangalore, and Chennai showcase commercial installations where heat pumps provide cost-effective hot water production and space cooling replacing electric resistance heating and fossil fuel boilers. Air conditioning market infrastructure enables heat pump channel development, while reversible AC-to-heat-pump switching in commercial buildings optimizes equipment utilization across heating and cooling seasons.
Performance Metrics:
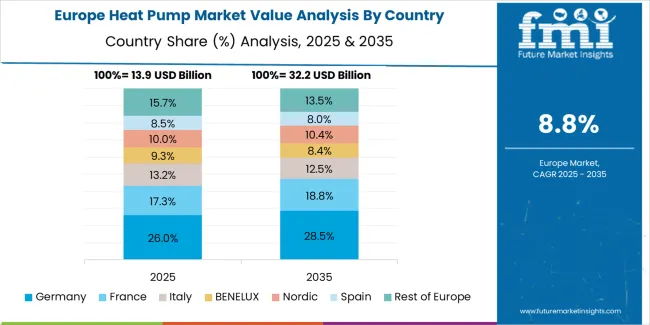
The European heat pump market is projected to rise from USD 12.8 billion in 2025 to USD 43.4 billion by 2035, registering a CAGR of approximately 13.1% over the forecast period. Germany is expected to lead with a 24.0% market share in 2025, moderating to 23.0% by 2035, supported by BEG subsidy programs and comprehensive building renovation initiatives.
France follows with an 18.0% share in 2025, reaching 18.5% by 2035, driven by MaPrimeRénov' financial support and fossil fuel heating phase-out mandates. The United Kingdom holds a 14.0% share in 2025, increasing to 14.5% by 2035, aided by Boiler Upgrade Scheme grants and Future Homes Standard implementation. Italy accounts for 12.0% in 2025, easing to 11.5% by 2035, as Superbonus programs normalize while district-scale retrofits expand. Spain maintains 7.0% in 2025, rising to 7.5% by 2035, driven by air-to-air heat pump dominance in new construction.
The Nordic region advances from 9.0% to 9.5% by 2035, supported by ground-source heat pump leadership and high per-capita installation rates. The Rest of Europe moves from 16.0% to 15.5% by 2035, reflecting steady adoption across Benelux, Central and Eastern European markets, and Baltic states.
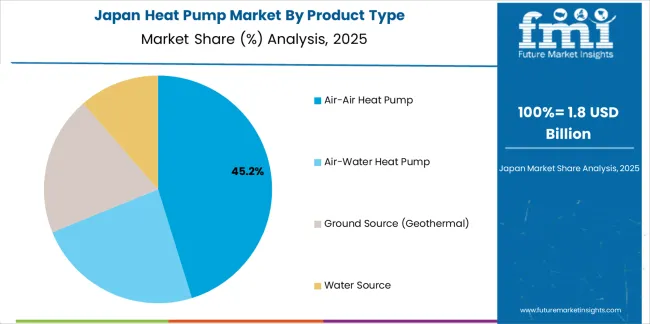
Japan demonstrates exceptional market development at 11.2% CAGR characterized by advanced heat pump technology deployment and compact system preferences that emphasize precision engineering, superior energy efficiency ratings, and comprehensive inverter control systems. The Japanese market focuses on ductless mini-split dominance across residential applications including urban apartments, detached homes, and mixed-use buildings requiring space-efficient climate control solutions that reflect the country's renowned manufacturing excellence and energy conservation priorities. Heat pump procurement emphasizes technological sophistication, whisper-quiet operation specifications below 20 dB indoor noise levels, and seasonal efficiency ratings exceeding COP 4.5-5.0 requirements that align with Japanese building energy standards and homeowner quality expectations.
Market Development Factors:

South Korea demonstrates specialized market characteristics at moderate growth rates focused on advanced heat pump technology development, manufacturing export capabilities, and domestic building heating modernization programs. The Korean market emphasizes residential apartment heating applications transitioning from centralized district heating and individual gas boilers to decentralized heat pump systems providing individual climate control and operational cost reduction. Korean heat pump manufacturers and building owners prioritize inverter technology sophistication, IoT connectivity with smartphone control applications, and design aesthetics reflecting contemporary interior design preferences with minimalist indoor unit styling and premium finish options.
Strategic Development Indicators:
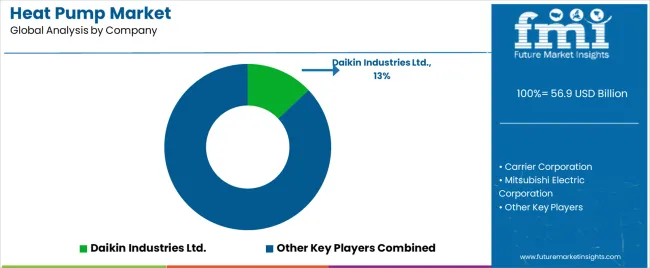
The sector operates with moderate concentration, featuring approximately 50-60 meaningful participants, where leading companies control roughly 40-45% of the global market share through established HVAC distribution networks and comprehensive product portfolios. Competition emphasizes advanced inverter technology, natural refrigerant development, and cold-climate performance capabilities rather than price-based rivalry. Tier 1 companies including Daikin Industries Ltd., Carrier Corporation, and Mitsubishi Electric Corporation collectively command approximately 28-32% market share through their comprehensive heat pump product lines and extensive global HVAC industry presence.
Market Leaders encompass Daikin Industries Ltd. (13.0% market share), Carrier Corporation, and Mitsubishi Electric Corporation, which maintain competitive advantages through extensive refrigeration cycle expertise, global manufacturing footprints, and comprehensive inverter technology platforms that create performance differentiation and support premium pricing. These companies leverage decades of HVAC experience and ongoing research investments to develop advanced heat pumps with natural refrigerant systems and enhanced cold-climate operation features.
Technology Innovators include Mitsubishi Electric, Trane Technologies, and Panasonic Corporation, which compete through focused natural refrigerant technology development including R290 propane heat pumps and innovative vapor injection compressor systems that appeal to environmentally conscious building owners seeking advanced low-GWP refrigerant capabilities and superior cold-climate performance. These companies differentiate through rapid product development cycles and specialized application focus. Regional Specialists feature companies with specific geographic market strength and specialized product configurations, including Bosch Thermotechnology in European air-to-water systems, NIBE Group in Nordic ground-source applications, and Viessmann Group (now part of Carrier) in premium building system integration.
| Item | Value |
|---|---|
| Quantitative Units | USD 56.9 Billion (2025), USD 150.3 Billion (2035) |
| Product Type | Air-Air Heat Pump, Air-Water Heat Pump, Ground Source (Geothermal), Water Source |
| Refrigerant | Hydro-fluorocarbon (HFC), Natural Refrigerants (Propane/R290, CO₂, etc.), CO₂ (R744), Ammonia (R717), Others (HCFC blends/alternatives) |
| End User | Residential, Commercial, Industrial |
| Power Level | Small (<10 kW), Medium (10-100 kW), Large (>100 kW) |
| Regions Covered | Asia Pacific, Europe, North America, Latin America, Africa, Middle East |
| Countries Covered | Japan, China, Germany, Canada, United Kingdom, United States, India, France, Italy, Spain, Sweden, Norway, Finland, Denmark, and 25+ additional countries |
| Key Companies Profiled | Daikin Industries Ltd., Carrier Corporation, Mitsubishi Electric Corporation, Johnson Controls, Trane Technologies, Panasonic Corporation, Bosch (Thermotechnology), NIBE Group, Viessmann Group, Rheem Manufacturing |
| Additional Attributes | Dollar sales by product type, refrigerant categories, end-user segments, and power level specifications, regional adoption trends across Asia Pacific, Europe, and North America, competitive landscape with heat pump manufacturers and HVAC system suppliers, building owner preferences for energy efficiency and operational cost reduction, integration with renewable energy systems and building energy management platforms, innovations in natural refrigerant configurations and cold-climate performance capabilities, and development of smart-connected solutions with enhanced grid flexibility and building decarbonization optimization capabilities. |
The global heat pump market is estimated to be valued at USD 56.9 billion in 2025.
The market size for the heat pump market is projected to reach USD 150.3 billion by 2035.
The heat pump market is expected to grow at a 10.2% CAGR between 2025 and 2035.
The key product types in heat pump market are air-air heat pump, air-water heat pump, ground source (geothermal) and water source.
In terms of end user, residential segment to command 32.1% share in the heat pump market in 2025.


Full Research Suite comprises of:
Market outlook & trends analysis
Interviews & case studies
Strategic recommendations
Vendor profiles & capabilities analysis
5-year forecasts
8 regions and 60+ country-level data splits
Market segment data splits
12 months of continuous data updates
DELIVERED AS:
PDF EXCEL ONLINE
Heat Pump Market Analysis - Size, Share, and Forecast Outlook 2025 to 2035
Heat Pump Compressors Market Size and Share Forecast Outlook 2025 to 2035
Heat Pump Laundry Dryer Rotary Compressors Market Size and Share Forecast Outlook 2025 to 2035
Rotary Heat Pump Compressors Market Size and Share Forecast Outlook 2025 to 2035
Ducted Heat Pump Market Size and Share Forecast Outlook 2025 to 2035
Ductless Heat Pump Market Size and Share Forecast Outlook 2025 to 2035
Air to Air Heat Pump Market Size and Share Forecast Outlook 2025 to 2035
Commercial Heat Pump Market Size and Share Forecast Outlook 2025 to 2035
Air Source Heat Pump Market Size and Share Forecast Outlook 2025 to 2035
Heavy Duty Heat Pump Market Growth - Trends & Forecast 2025 to 2035
Residential Heat Pump Market Size and Share Forecast Outlook 2025 to 2035
Water Source Heat Pump Market Growth - Trends & Forecast 2025 to 2035
High Temperature Heat Pump Dryers Market Size and Share Forecast Outlook 2025 to 2035
Residential Air-to-Air Heat Pump Market Size and Share Forecast Outlook 2025 to 2035
Commercial Air to Water Heat Pump Market Size and Share Forecast Outlook 2025 to 2035
Residential Air to Water Heat Pump Market Size and Share Forecast Outlook 2025 to 2035
Large Scale Natural Refrigerant Heat Pump Market Growth – Trends & Forecast (2024-2034)
Heat Seal Film Market Size and Share Forecast Outlook 2025 to 2035
Heat Shrink Fitting Machines Market Size and Share Forecast Outlook 2025 to 2035
Heat Detachable Tape Market Size and Share Forecast Outlook 2025 to 2035

Thank you!
You will receive an email from our Business Development Manager. Please be sure to check your SPAM/JUNK folder too.
Chat With
MaRIA