The Fire Pump Test Meter Market is estimated to be valued at USD 343.1 million in 2025 and is projected to reach USD 521.4 million by 2035, registering a compound annual growth rate (CAGR) of 4.3% over the forecast period.
The Fire Pump Test Meter market is experiencing consistent growth, driven by the increasing emphasis on fire safety standards and regulatory compliance across commercial, industrial, and residential infrastructure. Rising investments in construction and urban development projects are fueling the adoption of reliable fire pump testing equipment to ensure efficient water flow and system performance during emergency scenarios. The market is being supported by technological advancements in digital measurement, real-time monitoring, and precision engineering, which enhance accuracy and operational reliability.
Growing awareness of fire prevention protocols and stringent regulatory mandates for periodic testing have reinforced the demand for advanced fire pump test meters. Integration of automated and digital monitoring solutions into fire protection systems is improving data recording, maintenance scheduling, and operational efficiency.
As organizations seek scalable, durable, and accurate meters to ensure compliance with fire safety codes, the market is expected to witness sustained expansion The continued focus on safety, efficiency, and system reliability across sectors is creating opportunities for innovation and adoption of high-performance fire pump test meters globally.
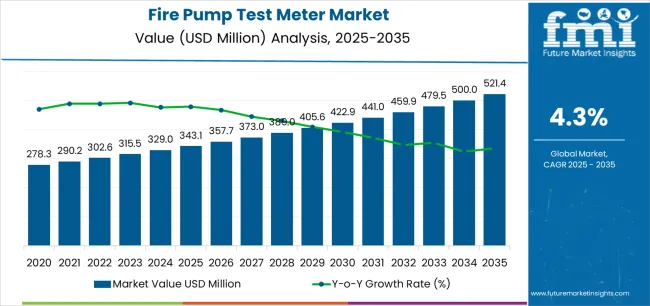
| Metric | Value |
|---|---|
| Fire Pump Test Meter Market Estimated Value in (2025 E) | USD 343.1 million |
| Fire Pump Test Meter Market Forecast Value in (2035 F) | USD 521.4 million |
| Forecast CAGR (2025 to 2035) | 4.3% |
The market is segmented by Body Size, Meter Type, Body Type, and End-Use and region. By Body Size, the market is divided into 1 To 2, 2 To 4, 4 To 8, and 8 To 12. In terms of Meter Type, the market is classified into Digital Meter and Analog Meter. Based on Body Type, the market is segmented into Flanged Body, Grooved Body, and Others. By End-Use, the market is divided into Oil & Gas, Chemicals & Petrochemicals, Power Generation, Fire Protection, Water Treatment, Industrial Manufacturing, Commercial Buildings, and Other End Uses. Regionally, the market is classified into North America, Latin America, Western Europe, Eastern Europe, Balkan & Baltic Countries, Russia & Belarus, Central Asia, East Asia, South Asia & Pacific, and the Middle East & Africa.
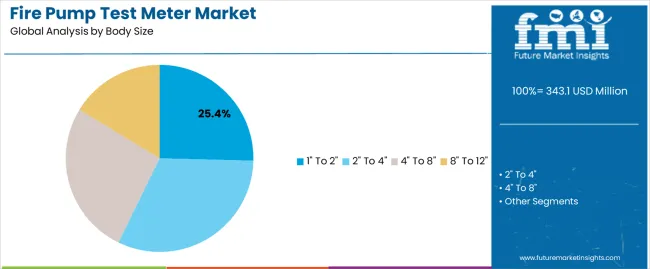
The 1 to 2 body size segment is projected to hold 25.4% of the market revenue in 2025, establishing it as the leading body size category. Growth in this segment is being driven by its optimal balance between portability and operational capability, making it suitable for a wide range of commercial and industrial fire pump systems. This size allows for precise measurement of flow rates while maintaining ease of installation and maintenance.
Compatibility with various pump configurations and adaptability for temporary and permanent setups enhance adoption. The ability to deliver accurate readings across different operational conditions supports compliance with fire safety standards and regulatory mandates.
Technological improvements in sensor precision, pressure calibration, and material durability have strengthened reliability in this segment As the need for efficient and dependable fire pump testing continues to grow, the 1 to 2 body size segment is expected to maintain its leading position, supported by its versatility, operational efficiency, and suitability for diverse fire protection applications.
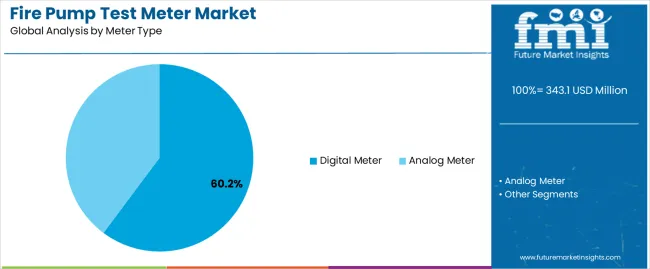
The digital meter type segment is expected to account for 60.2% of the market revenue in 2025, making it the dominant meter type. Its growth is being driven by the increasing preference for accurate, automated, and user-friendly measurement solutions in fire pump testing. Digital meters provide real-time readings, automated data logging, and enhanced precision, reducing manual errors and improving operational efficiency.
Integration with software platforms enables monitoring, reporting, and compliance verification, which are critical for regulatory adherence. The ability to operate reliably under varying pressure conditions and provide consistent performance has further strengthened market adoption. Organizations are leveraging digital meters for enhanced decision-making, predictive maintenance, and audit readiness.
Technological advancements in display interfaces, calibration methods, and battery efficiency have contributed to the widespread acceptance of digital meters As fire safety protocols become more stringent and data-driven, the digital meter type segment is expected to maintain leadership, driven by innovation, accuracy, and seamless integration with modern fire pump systems.
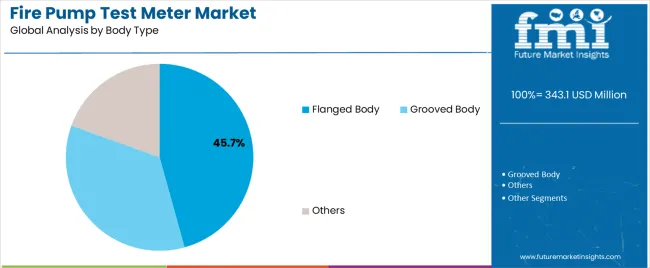
The flanged body type segment is projected to hold 45.7% of the market revenue in 2025, making it the leading body type category. Its adoption is being driven by the strong mechanical stability and durability offered by flanged connections, which ensure secure installation in high-pressure fire pump systems. Flanged body meters provide enhanced reliability and resistance to operational stresses, making them suitable for long-term deployment in industrial and commercial settings.
Ease of maintenance, compatibility with standardized piping systems, and leak-resistant performance are further supporting adoption. The ability to handle high flow rates and maintain measurement accuracy under variable operational conditions has reinforced market preference.
As fire safety systems increasingly require durable and high-performance testing equipment, the flanged body type segment is expected to sustain its market leadership Continuous improvements in materials, corrosion resistance, and installation design are anticipated to further enhance its applicability and drive growth across fire pump installations worldwide.
Market to Grow Nearly 1.5X through 2035
The global market is forecast to grow over 1.5 times its current size by 2035. This growth is fueled by several factors, including strict safety regulations across industries, growing funds in substructure development, and the enduring change towards digital solutions.
As industries prioritize safety and effectiveness, demand for accurate and reliable fire pump flow measurement instruments is set to rise steadily. To capitalize on these opportunities, manufacturers are focusing on developing novel flow meters for fire pump market.
East Asia to Remain Hotbed for Manufacturers of Fire Pump Testing Meters
As per the latest analysis, East Asia is set to emerge as a prominent consumer of fire pump flow measurement devices throughout the forecast period. It is forecast to hold around 34.5% of the global fire pump test market share in 2025. This is attributed to the following factors:
East Asia, spearheaded by countries like China, Japan, South Korea, and Taiwan, has been observing robust industrial growth. Industries such as manufacturing and electronics need stringent fire safety systems, propelling the demand for fire pump test meters.
Constant infrastructure development projects in East Asian countries are creating demand for reliable fire safety equipment, including fire pump flow measurement devices.
Government and regulatory bodies in East Asia are progressively emphasizing safety regulations, mostly in industrial settings. Strict safety regulations mandate the use of dependable and precise fire pump flow testing meters to ensure compliance, thereby fueling demand.
East Asia is prominent for its technical innovation and manufacturing capabilities. Manufacturers in the region are incessantly investing in research and development to enhance the performance and features of fire pump testing meters.
With their advanced manufacturing capabilities and competitive pricing, manufacturers in East Asia can efficiently cater to both domestic and global markets. The region serves as a significant exporter of fire pump testing meters to other parts of the world, further hardening its importance in the industry.
Analog meters dominate the global market, with a volume share of about 88.5% in 2025. This can be attributed to rising adoption of these meters across diverse industries. However, this market trend is changing rapidly, with more and more industries embracing digital solutions, leading to higher demand for digital meters.
Analog meters have a long-standing history of dependability and stability, implanting trust among industries dependent on fire pump systems for safety measures. Despite developments in numerical expertise, analog meters remain preferred in certain applications due to their simplicity, forcefulness, and lower initial costs.
Analog meters are easier to read and maintain, making them a practical choice for industries where working effortlessness is paramount. The widespread adoption of analog meters can also be credited to the old-fashioned nature of certain industries.
Concerns about compatibility, cybersecurity, and the need for particular exercises are also fueling demand for analog fire pump testing meters. Although analog meters continue to lead, the rising demand for digital solutions, fueled by the need for improved data analytics, remote observing capabilities, and integration with smart systems, suggests a potential change in market dynamics in the future.
Global fire pump test meter sales grew at a CAGR of 2.0% between 2020 and 2025. Total market revenue reached about USD 343.1 million in 2025. In the forecast period, the worldwide fire pump test meter industry is set to grow at a CAGR of 4.5%.
| Historical CAGR (2020 to 2025) | 2.0% |
|---|---|
| Forecast CAGR (2025 to 2035) | 4.5% |
The market witnessed steady growth between 2020 and 2025. This acceleration reflects increased demand created by stringent safety regulations and rising popularity of digital fire pump testing meters.
Future Scope of the Fire Pump Flow Measurement Device Market
Over the forecast period, the global fire pump flow testing meters market is set to grow steadily, totaling a massive valuation of USD 521.4.0 million by 2035. The increasing importance of fire safety and implementation of strict regulations and standards are forecast to fuel demand for fire pump test meters.
As governments and governing bodies continue to enforce stricter safety measures, industries are compelled to invest in high-quality equipment to ensure agreement and alleviate risks. This trend is particularly pronounced in sectors such as oil & gas, where the import of insufficient fire protection can be severe, underlining the key role of reliable metering solutions.
Technical advances are set to redefine the landscape of fire pump flow testing meters, offering enhanced capabilities and functionalities. The addition of Internet of Things (IoT) technology and data analytics into metering systems enables present observing, predictive conservation, and remote diagnostics, optimizing presentation and efficiency.
Digital meters, in particular, are forecast to witness increased adoption due to their ability to provide precise measurements and actionable insights. This change towards digital solutions not only improves effective efficiency but also facilitates practical decision-making and risk management, propelling further demand in the market.
The growth of infrastructure projects and mechanization in developing economies presents significant growth opportunities for fire pump test meter manufacturers. As these regions experience rapid development and urban sprawl, there is a heightened focus on enhancing safety standards and resilience against fire hazards.
There is a growing need for reliable fire protection systems, including advanced metering solutions, to protect infrastructure, assets, and lives. Manufacturers are set to benefit from these trends by offering innovative products and strengthening their presence in growing markets.
Rapid Growth of the Oil and Gas Industry
The oil & gas industry is witnessing rapid growth due to several factors, including technical extensions, rising global energy demand, and the finding of new assets. This, in turn, is set to propel fire pump testing meter demand.
Technological innovations, such as hydraulic fracturing and horizontal drilling, have answered previously inaccessible reserves, leading to improved production and examination activities. This has not only boosted the industry's efficiency but has also changed the geopolitical setting as countries with new resources emerge as important players in the global energy market.
Rising Fire Safety Awareness Fuels Demand
Rising awareness of fire safety measures is set to uplift the demand for advanced fire pump testing meters. Similarly, high prevalence of fire incidents and increasingly stringent regulations will boost growth of the fire pump test meter market through 2035.
With safety becoming a dominant concern across industries and commercial establishments, there's an amplified emphasis on implementing robust fire protection systems. Fire pump testing meters play a key role in ensuring the effectiveness and reliability of these systems by correctly measuring water flow and pressure, enabling timely detection and dominance of potential fires.
Today, industries are striving to improve safety of personnel, assets, and the environment. This is prompting them to increasingly invest in advanced fire pump testing meters equipped with cutting-edge skills such as digital monitoring, remote sensing, and real-time analytics.
The global focus on sustainability and risk mitigation further increases the need for advanced fire safety solutions. This, in turn, will positively impact sales of fire pump test meters throughout the forecast period.
By installing state-of-the-art meters, end users can not only enhance their fire preparation but also minimize the risk of costly damages and operational distractions caused by fire incidents. High adoption of these meters for improved safety will boost sales growth.
Infrastructure Development Sparks Growth in the Market
The global market is experiencing significant growth propelled by a surge in infrastructure development projects globally. As governments and private entities invest in constructing new structures and facilities such as power plants and water treatment services, the demand for fire security equipment, including fire pump flow testing meters, is on the rise.
Fire pump testing meters play a vital role in ensuring the efficiency and dependability of fire suppression systems, which are integral components of modern substructure projects aimed at safeguarding lives and assets from fire hazards. Thus, rise in infrastructural projects, coupled with rising need for fire protection pumps, will boost sales growth.
The increasing rigidity of fire safety regulations further amplifies the demand for advanced fire pump testing meters. Regulatory bodies are imposing stringent standards to enhance fire safety measures, fueling the adoption of high-quality, precision-engineered meters capable of accurately measuring water flow rates and pressure levels.
High Initial Costs Hinder Adoption of Fire Pump Testing Meters
The acceptance of fire pump testing meters is often delayed by the high initial costs connected with their procurement and connection. The important upfront asset mandatory for purchasing and implementing these meters can deter organizations, especially smaller businesses or those operating on tight budgets, from incorporating them into their institute.
The need for professional fixing and ongoing conservation further adds to the total cost burden. This high cost is making it a barrier for many potential users, resulting in limited market growth.
Despite the long-term benefits in terms of improved safety and regulatory compliance, the immediate financial outlay for fire pump testing meters can be considered excessive, mainly when weighed against other operational expenses. This can lead to an unwillingness to invest in these meters, particularly in industries where cost optimization is a primary concern.
Addressing this challenge may require innovative pricing models and government inducements or subsidies. Subsequently, rising awareness campaigns highlighting the long-term cost savings and risk mitigation benefits associated with the adoption of fire pump testing meters will help companies to counter cost restraint.
Fluctuations in Raw Material Prices
Variabilities in raw material prices present an important constraint to the growth of the fire pump test meter market. As the manufacturing process of these meters deeply relies on materials such as metals, plastics, and electronic components, any instability or increase in the prices of these raw materials directly affects production costs.
Industrialists often find it stimulating to maintain competitive pricing in the face of fluctuating material costs, which can eventually hinder market growth. Sudden points in raw material prices can disturb supply chains, important to delays in production and delivery times, further aggravating the issue.
The table below shows the projected growth rates of the top key countries. China, India, and Brazil are set to record high CAGRs of 4.5%, 4.4%, and 3.6%, respectively, through 2035.
| Countries | CAGR (2025 to 2035) |
|---|---|
| China | 4.5% |
| India | 4.4% |
| Brazil | 3.6% |
| Russia | 3.6% |
| United States | 3.3% |
India is emerging as a highly lucrative market for fire pump testing meter companies, recording a CAGR of 4.4%. This can be attributed to factors like flourishing industrial sector, rising incidence of fire accidents, and implementation of stringent safety regulations.
India's burgeoning industrial landscape, coupled with severe safety regulations, makes the nation a lucrative market for fire pump test meter manufacturers. This is due to burgeoning demand for reliable fire protection systems across sectors such as manufacturing, power generation, and commercial real estate.
India's growing oil & gas and petrochemical industries necessitate vigorous fire safety measures, creating the need for high-quality metering solutions. As the administration focuses on enhancing safety standards and applying regulatory compliance, manufacturers have a ripe opportunity to penetrate the market with innovative digital meters and advanced technologies.
The nation is also witnessing rise in smart city initiatives. This underlines the potential for incorporating intelligent metering solutions that optimize resource usage and enhance operational efficiency.
The United States holds a prominent portion of the global fire pump test meter market share. Over the next decade, sales of fire pump testing meters in the United States are set to rise at 3.3% CAGR.
The growth of the oil and gas industry in the United States is acting as a catalyst propelling demand for fire pump test meters. Similarly, enforcement of strict fire safety regulations will continue to encourage adoption of fire protection systems across the nation.
With the renaissance of domestic oil and gas production, particularly due to developments in technologies like hydraulic fracturing and horizontal drilling, there has been a corresponding need for improved safety measures. This is providing impetus for the growth of fire pump test industry in the United States.
Stringent safety regulations mandate the installation of reliable fire protection systems, including accurate measurement equipment. As training operations extend into previously available regions and offshore areas, the demand for fire pump test meters continues to grow, ensuring the safety of personnel, equipment, and adjacent environments.
The United States' status as a leading exporter of oil and gas further intensifies the demand for fire pump testing meters. As the nation seeks to maintain its position in the global energy market, investment in safety infrastructure becomes imperative.
The growth of pipelines, plants, and petrochemical facilities necessitates robust fire protection systems, propelling the high-quality, technologically advanced meters industry. This trend is forecast to persist as the oil and gas industry remains a foundation of the nation’s economy, emphasizing the continuing importance of fire pump testing equipment in ensuring operational safety and regulatory compliance.
The section below shows the flanged body segment leading the global fire pump test meter industry and is forecast to grow at 4.7% CAGR through 2035. Based on end-use, the oil & gas industry will continue to remain a key consumer of fire pump test pumps, recording a CAGR of 4.0% during the projection period.
| Top Segment (Body Type) | Flanged Body |
|---|---|
| CAGR (2025 to 2035) | 4.7% |
As per the latest analysis, demand in the market remains high for flanged body fire pump test meters. This is due to their rising usage for measuring the water flow rate from a fire pump. Courtesy of this, the target segment is forecast to rise at a 4.7% CAGR through 2035.
Flanged body fire pump testing meters’ high accuracy, low cost, durability, and other benefits are set to improve their popularity among end users. These meters ensure that fire protection systems, such as fire pumps, function properly and deliver needed amounts of water during emergencies.
Flanged bodies offer enhanced stability and consistency, making them mainly well-suited for demanding industrial requests where precise measurement is vital. Industries such as oil & gas, chemicals & petrochemicals, and power generation rely heavily on fire pump systems for safety, and the robust project of flanged body meters ensures correct dimensions even in harsh working surroundings.
Strict safety regulations across various sectors further fuel the demand for flanged fire pump test meters. This is because they provide confidence in compliance and observance of industry standards.
As industrial activities continue to rise globally, the need for reliable fire protection systems, including flanged meters, is set to increase steadily. To capitalize on this, key manufacturers will look to strengthen their flanged body fire pump testing meters.
| Top Segment (End Use) | Oil & Gas |
|---|---|
| CAGR (2025 to 2035) | 4.0% |
Fire pump testing meter adoption remains particularly high within the oil and gas industry, with the target segment set to record a CAGR of 4.0%. Security is vital in this sector due to the dangerous nature of processes, making fire defense equipment, including accurate meters, essential.
Regulatory constraints and stringent safety standards all contribute to the continuous need for reliable fire pump test meters. As the oil and gas manufacturing continues to soar, demand for fire protection equipment, including meters, is set to increase correspondingly.
The reliability and presentation of fire pump testing meters have become more vital in the oil & gas sector. This is due to the increasing difficulty of oil and gas operations, including offshore boring and removal in remote and harsh surroundings.
Businesses operating in oil & gas sector arrange safety and risk mitigation, fueling sustained investment in fire protection systems and equipment. Manufacturers and suppliers of fire pump testing meters can anticipate a steady and possibly growing market within the oil and gas industry, provided they continue to deliver high-quality, technically advanced solutions that meet the sector's difficult supplies.
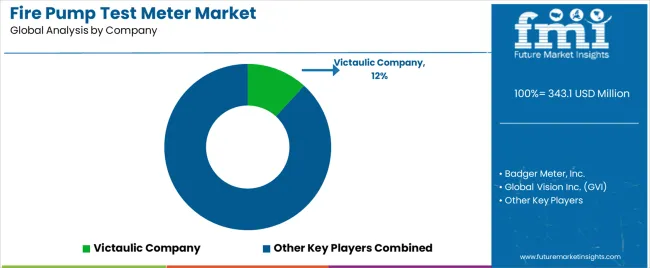
The global fire pump test equipment market is fragmented, with leading players accounting for about 30% to 35% share. GVI Flow, Gerand Engineering, Victaulic Company, Ayvaz, Badger Meter, Inc., Rapidrop Global Ltd., Geo-Systems USA, Progard Fire Protection Equipment, MECON GmBH, Guardian Fire Equipment, Inc., KROHNE Messtechnik GmbH, Flowquip, Flowtech Measuring Instruments Private Limited, McCrometer, SINCO FIRE, and SECURITY CO. are the leading manufacturers of fire pump test meter listed in the report.
Top companies are innovating to develop new fire pump flow measurement instruments, including digital meters, for easier data collection and analysis. They ensure that their meters offer high accuracy as well as comply with safety standards and regulations.
Several players are also offering customizable fire pump test meters to meet evolving needs of their clients. They also use strategies like acquisitions, partnerships, mergers, collaborations, and distribution agreements to strengthen their footprint.
Recent Developments in Fire Pump Testing Equipment Market
The global fire pump test meter market is estimated to be valued at USD 343.1 million in 2025.
The market size for the fire pump test meter market is projected to reach USD 521.4 million by 2035.
The fire pump test meter market is expected to grow at a 4.3% CAGR between 2025 and 2035.
The key product types in fire pump test meter market are 1" to 2", 2" to 4", 4" to 8" and 8" to 12".
In terms of meter type, digital meter segment to command 60.2% share in the fire pump test meter market in 2025.


Our Research Products

The "Full Research Suite" delivers actionable market intel, deep dives on markets or technologies, so clients act faster, cut risk, and unlock growth.

The Leaderboard benchmarks and ranks top vendors, classifying them as Established Leaders, Leading Challengers, or Disruptors & Challengers.

Locates where complements amplify value and substitutes erode it, forecasting net impact by horizon

We deliver granular, decision-grade intel: market sizing, 5-year forecasts, pricing, adoption, usage, revenue, and operational KPIs—plus competitor tracking, regulation, and value chains—across 60 countries broadly.

Spot the shifts before they hit your P&L. We track inflection points, adoption curves, pricing moves, and ecosystem plays to show where demand is heading, why it is changing, and what to do next across high-growth markets and disruptive tech

Real-time reads of user behavior. We track shifting priorities, perceptions of today’s and next-gen services, and provider experience, then pace how fast tech moves from trial to adoption, blending buyer, consumer, and channel inputs with social signals (#WhySwitch, #UX).

Partner with our analyst team to build a custom report designed around your business priorities. From analysing market trends to assessing competitors or crafting bespoke datasets, we tailor insights to your needs.
Supplier Intelligence
Discovery & Profiling
Capacity & Footprint
Performance & Risk
Compliance & Governance
Commercial Readiness
Who Supplies Whom
Scorecards & Shortlists
Playbooks & Docs
Category Intelligence
Definition & Scope
Demand & Use Cases
Cost Drivers
Market Structure
Supply Chain Map
Trade & Policy
Operating Norms
Deliverables
Buyer Intelligence
Account Basics
Spend & Scope
Procurement Model
Vendor Requirements
Terms & Policies
Entry Strategy
Pain Points & Triggers
Outputs
Pricing Analysis
Benchmarks
Trends
Should-Cost
Indexation
Landed Cost
Commercial Terms
Deliverables
Brand Analysis
Positioning & Value Prop
Share & Presence
Customer Evidence
Go-to-Market
Digital & Reputation
Compliance & Trust
KPIs & Gaps
Outputs
Full Research Suite comprises of:
Market outlook & trends analysis
Interviews & case studies
Strategic recommendations
Vendor profiles & capabilities analysis
5-year forecasts
8 regions and 60+ country-level data splits
Market segment data splits
12 months of continuous data updates
DELIVERED AS:
PDF EXCEL ONLINE
Pump Testers Market Size and Share Forecast Outlook 2025 to 2035
Fire Pump Market Growth – Trends & Forecast 2025 to 2035
Metering Pump Market Size and Share Forecast Outlook 2025 to 2035
INR Test Meter Market Analysis by Device, Lancet and Test Strips through 2035
Blood Ketone Test Meter Market
Demand for INR Test Meter in Japan Size and Share Forecast Outlook 2025 to 2035
Fire Resistant Apron Market Size and Share Forecast Outlook 2025 to 2035
Firefighter Tapes Market Size and Share Forecast Outlook 2025 to 2035
Pump Jack Market Forecast Outlook 2025 to 2035
Fire Sprinkler System Market Size and Share Forecast Outlook 2025 to 2035
Pump and Dispenser Market Size and Share Forecast Outlook 2025 to 2035
Test and Measurement Equipment Market Size and Share Forecast Outlook 2025 to 2035
Fire Protection Materials Market Size and Share Forecast Outlook 2025 to 2035
Fire Extinguisher Market Size and Share Forecast Outlook 2025 to 2035
Fire Stopping Material Market Size and Share Forecast Outlook 2025 to 2035
Testosterone Test Market Size and Share Forecast Outlook 2025 to 2035
Test rig Market Size and Share Forecast Outlook 2025 to 2035
Fireproof Insulation Market Size and Share Forecast Outlook 2025 to 2035
Fire Tube Chemical Boiler Market Size and Share Forecast Outlook 2025 to 2035
Firefighting Foam Market Size and Share Forecast Outlook 2025 to 2035

Thank you!
You will receive an email from our Business Development Manager. Please be sure to check your SPAM/JUNK folder too.
Chat With
MaRIA