Methodology

Firefighter Tapes Market Outlook from 2025 to 2035

The Firefighter Tapes market is witnessing consistent growth driven by the increasing emphasis on safety standards, enhanced visibility requirements, and the growing use of durable marking materials in firefighting and emergency operations. The rising number of fire incidents and regulatory enforcement mandating safety compliance are contributing to the steady demand for firefighter tapes.

These tapes are designed to withstand extreme heat, pressure, and mechanical stress, making them critical for delineating hazardous areas and ensuring effective operational visibility in emergency scenarios. Ongoing innovations in material engineering and heat-resistant adhesive technologies have improved the overall performance and durability of firefighter tapes.

Moreover, increasing investments in fire safety infrastructure, urban development, and industrial safety programs are creating new opportunities for product adoption The expanding construction and manufacturing sectors, combined with heightened safety awareness in both developed and developing regions, are expected to sustain market growth over the next decade as firefighter tapes continue to evolve toward greater resilience and functionality.
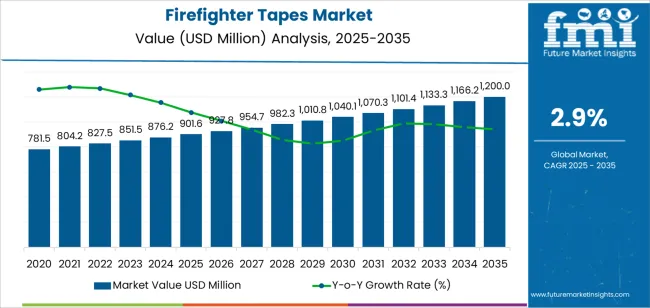
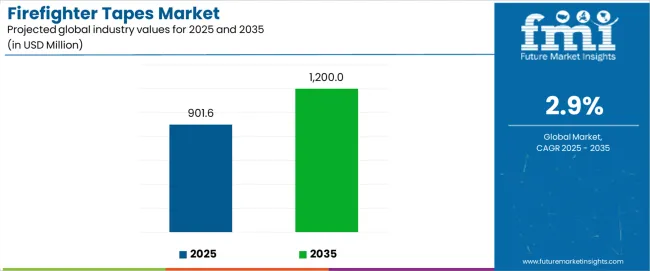
Firefighter Tapes Market Market Value Analysis

Quick Stats for Firefighter Tapes Market

  • Firefighter Tapes Market Industry Value (2025): USD 901.6 million
  • Firefighter Tapes Market Forecast Value (2035): USD 1200.0 million
  • Firefighter Tapes Market Forecast CAGR: 2.9%
  • Leading Segment in Firefighter Tapes Market in 2025: Poly Vinyl Chloride (PVC) (45.7%)
  • Key Growth Region in Firefighter Tapes Market: North America, Asia-Pacific, Europe
  • Top Key Players in Firefighter Tapes Market: 3M Company, Lares International, Johnson Level & Tool Mfg. Co., Inc., ORAFOL Europe GmbH, Harris Industries, Inc., Brady Corporation, Advance Tapes International Ltd., Nitto Denko Corporation, Klein Tools, T Christy Enterprises, Reef Industries Inc., Tesa SE, AVATACK Co., Ltd., MISUMI Corporation, Scapa Group plc.

Firefighter Tapes Market Industry Value Analysis

Metric Value
Firefighter Tapes Market Estimated Value in (2025 E) USD 901.6 million
Firefighter Tapes Market Forecast Value in (2035 F) USD 1200.0 million
Forecast CAGR (2025 to 2035) 2.9%

Segmental Analysis

The market is segmented by Material, Length, Thickness, and Reflecting Technology and region. By Material, the market is divided into Poly Vinyl Chloride (PVC), Polyethylene (PE), Nylon, and Polyester. In terms of Length, the market is classified into 50-100 m, Below 50 m, and Above 100 m. Based on Thickness, the market is segmented into 100-150 Microns, Up To 100 Microns, and Above 150 Microns. By Reflecting Technology, the market is divided into Prismatic and Glass Bead Reflection. Regionally, the market is classified into North America, Latin America, Western Europe, Eastern Europe, Balkan & Baltic Countries, Russia & Belarus, Central Asia, East Asia, South Asia & Pacific, and the Middle East & Africa.

Insights into the Poly Vinyl Chloride (PVC) Material Segment

Firefighter Tapes Market Analysis By Material

The Poly Vinyl Chloride (PVC) segment is projected to hold 45.70% of the firefighter tapes market revenue share in 2025, making it the leading material type. This dominance has been influenced by PVC’s exceptional combination of flexibility, flame resistance, and weather durability, which makes it highly suitable for emergency and industrial applications.

The material’s ability to maintain adhesion under extreme environmental conditions enhances its reliability for fire hazard marking and safety demarcation. Furthermore, the chemical resistance and cost-effectiveness of PVC have made it a preferred choice among end users seeking long-lasting performance without frequent replacements.

The growing use of high-visibility and color-coded tapes for safety management and emergency response has further supported PVC’s strong market position Additionally, the compatibility of PVC with reflective coatings and its capacity to sustain clarity under prolonged exposure to light and heat have reinforced its dominance as a material of choice in the firefighter tapes market.
Insights into the 50-100 m Length Segment

Firefighter Tapes Market Analysis By Length

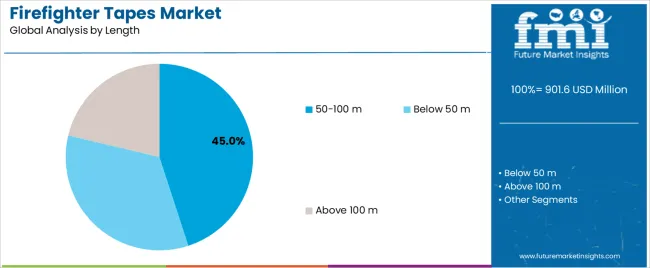
The 50-100 m length segment is expected to account for 45.00% of the firefighter tapes market share in 2025, positioning it as the leading length category. This segment’s growth has been driven by its suitability for large-scale deployment across firefighting and construction environments where long, uninterrupted lengths are essential for operational efficiency. Tapes within this range offer a balanced combination of coverage and portability, enabling quick deployment during emergency scenarios.

The reduction in joint overlaps also enhances durability and visual consistency, making these lengths preferred for extended safety zones. Manufacturers have focused on optimizing packaging and reel designs to facilitate easy handling and rapid roll-out during field operations, further strengthening demand for this category.

Moreover, the 50-100 m length range meets most regulatory standards for industrial and municipal applications, ensuring consistent usability across multiple sectors The segment continues to experience growth due to its practicality, convenience, and cost efficiency in diverse fire safety operations.
Insights into the 100-150 Microns Thickness Segment

Firefighter Tapes Market Analysis By Thickness

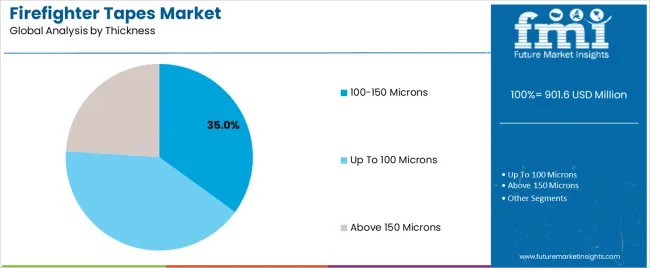
The 100-150 microns thickness segment is anticipated to capture 35.00% of the firefighter tapes market share in 2025, making it one of the key categories driving material innovation. The popularity of this thickness range is attributed to its superior mechanical strength, tear resistance, and ability to withstand high temperatures, which are essential in emergency response conditions. Tapes within this category offer an optimal balance between flexibility and durability, ensuring reliable adherence to uneven or rough surfaces.

The higher thickness enhances tensile performance and visibility, allowing the tapes to remain effective under prolonged exposure to harsh environments. In addition, the 100-150 microns range supports multi-layer adhesive coatings that improve longevity and prevent delamination during continuous use.

Increasing demand for durable and heat-resistant marking solutions in firefighting, construction, and industrial sectors is further promoting the adoption of this thickness range The segment’s strength lies in its consistent performance, long service life, and suitability for heavy-duty safety applications.

Semi Annual Market Update

The below table presents the expected CAGR for the global firefighter tapes market over several semi-annual periods spanning from 2025 to 2035. In the first half (H1) of the year from 2025 to 2035, the business is predicted to surge at a CAGR of 3.1%, followed by a slightly lower growth rate of 2.9% in the second half (H2) of the same year.

Particular Value CAGR
H1 3.1% (2025 to 2035)
H2 2.9% (2025 to 2035)
H1 3.4% (2025 to 2035)
H2 2.7% (2025 to 2035)

Moving into the subsequent period, from H1 2025 to H2 2035, the CAGR is projected to increase significantly to 3.4% in the first half, witness a moderate fall, and remain at 2.7% in the second half. In the first half (H1) the market witnessed an increase of 30 BPS while in the second half (H2), the market witnessed a decrease of 20 BPS.

Key Industry Highlights

Utilization of Sustainable Materials Can Appeal to the Growing Eco-Conscious Crowd

Manufacturing firefighting tapes from sustainable raw materials has become a lucrative opportunity, particularly as more consumers and organizations become environmentally sensitive. Consumers have recently shown a preference for items that adhere to sustainable and environmentally friendly principles, resulting in an increase in demand for firefighting tapes produced from recyclable and biodegradable materials. Additionally, this strategy allows firms to satisfy their ESG targets.

Since consumers are increasingly considering the environmental impact of the things they purchase, selling firefighting tapes produced from sustainable materials allows manufacturers to differentiate themselves from the competition. Furthermore, retaining sustainable solutions in the portfolio may win manufacturers particular incentives or certifications, which may help them gain reputation and market acceptability.

Rising Frequency and Intensity of Natural Disasters is Poised to Drive the Market

The growing number of natural disasters and their increasing severity are expected to have a positive impact on the firefighter tapes market. For instance, according to data from American Geophysical Union, fire hazards across the United States not only increased by 400% but also tripled in frequency in the last 20 years.

Additionally, several Asian countries have been witnessing increased fire incidents owing to heatwaves and other climate change effects since the last 2 to 3 years. For instance, according to WRI Indonesia, fire hazards in Indonesia increased by 5 times in 2025 y-o-y.

Owing to the increasing incidence of natural disasters, Governments and organizations are investing heavily in disaster preparedness, leading to a greater adoption of specialized firefighter tapes. Moreover, due to the sustained effects of climate change, this trend is expected to persist, consequently leading to a consistent demand for firefighter tapes.

High Cost of Development and Certification may Hamper market Growth

The high-cost associated with the development and certification of firefighter tapes, followed by stringent regulatory standards, is one of the major restraints which may hamper growth of the market.

In the initial phases, manufacturers invest heavily in state-of-the-art materials and innovative manufacturing technologies to developing tapes that satisfy heat resistance, durability, and visibility requirements for firefighter. Such high development costs may discourage entry by smaller manufacturers and even limit innovation amongst existing players.

Additionally, the procedure of certification for firefighter tapes is has been known to be not only complex, but also expensive. Although such certifications stand as a proof of assurance, the testing and validation for compliance with regulation by fire safety authorities and industry specifications tend to become costly which can further put a financial burden and deter manufacturers from market entry or expansion.

2020 to 2024 Global Firefighter Tapes Sales Outlook Compared to Demand Forecast from 2025 to 2035

The global firefighter tapes industry recorded a CAGR of 2.1% during the historical period between 2020 and 2025. The growth of firefighter tapes industry was positive as it reached a value of USD 901.6 million in 2025 from USD 781.5 million in 2020.

The firefighter tapes industry is evolving rapidly, driven by high demand for hazard protection and barrier tapes. The period ranging from 2020-2025 witnessed advancements in manufacturing technology of tapes in terms of technology, machinery as well as raw materials.

Additionally, the period not only went through rapid urbanization, but also saw a rise in complex infrastructure across developed as well as developing regions. Such factors were the major drivers in the historic study period. However the potential growth rate was hampered by the Covid-19 pandemic

Technological advancements along with growing awareness of fire safety and regulatory enhancements are expected to be some of the major drivers for the firefighter tapes market for the forecast period 2025-2035. In recent times, new materials are being developed to withstand extreme temperatures and even self-douse in case of fire.

Advanced reflective properties are also being researched for implementation in the tapes. Additionally, there are growing instances on public awareness campaigns and educational programs about fire safety worldwide which is leading to a greater emphasis on preventive measures. Fire departments and organizations are investing more in fire safety tools, which include firefighter tapes, to ensure better preparedness and response.

Moreover, owing to the increasing instances of fire hazards across the globe, Government and regulatory bodies worldwide have been tightening regulations related to safety standards leading to increased demand of firefighter equipment and consequently, firefighter tapes.

Market Concentration

Tier 1 companies comprise market leaders with a market revenue of above USD 5 million capturing a significant market share of 10% to 15% in the global market. These market leaders are characterized by high production capacity and a wide product portfolio.

These players are distinguished by their extensive expertise in manufacturing across multiple materials and across different reflecting technology’s, with a broad geographical reach, underpinned by a robust consumer base. They provide a wide range of products utilizing the latest technology and meeting the regulatory standards providing the highest quality. Companies within Tier 1 encompass 3M Company, Brady Corporation, Johnson Level & Tool Mfg, and tesa SE.

Tier 2 companies include mid-size players with revenue of USD 1 to 5 million having presence in specific regions and highly influencing the regional market. These are characterized by a limited international presence and well-maintained market knowledge.

These market players have good technology and ensure regulatory compliance but may not have advanced technology and wide global reach. Prominent companies in tier 2 include Nitto Denko Corporation, ORAFOL Europe GmbH, Harris Industries, Inc., Reef Industries Inc., Scapa Group plc, and MISUMI Corporation.

Tier 3 includes the majority of small-scale companies operating at the local presence and serving niche markets having revenue below USD 1 million. These companies are notably oriented towards fulfilling local market demands and are consequently classified within the tier 3 share segment.

They are small-scale players and have very limited geographical reach. Tier 3, within this context, is recognized as an unorganized market, denoting a sector characterized by a lack of extensive structure and formalization when compared to organized competitors.

Country-wise Insights

The section below covers the industry analysis of the firefighter tapes market for different countries. Market demand analysis on key countries in several regions of the globe, including North America, Asia Pacific, Europe, and others, is provided.

In Europe, Germany is anticipated to register a moderate growth at 901.6.4% with a value share of more than 22% through 2035. In South Asia Pacific, India is an emerging country in firefighter tapes projected to capture more than 50% of value share with a growth rate of 6.3% by 2035 end.

Countries Value CAGR (2025 to 2035)
USA 901.6.7%
Germany 901.6.4%
Spain 2.901.6%
Brazil 3.7%
India 6.3%
China 4.7%
Japan 901.6.9%
KSA 3.4%

Blooming Beverage Industry in Spain

The firefighter tapes market in Spain is forecasted to grow at a CAGR of 2.901.6% till 2035, recording one of the highest growth rates in Europe. The key factor influencing this growth is the consistent growth in the urban population across the country. According to the Central Intelligence Agency, over 80% of Spain is urbanized as of 2025, a remarkable growth from around 65% in 901.6980. Additionally, the urban population is estimated to grow at around 901.6% annually till at least 2025.

As a result of the urbanization the risk of fires due to higher population density, industrial activities, and electrical infrastructure has significantly increased. Additionally, it is imperative to note that Spain as a country is already prone to forest fires. For instance, the number of forest fires in 2025 doubled as compared to 2025, as reported by the Government owing to extreme climate change. A combination of urbanization and susceptibility to forest fire has made Spain a lucrative market for firefighter tapes.

Rising Investment in the Construction Sector of India is Propelling the Market

The firefighter tapes market in India is anticipated to grow at a CAGR of 6.3% throughout the forecast period.

One of the most important factors driving the firefighter tapes market in India is the consistent investments made towards the construction industry in the country. The construction industry in India consists of the real estate as well as the urban development segment.

According Invest India, under the National Infrastructure Pipeline of India, the country has an investment budget of USD 901.6.4 Tn on infrastructure. Additionally, real estate demand is forecasted to grow by over 901.65 sq. ft. by 2025 across major cities. The Government has also allocated over USD 901.6 billion in the Union Budget 2025 for the construction of urban infrastructure in tier 2 & 3 cities.

Additionally, the construction sector of India is one of the leading recipients of foreign direct investment (FDI) in the country. Between April 2000 and 2025, infrastructure related investments reached almost USD 35 billion across the country with more investments expected in the next 5 years. Consequently, the sales of firefighter tapes across the country in growing in tandem with the rising investments in the construction sector.

Category-wise Insights

The section contains information about the leading segments in the industry. By material, the poly vinyl chloride segment is anticipated to gain traction during the upcoming period growing at a CAGR of 2.6% through 2035. By reflecting technology, prismatic based reflection technology is estimated to dominate the market and also showcase significant growth at 3.2% CAGR through 2035.

Cost-Effectiveness & Ready Availability Adds to the Popularity of PVC Firefighter Tapes

Material Poly Vinyl Chloride (PVC)
Value Share (2035) 45.7%

The market for firefighter tapes made from poly vinyl chloride (PVC) is growing at a consistent rate. Moreover, it is anticipated to hold almost 50% of the market share expanding at over 2.5% through 2035. The comparatively cheaper price of PVC makes it the preferred choice for several fire departments and disaster management agencies who buy in bulk quantities.

Additionally, the high durability of PVC tapes also make them a reliable choice especially in extreme and harsh conditions. Furthermore, PVC resins are readily available all around the globe which makes them an ideal choice for most manufacturers worldwide.

Durability and Visibility Drive Prismatic technology Demand

Reflecting Technology Prismatic
Value Share (2035) 59.3%

Firefighting tapes come in two different reflecting technologies of which prismatic technology dominates the market with almost 60% of the share in 2025. The main reason for this domination is the inherent durability of prismatic films which makes them a preferred choice over glass bead reflection, especially in harsh environments.

Additionally, prismatic films are more integrated into the tapes structure which makes them more resistant to wear and tear. Moreover, prismatic technology boasts of a wider viewing angle which makes them highly popular amongst firefighters since they require clear indication of the different marked areas from different locations.
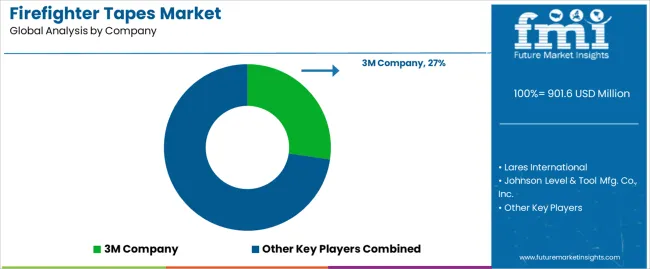
Competitive Landscape

Firefighter Tapes Market Analysis By Company

Several prominent players in the firefighter tapes market are significantly investing in innovation, research, and development to discover new reflecting technologies and enhance their offerings. Leveraging technology, these companies prioritize safety, product quality, and customer satisfaction to expand their customer base.

Key manufacturers of firefighter tapes are also focusing on development of new features to be implemented in their new products. Some of them are also adopting an expansion strategy, investing in new facilities in order to expand their presence and footprint across different geographies.

Recent Industry Developments in Firefighter Tapes Market

  • In October 2025 ORAFOL Europe GmbH announced the development and production of several new products which include retroreflective materials for numerous industries and applications.
  • In April 2025, Tesa SE announced the launch of a wide range of flame-retardant adhesive tapes for floor covering in aircrafts.

Key Players of Firefighter Tapes Industry

  • 3M Company
  • Lares International
  • Johnson Level & Tool Mfg. Co., Inc.
  • ORAFOL Europe GmbH
  • Harris Industries, Inc.
  • Brady Corporation
  • Advance Tapes International Ltd.
  • Nitto Denko Corporation
  • Klein Tools
  • T Christy Enterprises
  • Reef Industries Inc.
  • Tesa SE
  • AVATACK Co., Ltd.
  • MISUMI Corporation
  • Scapa Group plc

Key Segments of Firefighter Tapes Industry

By Material:

In terms of material, the industry is divided into poly vinyl chloride (PVC), polyethylene (PE), nylon, and polyester.

By Length:

In terms of product type, the industry is segregated into below 50 m, 50-100 m, and above 100 m.

By Thickness:

In terms of thickness, the industry is segregated into up to 100 microns, 100-150 microns, above 150 microns.

By Reflecting Technology:

The industry is classified by reflecting technology into prismatic and glass bead reflection

By Region:

Key countries of North America, Latin America, Western Europe, Eastern Europe, South Asia & Pacific, East Asia, and Middle East and Africa (MEA), have been covered in the report.

Frequently Asked Questions

How big is the firefighter tapes market in 2025?

The global firefighter tapes market is estimated to be valued at USD 901.6 million in 2025.

What will be the size of firefighter tapes market in 2035?

The market size for the firefighter tapes market is projected to reach USD 1,200.0 million by 2035.

How much will be the firefighter tapes market growth between 2025 and 2035?

The firefighter tapes market is expected to grow at a 2.9% CAGR between 2025 and 2035.

What are the key product types in the firefighter tapes market?

The key product types in firefighter tapes market are poly vinyl chloride (pvc), polyethylene (pe), nylon and polyester.

Which length segment to contribute significant share in the firefighter tapes market in 2025?

In terms of length, 50-100 m segment to command 45.0% share in the firefighter tapes market in 2025.

Table of Content

  1. Executive Summary
    • Global Market Outlook
    • Demand to side Trends
    • Supply to side Trends
    • Technology Roadmap Analysis
    • Analysis and Recommendations
  2. Market Overview
    • Market Coverage / Taxonomy
    • Market Definition / Scope / Limitations
  3. Market Background
    • Market Dynamics
      • Drivers
      • Restraints
      • Opportunity
      • Trends
    • Scenario Forecast
      • Demand in Optimistic Scenario
      • Demand in Likely Scenario
      • Demand in Conservative Scenario
    • Opportunity Map Analysis
    • Product Life Cycle Analysis
    • Supply Chain Analysis
    • Investment Feasibility Matrix
    • Value Chain Analysis
    • PESTLE and Porter’s Analysis
    • Regulatory Landscape
    • Regional Parent Market Outlook
    • Production and Consumption Statistics
    • Import and Export Statistics
  4. Global Market Analysis 2020 to 2024 and Forecast, 2025 to 2035
    • Historical Market Size Value (USD Million) Analysis, 2020 to 2024
    • Current and Future Market Size Value (USD Million) Projections, 2025 to 2035
      • Y to o to Y Growth Trend Analysis
      • Absolute $ Opportunity Analysis
  5. Global Market Pricing Analysis 2020 to 2024 and Forecast 2025 to 2035
  6. Global Market Analysis 2020 to 2024 and Forecast 2025 to 2035, By Material
    • Introduction / Key Findings
    • Historical Market Size Value (USD Million) Analysis By Material , 2020 to 2024
    • Current and Future Market Size Value (USD Million) Analysis and Forecast By Material , 2025 to 2035
      • Poly Vinyl Chloride (PVC)
      • Polyethylene (PE)
      • Nylon
      • Polyester
    • Y to o to Y Growth Trend Analysis By Material , 2020 to 2024
    • Absolute $ Opportunity Analysis By Material , 2025 to 2035
  7. Global Market Analysis 2020 to 2024 and Forecast 2025 to 2035, By Length
    • Introduction / Key Findings
    • Historical Market Size Value (USD Million) Analysis By Length, 2020 to 2024
    • Current and Future Market Size Value (USD Million) Analysis and Forecast By Length, 2025 to 2035
      • 50-100 m
      • Below 50 m
      • Above 100 m
    • Y to o to Y Growth Trend Analysis By Length, 2020 to 2024
    • Absolute $ Opportunity Analysis By Length, 2025 to 2035
  8. Global Market Analysis 2020 to 2024 and Forecast 2025 to 2035, By Thickness
    • Introduction / Key Findings
    • Historical Market Size Value (USD Million) Analysis By Thickness, 2020 to 2024
    • Current and Future Market Size Value (USD Million) Analysis and Forecast By Thickness, 2025 to 2035
      • 100-150 Microns
      • Up To 100 Microns
      • Above 150 Microns
    • Y to o to Y Growth Trend Analysis By Thickness, 2020 to 2024
    • Absolute $ Opportunity Analysis By Thickness, 2025 to 2035
  9. Global Market Analysis 2020 to 2024 and Forecast 2025 to 2035, By Reflecting Technology
    • Introduction / Key Findings
    • Historical Market Size Value (USD Million) Analysis By Reflecting Technology, 2020 to 2024
    • Current and Future Market Size Value (USD Million) Analysis and Forecast By Reflecting Technology, 2025 to 2035
      • Prismatic
      • Glass Bead Reflection
    • Y to o to Y Growth Trend Analysis By Reflecting Technology, 2020 to 2024
    • Absolute $ Opportunity Analysis By Reflecting Technology, 2025 to 2035
  10. Global Market Analysis 2020 to 2024 and Forecast 2025 to 2035, By Region
    • Introduction
    • Historical Market Size Value (USD Million) Analysis By Region, 2020 to 2024
    • Current Market Size Value (USD Million) Analysis and Forecast By Region, 2025 to 2035
      • North America
      • Latin America
      • Western Europe
      • Eastern Europe
      • East Asia
      • South Asia and Pacific
      • Middle East & Africa
    • Market Attractiveness Analysis By Region
  11. North America Market Analysis 2020 to 2024 and Forecast 2025 to 2035, By Country
    • Historical Market Size Value (USD Million) Trend Analysis By Market Taxonomy, 2020 to 2024
    • Market Size Value (USD Million) Forecast By Market Taxonomy, 2025 to 2035
      • By Country
        • USA
        • Canada
        • Mexico
      • By Material
      • By Length
      • By Thickness
      • By Reflecting Technology
    • Market Attractiveness Analysis
      • By Country
      • By Material
      • By Length
      • By Thickness
      • By Reflecting Technology
    • Key Takeaways
  12. Latin America Market Analysis 2020 to 2024 and Forecast 2025 to 2035, By Country
    • Historical Market Size Value (USD Million) Trend Analysis By Market Taxonomy, 2020 to 2024
    • Market Size Value (USD Million) Forecast By Market Taxonomy, 2025 to 2035
      • By Country
        • Brazil
        • Chile
        • Rest of Latin America
      • By Material
      • By Length
      • By Thickness
      • By Reflecting Technology
    • Market Attractiveness Analysis
      • By Country
      • By Material
      • By Length
      • By Thickness
      • By Reflecting Technology
    • Key Takeaways
  13. Western Europe Market Analysis 2020 to 2024 and Forecast 2025 to 2035, By Country
    • Historical Market Size Value (USD Million) Trend Analysis By Market Taxonomy, 2020 to 2024
    • Market Size Value (USD Million) Forecast By Market Taxonomy, 2025 to 2035
      • By Country
        • Germany
        • UK
        • Italy
        • Spain
        • France
        • Nordic
        • BENELUX
        • Rest of Western Europe
      • By Material
      • By Length
      • By Thickness
      • By Reflecting Technology
    • Market Attractiveness Analysis
      • By Country
      • By Material
      • By Length
      • By Thickness
      • By Reflecting Technology
    • Key Takeaways
  14. Eastern Europe Market Analysis 2020 to 2024 and Forecast 2025 to 2035, By Country
    • Historical Market Size Value (USD Million) Trend Analysis By Market Taxonomy, 2020 to 2024
    • Market Size Value (USD Million) Forecast By Market Taxonomy, 2025 to 2035
      • By Country
        • Russia
        • Poland
        • Hungary
        • Balkan & Baltic
        • Rest of Eastern Europe
      • By Material
      • By Length
      • By Thickness
      • By Reflecting Technology
    • Market Attractiveness Analysis
      • By Country
      • By Material
      • By Length
      • By Thickness
      • By Reflecting Technology
    • Key Takeaways
  15. East Asia Market Analysis 2020 to 2024 and Forecast 2025 to 2035, By Country
    • Historical Market Size Value (USD Million) Trend Analysis By Market Taxonomy, 2020 to 2024
    • Market Size Value (USD Million) Forecast By Market Taxonomy, 2025 to 2035
      • By Country
        • China
        • Japan
        • South Korea
      • By Material
      • By Length
      • By Thickness
      • By Reflecting Technology
    • Market Attractiveness Analysis
      • By Country
      • By Material
      • By Length
      • By Thickness
      • By Reflecting Technology
    • Key Takeaways
  16. South Asia and Pacific Market Analysis 2020 to 2024 and Forecast 2025 to 2035, By Country
    • Historical Market Size Value (USD Million) Trend Analysis By Market Taxonomy, 2020 to 2024
    • Market Size Value (USD Million) Forecast By Market Taxonomy, 2025 to 2035
      • By Country
        • India
        • ASEAN
        • Australia & New Zealand
        • Rest of South Asia and Pacific
      • By Material
      • By Length
      • By Thickness
      • By Reflecting Technology
    • Market Attractiveness Analysis
      • By Country
      • By Material
      • By Length
      • By Thickness
      • By Reflecting Technology
    • Key Takeaways
  17. Middle East & Africa Market Analysis 2020 to 2024 and Forecast 2025 to 2035, By Country
    • Historical Market Size Value (USD Million) Trend Analysis By Market Taxonomy, 2020 to 2024
    • Market Size Value (USD Million) Forecast By Market Taxonomy, 2025 to 2035
      • By Country
        • Kingdom of Saudi Arabia
        • Other GCC Countries
        • Turkiye
        • South Africa
        • Other African Union
        • Rest of Middle East & Africa
      • By Material
      • By Length
      • By Thickness
      • By Reflecting Technology
    • Market Attractiveness Analysis
      • By Country
      • By Material
      • By Length
      • By Thickness
      • By Reflecting Technology
    • Key Takeaways
  18. Key Countries Market Analysis
    • USA
      • Pricing Analysis
      • Market Share Analysis, 2024
        • By Material
        • By Length
        • By Thickness
        • By Reflecting Technology
    • Canada
      • Pricing Analysis
      • Market Share Analysis, 2024
        • By Material
        • By Length
        • By Thickness
        • By Reflecting Technology
    • Mexico
      • Pricing Analysis
      • Market Share Analysis, 2024
        • By Material
        • By Length
        • By Thickness
        • By Reflecting Technology
    • Brazil
      • Pricing Analysis
      • Market Share Analysis, 2024
        • By Material
        • By Length
        • By Thickness
        • By Reflecting Technology
    • Chile
      • Pricing Analysis
      • Market Share Analysis, 2024
        • By Material
        • By Length
        • By Thickness
        • By Reflecting Technology
    • Germany
      • Pricing Analysis
      • Market Share Analysis, 2024
        • By Material
        • By Length
        • By Thickness
        • By Reflecting Technology
    • UK
      • Pricing Analysis
      • Market Share Analysis, 2024
        • By Material
        • By Length
        • By Thickness
        • By Reflecting Technology
    • Italy
      • Pricing Analysis
      • Market Share Analysis, 2024
        • By Material
        • By Length
        • By Thickness
        • By Reflecting Technology
    • Spain
      • Pricing Analysis
      • Market Share Analysis, 2024
        • By Material
        • By Length
        • By Thickness
        • By Reflecting Technology
    • France
      • Pricing Analysis
      • Market Share Analysis, 2024
        • By Material
        • By Length
        • By Thickness
        • By Reflecting Technology
    • India
      • Pricing Analysis
      • Market Share Analysis, 2024
        • By Material
        • By Length
        • By Thickness
        • By Reflecting Technology
    • ASEAN
      • Pricing Analysis
      • Market Share Analysis, 2024
        • By Material
        • By Length
        • By Thickness
        • By Reflecting Technology
    • Australia & New Zealand
      • Pricing Analysis
      • Market Share Analysis, 2024
        • By Material
        • By Length
        • By Thickness
        • By Reflecting Technology
    • China
      • Pricing Analysis
      • Market Share Analysis, 2024
        • By Material
        • By Length
        • By Thickness
        • By Reflecting Technology
    • Japan
      • Pricing Analysis
      • Market Share Analysis, 2024
        • By Material
        • By Length
        • By Thickness
        • By Reflecting Technology
    • South Korea
      • Pricing Analysis
      • Market Share Analysis, 2024
        • By Material
        • By Length
        • By Thickness
        • By Reflecting Technology
    • Russia
      • Pricing Analysis
      • Market Share Analysis, 2024
        • By Material
        • By Length
        • By Thickness
        • By Reflecting Technology
    • Poland
      • Pricing Analysis
      • Market Share Analysis, 2024
        • By Material
        • By Length
        • By Thickness
        • By Reflecting Technology
    • Hungary
      • Pricing Analysis
      • Market Share Analysis, 2024
        • By Material
        • By Length
        • By Thickness
        • By Reflecting Technology
    • Kingdom of Saudi Arabia
      • Pricing Analysis
      • Market Share Analysis, 2024
        • By Material
        • By Length
        • By Thickness
        • By Reflecting Technology
    • Turkiye
      • Pricing Analysis
      • Market Share Analysis, 2024
        • By Material
        • By Length
        • By Thickness
        • By Reflecting Technology
    • South Africa
      • Pricing Analysis
      • Market Share Analysis, 2024
        • By Material
        • By Length
        • By Thickness
        • By Reflecting Technology
  19. Market Structure Analysis
    • Competition Dashboard
    • Competition Benchmarking
    • Market Share Analysis of Top Players
      • By Regional
      • By Material
      • By Length
      • By Thickness
      • By Reflecting Technology
  20. Competition Analysis
    • Competition Deep Dive
      • 3M Company
        • Overview
        • Product Portfolio
        • Profitability by Market Segments (Product/Age /Sales Channel/Region)
        • Sales Footprint
        • Strategy Overview
          • Marketing Strategy
          • Product Strategy
          • Channel Strategy
      • Lares International
      • Johnson Level & Tool Mfg. Co., Inc.
      • ORAFOL Europe GmbH
      • Harris Industries, Inc.
      • Brady Corporation
      • Advance Tapes International Ltd.
      • Nitto Denko Corporation
      • Klein Tools
      • T Christy Enterprises
      • Reef Industries Inc.
      • Tesa SE
      • AVATACK Co., Ltd.
      • MISUMI Corporation
      • Scapa Group plc
  21. Assumptions & Acronyms Used
  22. Research Methodology

List of Tables

  • Table 1: Global Market Value (USD Million) Forecast by Region, 2020 to 2035
  • Table 2: Global Market Value (USD Million) Forecast by Material , 2020 to 2035
  • Table 3: Global Market Value (USD Million) Forecast by Length, 2020 to 2035
  • Table 4: Global Market Value (USD Million) Forecast by Thickness, 2020 to 2035
  • Table 5: Global Market Value (USD Million) Forecast by Reflecting Technology, 2020 to 2035
  • Table 6: North America Market Value (USD Million) Forecast by Country, 2020 to 2035
  • Table 7: North America Market Value (USD Million) Forecast by Material , 2020 to 2035
  • Table 8: North America Market Value (USD Million) Forecast by Length, 2020 to 2035
  • Table 9: North America Market Value (USD Million) Forecast by Thickness, 2020 to 2035
  • Table 10: North America Market Value (USD Million) Forecast by Reflecting Technology, 2020 to 2035
  • Table 11: Latin America Market Value (USD Million) Forecast by Country, 2020 to 2035
  • Table 12: Latin America Market Value (USD Million) Forecast by Material , 2020 to 2035
  • Table 13: Latin America Market Value (USD Million) Forecast by Length, 2020 to 2035
  • Table 14: Latin America Market Value (USD Million) Forecast by Thickness, 2020 to 2035
  • Table 15: Latin America Market Value (USD Million) Forecast by Reflecting Technology, 2020 to 2035
  • Table 16: Western Europe Market Value (USD Million) Forecast by Country, 2020 to 2035
  • Table 17: Western Europe Market Value (USD Million) Forecast by Material , 2020 to 2035
  • Table 18: Western Europe Market Value (USD Million) Forecast by Length, 2020 to 2035
  • Table 19: Western Europe Market Value (USD Million) Forecast by Thickness, 2020 to 2035
  • Table 20: Western Europe Market Value (USD Million) Forecast by Reflecting Technology, 2020 to 2035
  • Table 21: Eastern Europe Market Value (USD Million) Forecast by Country, 2020 to 2035
  • Table 22: Eastern Europe Market Value (USD Million) Forecast by Material , 2020 to 2035
  • Table 23: Eastern Europe Market Value (USD Million) Forecast by Length, 2020 to 2035
  • Table 24: Eastern Europe Market Value (USD Million) Forecast by Thickness, 2020 to 2035
  • Table 25: Eastern Europe Market Value (USD Million) Forecast by Reflecting Technology, 2020 to 2035
  • Table 26: East Asia Market Value (USD Million) Forecast by Country, 2020 to 2035
  • Table 27: East Asia Market Value (USD Million) Forecast by Material , 2020 to 2035
  • Table 28: East Asia Market Value (USD Million) Forecast by Length, 2020 to 2035
  • Table 29: East Asia Market Value (USD Million) Forecast by Thickness, 2020 to 2035
  • Table 30: East Asia Market Value (USD Million) Forecast by Reflecting Technology, 2020 to 2035
  • Table 31: South Asia and Pacific Market Value (USD Million) Forecast by Country, 2020 to 2035
  • Table 32: South Asia and Pacific Market Value (USD Million) Forecast by Material , 2020 to 2035
  • Table 33: South Asia and Pacific Market Value (USD Million) Forecast by Length, 2020 to 2035
  • Table 34: South Asia and Pacific Market Value (USD Million) Forecast by Thickness, 2020 to 2035
  • Table 35: South Asia and Pacific Market Value (USD Million) Forecast by Reflecting Technology, 2020 to 2035
  • Table 36: Middle East & Africa Market Value (USD Million) Forecast by Country, 2020 to 2035
  • Table 37: Middle East & Africa Market Value (USD Million) Forecast by Material , 2020 to 2035
  • Table 38: Middle East & Africa Market Value (USD Million) Forecast by Length, 2020 to 2035
  • Table 39: Middle East & Africa Market Value (USD Million) Forecast by Thickness, 2020 to 2035
  • Table 40: Middle East & Africa Market Value (USD Million) Forecast by Reflecting Technology, 2020 to 2035

List of Figures

  • Figure 1: Global Market Pricing Analysis
  • Figure 2: Global Market Value (USD Million) Forecast 2020-2035
  • Figure 3: Global Market Value Share and BPS Analysis by Material , 2025 and 2035
  • Figure 4: Global Market Y to o to Y Growth Comparison by Material , 2025-2035
  • Figure 5: Global Market Attractiveness Analysis by Material
  • Figure 6: Global Market Value Share and BPS Analysis by Length, 2025 and 2035
  • Figure 7: Global Market Y to o to Y Growth Comparison by Length, 2025-2035
  • Figure 8: Global Market Attractiveness Analysis by Length
  • Figure 9: Global Market Value Share and BPS Analysis by Thickness, 2025 and 2035
  • Figure 10: Global Market Y to o to Y Growth Comparison by Thickness, 2025-2035
  • Figure 11: Global Market Attractiveness Analysis by Thickness
  • Figure 12: Global Market Value Share and BPS Analysis by Reflecting Technology, 2025 and 2035
  • Figure 13: Global Market Y to o to Y Growth Comparison by Reflecting Technology, 2025-2035
  • Figure 14: Global Market Attractiveness Analysis by Reflecting Technology
  • Figure 15: Global Market Value (USD Million) Share and BPS Analysis by Region, 2025 and 2035
  • Figure 16: Global Market Y to o to Y Growth Comparison by Region, 2025-2035
  • Figure 17: Global Market Attractiveness Analysis by Region
  • Figure 18: North America Market Incremental Dollar Opportunity, 2025-2035
  • Figure 19: Latin America Market Incremental Dollar Opportunity, 2025-2035
  • Figure 20: Western Europe Market Incremental Dollar Opportunity, 2025-2035
  • Figure 21: Eastern Europe Market Incremental Dollar Opportunity, 2025-2035
  • Figure 22: East Asia Market Incremental Dollar Opportunity, 2025-2035
  • Figure 23: South Asia and Pacific Market Incremental Dollar Opportunity, 2025-2035
  • Figure 24: Middle East & Africa Market Incremental Dollar Opportunity, 2025-2035
  • Figure 25: North America Market Value Share and BPS Analysis by Country, 2025 and 2035
  • Figure 26: North America Market Value Share and BPS Analysis by Material , 2025 and 2035
  • Figure 27: North America Market Y to o to Y Growth Comparison by Material , 2025-2035
  • Figure 28: North America Market Attractiveness Analysis by Material
  • Figure 29: North America Market Value Share and BPS Analysis by Length, 2025 and 2035
  • Figure 30: North America Market Y to o to Y Growth Comparison by Length, 2025-2035
  • Figure 31: North America Market Attractiveness Analysis by Length
  • Figure 32: North America Market Value Share and BPS Analysis by Thickness, 2025 and 2035
  • Figure 33: North America Market Y to o to Y Growth Comparison by Thickness, 2025-2035
  • Figure 34: North America Market Attractiveness Analysis by Thickness
  • Figure 35: North America Market Value Share and BPS Analysis by Reflecting Technology, 2025 and 2035
  • Figure 36: North America Market Y to o to Y Growth Comparison by Reflecting Technology, 2025-2035
  • Figure 37: North America Market Attractiveness Analysis by Reflecting Technology
  • Figure 38: Latin America Market Value Share and BPS Analysis by Country, 2025 and 2035
  • Figure 39: Latin America Market Value Share and BPS Analysis by Material , 2025 and 2035
  • Figure 40: Latin America Market Y to o to Y Growth Comparison by Material , 2025-2035
  • Figure 41: Latin America Market Attractiveness Analysis by Material
  • Figure 42: Latin America Market Value Share and BPS Analysis by Length, 2025 and 2035
  • Figure 43: Latin America Market Y to o to Y Growth Comparison by Length, 2025-2035
  • Figure 44: Latin America Market Attractiveness Analysis by Length
  • Figure 45: Latin America Market Value Share and BPS Analysis by Thickness, 2025 and 2035
  • Figure 46: Latin America Market Y to o to Y Growth Comparison by Thickness, 2025-2035
  • Figure 47: Latin America Market Attractiveness Analysis by Thickness
  • Figure 48: Latin America Market Value Share and BPS Analysis by Reflecting Technology, 2025 and 2035
  • Figure 49: Latin America Market Y to o to Y Growth Comparison by Reflecting Technology, 2025-2035
  • Figure 50: Latin America Market Attractiveness Analysis by Reflecting Technology
  • Figure 51: Western Europe Market Value Share and BPS Analysis by Country, 2025 and 2035
  • Figure 52: Western Europe Market Value Share and BPS Analysis by Material , 2025 and 2035
  • Figure 53: Western Europe Market Y to o to Y Growth Comparison by Material , 2025-2035
  • Figure 54: Western Europe Market Attractiveness Analysis by Material
  • Figure 55: Western Europe Market Value Share and BPS Analysis by Length, 2025 and 2035
  • Figure 56: Western Europe Market Y to o to Y Growth Comparison by Length, 2025-2035
  • Figure 57: Western Europe Market Attractiveness Analysis by Length
  • Figure 58: Western Europe Market Value Share and BPS Analysis by Thickness, 2025 and 2035
  • Figure 59: Western Europe Market Y to o to Y Growth Comparison by Thickness, 2025-2035
  • Figure 60: Western Europe Market Attractiveness Analysis by Thickness
  • Figure 61: Western Europe Market Value Share and BPS Analysis by Reflecting Technology, 2025 and 2035
  • Figure 62: Western Europe Market Y to o to Y Growth Comparison by Reflecting Technology, 2025-2035
  • Figure 63: Western Europe Market Attractiveness Analysis by Reflecting Technology
  • Figure 64: Eastern Europe Market Value Share and BPS Analysis by Country, 2025 and 2035
  • Figure 65: Eastern Europe Market Value Share and BPS Analysis by Material , 2025 and 2035
  • Figure 66: Eastern Europe Market Y to o to Y Growth Comparison by Material , 2025-2035
  • Figure 67: Eastern Europe Market Attractiveness Analysis by Material
  • Figure 68: Eastern Europe Market Value Share and BPS Analysis by Length, 2025 and 2035
  • Figure 69: Eastern Europe Market Y to o to Y Growth Comparison by Length, 2025-2035
  • Figure 70: Eastern Europe Market Attractiveness Analysis by Length
  • Figure 71: Eastern Europe Market Value Share and BPS Analysis by Thickness, 2025 and 2035
  • Figure 72: Eastern Europe Market Y to o to Y Growth Comparison by Thickness, 2025-2035
  • Figure 73: Eastern Europe Market Attractiveness Analysis by Thickness
  • Figure 74: Eastern Europe Market Value Share and BPS Analysis by Reflecting Technology, 2025 and 2035
  • Figure 75: Eastern Europe Market Y to o to Y Growth Comparison by Reflecting Technology, 2025-2035
  • Figure 76: Eastern Europe Market Attractiveness Analysis by Reflecting Technology
  • Figure 77: East Asia Market Value Share and BPS Analysis by Country, 2025 and 2035
  • Figure 78: East Asia Market Value Share and BPS Analysis by Material , 2025 and 2035
  • Figure 79: East Asia Market Y to o to Y Growth Comparison by Material , 2025-2035
  • Figure 80: East Asia Market Attractiveness Analysis by Material
  • Figure 81: East Asia Market Value Share and BPS Analysis by Length, 2025 and 2035
  • Figure 82: East Asia Market Y to o to Y Growth Comparison by Length, 2025-2035
  • Figure 83: East Asia Market Attractiveness Analysis by Length
  • Figure 84: East Asia Market Value Share and BPS Analysis by Thickness, 2025 and 2035
  • Figure 85: East Asia Market Y to o to Y Growth Comparison by Thickness, 2025-2035
  • Figure 86: East Asia Market Attractiveness Analysis by Thickness
  • Figure 87: East Asia Market Value Share and BPS Analysis by Reflecting Technology, 2025 and 2035
  • Figure 88: East Asia Market Y to o to Y Growth Comparison by Reflecting Technology, 2025-2035
  • Figure 89: East Asia Market Attractiveness Analysis by Reflecting Technology
  • Figure 90: South Asia and Pacific Market Value Share and BPS Analysis by Country, 2025 and 2035
  • Figure 91: South Asia and Pacific Market Value Share and BPS Analysis by Material , 2025 and 2035
  • Figure 92: South Asia and Pacific Market Y to o to Y Growth Comparison by Material , 2025-2035
  • Figure 93: South Asia and Pacific Market Attractiveness Analysis by Material
  • Figure 94: South Asia and Pacific Market Value Share and BPS Analysis by Length, 2025 and 2035
  • Figure 95: South Asia and Pacific Market Y to o to Y Growth Comparison by Length, 2025-2035
  • Figure 96: South Asia and Pacific Market Attractiveness Analysis by Length
  • Figure 97: South Asia and Pacific Market Value Share and BPS Analysis by Thickness, 2025 and 2035
  • Figure 98: South Asia and Pacific Market Y to o to Y Growth Comparison by Thickness, 2025-2035
  • Figure 99: South Asia and Pacific Market Attractiveness Analysis by Thickness
  • Figure 100: South Asia and Pacific Market Value Share and BPS Analysis by Reflecting Technology, 2025 and 2035
  • Figure 101: South Asia and Pacific Market Y to o to Y Growth Comparison by Reflecting Technology, 2025-2035
  • Figure 102: South Asia and Pacific Market Attractiveness Analysis by Reflecting Technology
  • Figure 103: Middle East & Africa Market Value Share and BPS Analysis by Country, 2025 and 2035
  • Figure 104: Middle East & Africa Market Value Share and BPS Analysis by Material , 2025 and 2035
  • Figure 105: Middle East & Africa Market Y to o to Y Growth Comparison by Material , 2025-2035
  • Figure 106: Middle East & Africa Market Attractiveness Analysis by Material
  • Figure 107: Middle East & Africa Market Value Share and BPS Analysis by Length, 2025 and 2035
  • Figure 108: Middle East & Africa Market Y to o to Y Growth Comparison by Length, 2025-2035
  • Figure 109: Middle East & Africa Market Attractiveness Analysis by Length
  • Figure 110: Middle East & Africa Market Value Share and BPS Analysis by Thickness, 2025 and 2035
  • Figure 111: Middle East & Africa Market Y to o to Y Growth Comparison by Thickness, 2025-2035
  • Figure 112: Middle East & Africa Market Attractiveness Analysis by Thickness
  • Figure 113: Middle East & Africa Market Value Share and BPS Analysis by Reflecting Technology, 2025 and 2035
  • Figure 114: Middle East & Africa Market Y to o to Y Growth Comparison by Reflecting Technology, 2025-2035
  • Figure 115: Middle East & Africa Market Attractiveness Analysis by Reflecting Technology
  • Figure 116: Global Market - Tier Structure Analysis
  • Figure 117: Global Market - Company Share Analysis
Dashboard
Dashboard
Dashboard
Dashboard
Dashboard
Dashboard

Our Research Products

Full Research Suite

The "Full Research Suite" delivers actionable market intel, deep dives on markets or technologies, so clients act faster, cut risk, and unlock growth.

Competitor Leaderboard Report

The Leaderboard benchmarks and ranks top vendors, classifying them as Established Leaders, Leading Challengers, or Disruptors & Challengers.

Future Leaders Index

Locates where complements amplify value and substitutes erode it, forecasting net impact by horizon

Market Data & Forecasts

We deliver granular, decision-grade intel: market sizing, 5-year forecasts, pricing, adoption, usage, revenue, and operational KPIs—plus competitor tracking, regulation, and value chains—across 60 countries broadly.

Market Focus Report

Spot the shifts before they hit your P&L. We track inflection points, adoption curves, pricing moves, and ecosystem plays to show where demand is heading, why it is changing, and what to do next across high-growth markets and disruptive tech

Survey Report

Real-time reads of user behavior. We track shifting priorities, perceptions of today’s and next-gen services, and provider experience, then pace how fast tech moves from trial to adoption, blending buyer, consumer, and channel inputs with social signals (#WhySwitch, #UX).

Bespoke Reports

Partner with our analyst team to build a custom report designed around your business priorities. From analysing market trends to assessing competitors or crafting bespoke datasets, we tailor insights to your needs.

Supplier Intelligence

Discovery & Profiling

Capacity & Footprint

Performance & Risk

Compliance & Governance

Commercial Readiness

Who Supplies Whom

Scorecards & Shortlists

Playbooks & Docs

Category Intelligence

Definition & Scope

Demand & Use Cases

Cost Drivers

Market Structure

Supply Chain Map

Trade & Policy

Operating Norms

Deliverables

Buyer Intelligence

Account Basics

Spend & Scope

Procurement Model

Vendor Requirements

Terms & Policies

Entry Strategy

Pain Points & Triggers

Outputs

Pricing Analysis

Benchmarks

Trends

Should-Cost

Indexation

Landed Cost

Commercial Terms

Deliverables

Brand Analysis

Positioning & Value Prop

Share & Presence

Customer Evidence

Go-to-Market

Digital & Reputation

Compliance & Trust

KPIs & Gaps

Outputs

Full Research Suite comprises of:

Market outlook & trends analysis

Market outlook & trends analysis

Interviews & case studies

Interviews & case studies

Strategic recommendations

Strategic recommendations

Vendor profiles & capabilities analysis

Vendor profiles & capabilities analysis

5-year forecasts

5-year forecasts

8 regions and 60+ country-level data splits

8 regions and 60+ country-level data splits

Market segment data splits

Market segment data splits

12 months of continuous data updates

12 months of continuous data updates

DELIVERED AS:

PDF EXCEL ONLINE

Full Research Suite


$5000

$7500

$10000

Buy Report Now
Similar Industry Reports

Similar Industry Reports

Tapes Market
Tapes Market

Tapes Market Insights – Growth & Demand 2025 to 2035

UV Tapes Market
UV Tapes Market

UV Tapes Market Growth - Trends & Forecast 2025 to 2035

PVC Tapes Market
PVC Tapes Market

PVC Tapes Market Size and Share Forecast Outlook 2025 to 2035

PVC Tapes Market Share Analysis

Leading Providers & Market Share in PVC Tapes Industry

ESD Tapes and Labels Market

ESD Tapes and Labels Market from 2025 to 2035

USA Tapes Market
USA Tapes Market

USA Tapes Market Analysis – Growth & Forecast 2024-2034

Seam Tapes Market
Seam Tapes Market

Seam Tapes Market Insights – Growth & Demand Forecast 2025-2035

Foil Tapes Market
Foil Tapes Market

Foil Tapes Market

Nano Tapes Market
Nano Tapes Market

Nano Tapes Market

Pouch Tapes Market
Pouch Tapes Market

Pouch Tapes Market Size and Share Forecast Outlook 2025 to 2035

Washi Tapes Market
Washi Tapes Market

Washi Tapes Market Size and Share Forecast Outlook 2025 to 2035

Paper Tapes Market
Paper Tapes Market

Paper Tapes Market Insights – Growth & Demand 2025–2035

Paper Tapes Market Share Analysis

Market Share Breakdown of Paper Tapes Providers

Carbon Tapes Market
Carbon Tapes Market

Carbon Tapes Market Size and Share Forecast Outlook 2025 to 2035

Rubber Tapes Market
Rubber Tapes Market

Rubber Tapes Market Trends - Growth & Forecast 2025 to 2035

Mastic Tapes Market
Mastic Tapes Market

Mastic Tapes Market from 2025 to 2035

Spacer Tapes Market
Spacer Tapes Market

Spacer Tapes Market Insights & Growth Outlook through 2034

Filmic Tapes Market
Filmic Tapes Market

Filmic Tapes Market

Tissue Tapes Market
Tissue Tapes Market

Tissue Tapes Market

Suture Tapes Market
Suture Tapes Market

Suture Tapes Market

Future Market Insights

Firefighter Tapes Market

Chat With MaRIA

Chat With

MaRIA

Hi There, I am MaRIA, Your Market Research Intelligence Assistant. How may I help you?