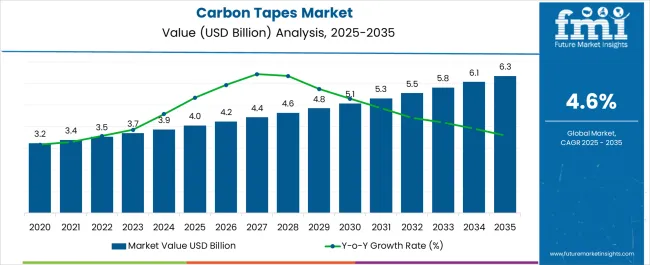
The global carbon tapes market is set to reach USD 3.7 billion in 2023. Sales are projected to increase at a CAGR of 4.6% over the assessment period, to total USD 5.8 billion by 2033.
The carbon tapes sales are projected to increase with the top 5 companies and held around 25-30% of the global market in 2022.
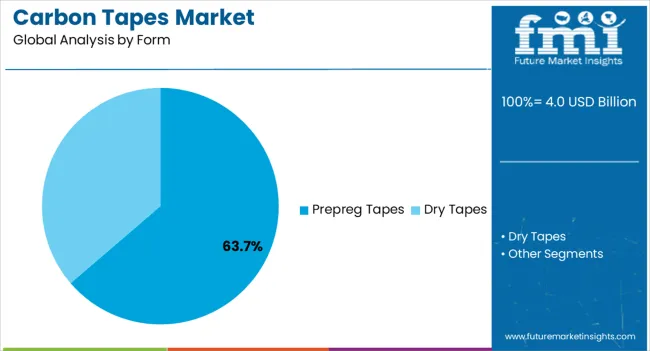
According to the FMI analysis, the carbon tapes market revenue totalled USD 3.43 billion in 2021. The sales of prepreg tapes accelerate with the top 3 countries holding 35-40% of the carbon tapes sector in 2022.
The carbon tapes sector is estimated to experience a constructive growth outlook during the forecast period. A new forecast by FMI estimates that the carbon tapes revenue is likely to rise during 2023 to 2033 and is projected to create an incremental growth opportunity of USD 2.1 billion.
Expansion in the aerospace & defense and automotive sector is anticipated to grow 1.6 times the current market value during 2023 to 2033.
Attribute | Details |
---|---|
Carbon Tapes Market CAGR (2023 to 2033) | 4.6% |
Carbon Tapes Market Size (2023) | USD 3.7 billion |
Carbon Tapes Market Size (2033) | USD 5.8 billion |
Sales of carbon tapes are slated to increase at a 4.6% CAGR over the forecast period, in comparison to the CAGR of 3.4% registered during 2015 to 2021. The global carbon tapes industry reached USD 3.6 billion in 2022 from USD 3.1 billion in 2018.
The carbon tape made from carbon fiber offers high strength and durability. It offers high-temperature tolerance and low thermal expansion property, making it a preferred choice among end use industries for reinforcement.
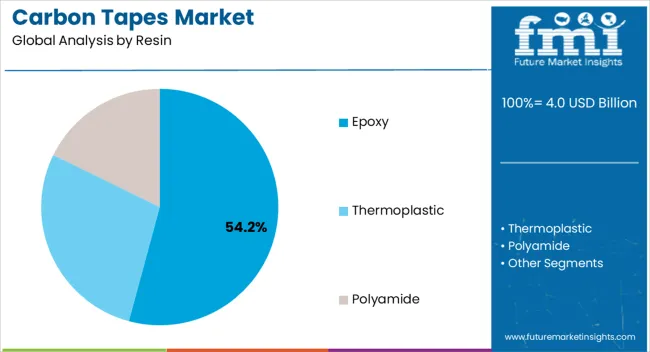
Carbon tape is the perfect solution for firmly connecting two components and ensuring optimal electrical conductivity between them. Therefore, it is also called carbon conductive tape. Carbon tapes are available in different resins such as epoxy carbon tapes, thermoplastic carbon tapes, and polyamide carbon tapes.
Increasing demand for these carbon tapes are attributed to several end-user industries, including aerospace & defense, automotive, building & construction, and others. In addition, new technologies such as automated tape laying and automatic fiber insertion have made it possible to produce composite parts with cost-effective, quick, and accurate composite layups.
The carbon tapes help the end use industries to manufacture multifunctional parts in less time and cost. Thus, the demand for carbon tapes is anticipated to grow at a faster pace during the forecast period.
End use industries use most common materials to replace the rebar in carbon tape-based concrete structures. Using carbon tape prevents damage or concrete as iron tends to accumulate rust on the surface.
Using these tapes during construction reduces time and cost required to install the structure. Carbon plastic reinforcements based on carbon tapes are used in home construction, bridge construction, processing plant design, and utility construction. Metal structures are the most common concrete structures, but carbon tape is used to repair and reinforce stone and woodwork.
Carbon tape is used in sports equipment, from ice hockey sticks to jogging shoes, golf clubs, and tennis rackets. Also, it is used in horse riding, motorcycles, and mountaineer crash helmets. All sports containing a high risk of head injuries use carbon tapes. Increasing participation in a variety of sports results in high demand for various sporting equipment which bolster the demand for carbon tapes in the sporting industry.
Country | Market Share (2023) |
---|---|
United States | 24% |
Germany | 5.3% |
Japan | 3.9% |
Australia | 2.9% |
Manufacturers in Japan are Preferring Carbon Fiber Tapes
Sales in the Japan carbon tapes sector are anticipated to increase at a CAGR of 5.4% during 2023 to 2033. As per the statistics published by the Japan Automobile Manufacturer Association (JAMA), Japan is the third manufacturer in the automobile industry which has a total export of around 3.7 million units in the year 2021.
Also, the key players operating in the automotive industry have their presence in Japan due to technological advancements. The number of vehicles exported witnessed a meteoric rise in 2021, which has also resulted in increased use of carbon tapes across the automobile sector.
high Demand for High Fiber Woven Carbon Tapes in India Boost Sales
Total demand for carbon tapes in India is likely to create an incremental opportunity of USD 2.6 billion during the forecast period, with a CAGR of 7.2%. According to the All India Association of Industries (AIAI), India has increased its military and defense expenditure by announcing a defense budget of around USD 67.4 billion for the years 2020 to 2021.
India has allotted more than 10% compared to the previous years. The government is spending a high amount on the military defense system for the future. India has also shown a positive graph in the aerospace industry after the impact of a pandemic.
Segment | Resin |
---|---|
Top-segment | Epoxy |
Market Share (2022) | 48% |
Segment | End Use |
---|---|
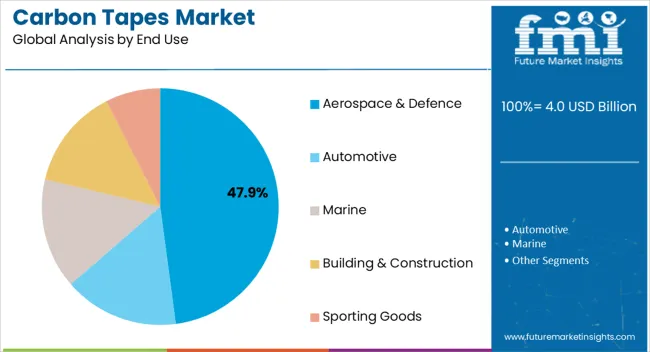
Top-segment | Aerospace and defense |
Market Share (2022) | 41.3% |
Demand for Epoxy Carbon Tapes is likely to Continue Gaining Traction
By resin, the epoxy segment is projected to expand 1.6x the current value during the forecast period. Epoxy resin exhibits low shrinkage when cured and adheres well to all types of fibers. In addition to this, epoxy resin is highly corrosion resistant and is less susceptible to water and heat than other polymer matrices.
Sales in the Aerospace and Defense Sector to Remain High
The aerospace & defense segment accounted for around 41% of the total market share in 2022. Carbon tapes are one of the most common materials used in manufacturing composite aerospace parts. Demand for carbon tapes in aircraft structural manufacturing such as wing spars, wing skins, and access panels is expected to drive the market
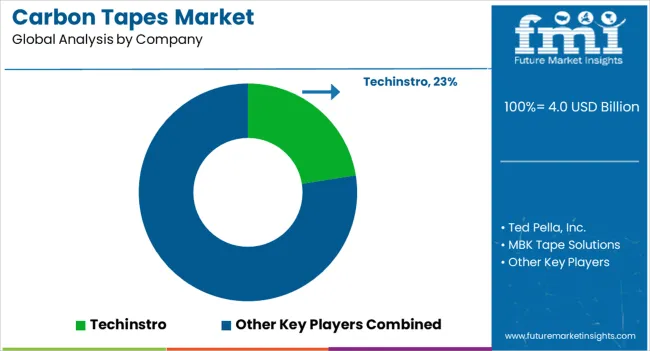
The key players operating in the carbon tapes business are focusing on introducing advanced products to cater to the growing demand. Also, key players are trying to expand their resources through mergers & acquisitions. For instance:
Table 1: Global Market Value (US$ Million) Forecast by Region, 2018 to 2033
Table 2: Global Market Volume (Sq. Mt.) Forecast by Region, 2018 to 2033
Table 3: Global Market Value (US$ Million) Forecast by Resin, 2018 to 2033
Table 4: Global Market Volume (Sq. Mt.) Forecast by Resin, 2018 to 2033
Table 5: Global Market Value (US$ Million) Forecast by Form, 2018 to 2033
Table 6: Global Market Volume (Sq. Mt.) Forecast by Form, 2018 to 2033
Table 7: Global Market Value (US$ Million) Forecast by End Use, 2018 to 2033
Table 8: Global Market Volume (Sq. Mt.) Forecast by End Use, 2018 to 2033
Table 9: North America Market Value (US$ Million) Forecast by Country, 2018 to 2033
Table 10: North America Market Volume (Sq. Mt.) Forecast by Country, 2018 to 2033
Table 11: North America Market Value (US$ Million) Forecast by Resin, 2018 to 2033
Table 12: North America Market Volume (Sq. Mt.) Forecast by Resin, 2018 to 2033
Table 13: North America Market Value (US$ Million) Forecast by Form, 2018 to 2033
Table 14: North America Market Volume (Sq. Mt.) Forecast by Form, 2018 to 2033
Table 15: North America Market Value (US$ Million) Forecast by End Use, 2018 to 2033
Table 16: North America Market Volume (Sq. Mt.) Forecast by End Use, 2018 to 2033
Table 17: Latin America Market Value (US$ Million) Forecast by Country, 2018 to 2033
Table 18: Latin America Market Volume (Sq. Mt.) Forecast by Country, 2018 to 2033
Table 19: Latin America Market Value (US$ Million) Forecast by Resin, 2018 to 2033
Table 20: Latin America Market Volume (Sq. Mt.) Forecast by Resin, 2018 to 2033
Table 21: Latin America Market Value (US$ Million) Forecast by Form, 2018 to 2033
Table 22: Latin America Market Volume (Sq. Mt.) Forecast by Form, 2018 to 2033
Table 23: Latin America Market Value (US$ Million) Forecast by End Use, 2018 to 2033
Table 24: Latin America Market Volume (Sq. Mt.) Forecast by End Use, 2018 to 2033
Table 25: Western Europe Market Value (US$ Million) Forecast by Country, 2018 to 2033
Table 26: Western Europe Market Volume (Sq. Mt.) Forecast by Country, 2018 to 2033
Table 27: Western Europe Market Value (US$ Million) Forecast by Resin, 2018 to 2033
Table 28: Western Europe Market Volume (Sq. Mt.) Forecast by Resin, 2018 to 2033
Table 29: Western Europe Market Value (US$ Million) Forecast by Form, 2018 to 2033
Table 30: Western Europe Market Volume (Sq. Mt.) Forecast by Form, 2018 to 2033
Table 31: Western Europe Market Value (US$ Million) Forecast by End Use, 2018 to 2033
Table 32: Western Europe Market Volume (Sq. Mt.) Forecast by End Use, 2018 to 2033
Table 33: Eastern Europe Market Value (US$ Million) Forecast by Country, 2018 to 2033
Table 34: Eastern Europe Market Volume (Sq. Mt.) Forecast by Country, 2018 to 2033
Table 35: Eastern Europe Market Value (US$ Million) Forecast by Resin, 2018 to 2033
Table 36: Eastern Europe Market Volume (Sq. Mt.) Forecast by Resin, 2018 to 2033
Table 37: Eastern Europe Market Value (US$ Million) Forecast by Form, 2018 to 2033
Table 38: Eastern Europe Market Volume (Sq. Mt.) Forecast by Form, 2018 to 2033
Table 39: Eastern Europe Market Value (US$ Million) Forecast by End Use, 2018 to 2033
Table 40: Eastern Europe Market Volume (Sq. Mt.) Forecast by End Use, 2018 to 2033
Table 41: South Asia and Pacific Market Value (US$ Million) Forecast by Country, 2018 to 2033
Table 42: South Asia and Pacific Market Volume (Sq. Mt.) Forecast by Country, 2018 to 2033
Table 43: South Asia and Pacific Market Value (US$ Million) Forecast by Resin, 2018 to 2033
Table 44: South Asia and Pacific Market Volume (Sq. Mt.) Forecast by Resin, 2018 to 2033
Table 45: South Asia and Pacific Market Value (US$ Million) Forecast by Form, 2018 to 2033
Table 46: South Asia and Pacific Market Volume (Sq. Mt.) Forecast by Form, 2018 to 2033
Table 47: South Asia and Pacific Market Value (US$ Million) Forecast by End Use, 2018 to 2033
Table 48: South Asia and Pacific Market Volume (Sq. Mt.) Forecast by End Use, 2018 to 2033
Table 49: East Asia Market Value (US$ Million) Forecast by Country, 2018 to 2033
Table 50: East Asia Market Volume (Sq. Mt.) Forecast by Country, 2018 to 2033
Table 51: East Asia Market Value (US$ Million) Forecast by Resin, 2018 to 2033
Table 52: East Asia Market Volume (Sq. Mt.) Forecast by Resin, 2018 to 2033
Table 53: East Asia Market Value (US$ Million) Forecast by Form, 2018 to 2033
Table 54: East Asia Market Volume (Sq. Mt.) Forecast by Form, 2018 to 2033
Table 55: East Asia Market Value (US$ Million) Forecast by End Use, 2018 to 2033
Table 56: East Asia Market Volume (Sq. Mt.) Forecast by End Use, 2018 to 2033
Table 57: Middle East and Africa Market Value (US$ Million) Forecast by Country, 2018 to 2033
Table 58: Middle East and Africa Market Volume (Sq. Mt.) Forecast by Country, 2018 to 2033
Table 59: Middle East and Africa Market Value (US$ Million) Forecast by Resin, 2018 to 2033
Table 60: Middle East and Africa Market Volume (Sq. Mt.) Forecast by Resin, 2018 to 2033
Table 61: Middle East and Africa Market Value (US$ Million) Forecast by Form, 2018 to 2033
Table 62: Middle East and Africa Market Volume (Sq. Mt.) Forecast by Form, 2018 to 2033
Table 63: Middle East and Africa Market Value (US$ Million) Forecast by End Use, 2018 to 2033
Table 64: Middle East and Africa Market Volume (Sq. Mt.) Forecast by End Use, 2018 to 2033
Figure 1: Global Market Value (US$ Million) by Resin, 2023 to 2033
Figure 2: Global Market Value (US$ Million) by Form, 2023 to 2033
Figure 3: Global Market Value (US$ Million) by End Use, 2023 to 2033
Figure 4: Global Market Value (US$ Million) by Region, 2023 to 2033
Figure 5: Global Market Value (US$ Million) Analysis by Region, 2018 to 2033
Figure 6: Global Market Volume (Sq. Mt.) Analysis by Region, 2018 to 2033
Figure 7: Global Market Value Share (%) and BPS Analysis by Region, 2023 to 2033
Figure 8: Global Market Y-o-Y Growth (%) Projections by Region, 2023 to 2033
Figure 9: Global Market Value (US$ Million) Analysis by Resin, 2018 to 2033
Figure 10: Global Market Volume (Sq. Mt.) Analysis by Resin, 2018 to 2033
Figure 11: Global Market Value Share (%) and BPS Analysis by Resin, 2023 to 2033
Figure 12: Global Market Y-o-Y Growth (%) Projections by Resin, 2023 to 2033
Figure 13: Global Market Value (US$ Million) Analysis by Form, 2018 to 2033
Figure 14: Global Market Volume (Sq. Mt.) Analysis by Form, 2018 to 2033
Figure 15: Global Market Value Share (%) and BPS Analysis by Form, 2023 to 2033
Figure 16: Global Market Y-o-Y Growth (%) Projections by Form, 2023 to 2033
Figure 17: Global Market Value (US$ Million) Analysis by End Use, 2018 to 2033
Figure 18: Global Market Volume (Sq. Mt.) Analysis by End Use, 2018 to 2033
Figure 19: Global Market Value Share (%) and BPS Analysis by End Use, 2023 to 2033
Figure 20: Global Market Y-o-Y Growth (%) Projections by End Use, 2023 to 2033
Figure 21: Global Market Attractiveness by Resin, 2023 to 2033
Figure 22: Global Market Attractiveness by Form, 2023 to 2033
Figure 23: Global Market Attractiveness by End Use, 2023 to 2033
Figure 24: Global Market Attractiveness by Region, 2023 to 2033
Figure 25: North America Market Value (US$ Million) by Resin, 2023 to 2033
Figure 26: North America Market Value (US$ Million) by Form, 2023 to 2033
Figure 27: North America Market Value (US$ Million) by End Use, 2023 to 2033
Figure 28: North America Market Value (US$ Million) by Country, 2023 to 2033
Figure 29: North America Market Value (US$ Million) Analysis by Country, 2018 to 2033
Figure 30: North America Market Volume (Sq. Mt.) Analysis by Country, 2018 to 2033
Figure 31: North America Market Value Share (%) and BPS Analysis by Country, 2023 to 2033
Figure 32: North America Market Y-o-Y Growth (%) Projections by Country, 2023 to 2033
Figure 33: North America Market Value (US$ Million) Analysis by Resin, 2018 to 2033
Figure 34: North America Market Volume (Sq. Mt.) Analysis by Resin, 2018 to 2033
Figure 35: North America Market Value Share (%) and BPS Analysis by Resin, 2023 to 2033
Figure 36: North America Market Y-o-Y Growth (%) Projections by Resin, 2023 to 2033
Figure 37: North America Market Value (US$ Million) Analysis by Form, 2018 to 2033
Figure 38: North America Market Volume (Sq. Mt.) Analysis by Form, 2018 to 2033
Figure 39: North America Market Value Share (%) and BPS Analysis by Form, 2023 to 2033
Figure 40: North America Market Y-o-Y Growth (%) Projections by Form, 2023 to 2033
Figure 41: North America Market Value (US$ Million) Analysis by End Use, 2018 to 2033
Figure 42: North America Market Volume (Sq. Mt.) Analysis by End Use, 2018 to 2033
Figure 43: North America Market Value Share (%) and BPS Analysis by End Use, 2023 to 2033
Figure 44: North America Market Y-o-Y Growth (%) Projections by End Use, 2023 to 2033
Figure 45: North America Market Attractiveness by Resin, 2023 to 2033
Figure 46: North America Market Attractiveness by Form, 2023 to 2033
Figure 47: North America Market Attractiveness by End Use, 2023 to 2033
Figure 48: North America Market Attractiveness by Country, 2023 to 2033
Figure 49: Latin America Market Value (US$ Million) by Resin, 2023 to 2033
Figure 50: Latin America Market Value (US$ Million) by Form, 2023 to 2033
Figure 51: Latin America Market Value (US$ Million) by End Use, 2023 to 2033
Figure 52: Latin America Market Value (US$ Million) by Country, 2023 to 2033
Figure 53: Latin America Market Value (US$ Million) Analysis by Country, 2018 to 2033
Figure 54: Latin America Market Volume (Sq. Mt.) Analysis by Country, 2018 to 2033
Figure 55: Latin America Market Value Share (%) and BPS Analysis by Country, 2023 to 2033
Figure 56: Latin America Market Y-o-Y Growth (%) Projections by Country, 2023 to 2033
Figure 57: Latin America Market Value (US$ Million) Analysis by Resin, 2018 to 2033
Figure 58: Latin America Market Volume (Sq. Mt.) Analysis by Resin, 2018 to 2033
Figure 59: Latin America Market Value Share (%) and BPS Analysis by Resin, 2023 to 2033
Figure 60: Latin America Market Y-o-Y Growth (%) Projections by Resin, 2023 to 2033
Figure 61: Latin America Market Value (US$ Million) Analysis by Form, 2018 to 2033
Figure 62: Latin America Market Volume (Sq. Mt.) Analysis by Form, 2018 to 2033
Figure 63: Latin America Market Value Share (%) and BPS Analysis by Form, 2023 to 2033
Figure 64: Latin America Market Y-o-Y Growth (%) Projections by Form, 2023 to 2033
Figure 65: Latin America Market Value (US$ Million) Analysis by End Use, 2018 to 2033
Figure 66: Latin America Market Volume (Sq. Mt.) Analysis by End Use, 2018 to 2033
Figure 67: Latin America Market Value Share (%) and BPS Analysis by End Use, 2023 to 2033
Figure 68: Latin America Market Y-o-Y Growth (%) Projections by End Use, 2023 to 2033
Figure 69: Latin America Market Attractiveness by Resin, 2023 to 2033
Figure 70: Latin America Market Attractiveness by Form, 2023 to 2033
Figure 71: Latin America Market Attractiveness by End Use, 2023 to 2033
Figure 72: Latin America Market Attractiveness by Country, 2023 to 2033
Figure 73: Western Europe Market Value (US$ Million) by Resin, 2023 to 2033
Figure 74: Western Europe Market Value (US$ Million) by Form, 2023 to 2033
Figure 75: Western Europe Market Value (US$ Million) by End Use, 2023 to 2033
Figure 76: Western Europe Market Value (US$ Million) by Country, 2023 to 2033
Figure 77: Western Europe Market Value (US$ Million) Analysis by Country, 2018 to 2033
Figure 78: Western Europe Market Volume (Sq. Mt.) Analysis by Country, 2018 to 2033
Figure 79: Western Europe Market Value Share (%) and BPS Analysis by Country, 2023 to 2033
Figure 80: Western Europe Market Y-o-Y Growth (%) Projections by Country, 2023 to 2033
Figure 81: Western Europe Market Value (US$ Million) Analysis by Resin, 2018 to 2033
Figure 82: Western Europe Market Volume (Sq. Mt.) Analysis by Resin, 2018 to 2033
Figure 83: Western Europe Market Value Share (%) and BPS Analysis by Resin, 2023 to 2033
Figure 84: Western Europe Market Y-o-Y Growth (%) Projections by Resin, 2023 to 2033
Figure 85: Western Europe Market Value (US$ Million) Analysis by Form, 2018 to 2033
Figure 86: Western Europe Market Volume (Sq. Mt.) Analysis by Form, 2018 to 2033
Figure 87: Western Europe Market Value Share (%) and BPS Analysis by Form, 2023 to 2033
Figure 88: Western Europe Market Y-o-Y Growth (%) Projections by Form, 2023 to 2033
Figure 89: Western Europe Market Value (US$ Million) Analysis by End Use, 2018 to 2033
Figure 90: Western Europe Market Volume (Sq. Mt.) Analysis by End Use, 2018 to 2033
Figure 91: Western Europe Market Value Share (%) and BPS Analysis by End Use, 2023 to 2033
Figure 92: Western Europe Market Y-o-Y Growth (%) Projections by End Use, 2023 to 2033
Figure 93: Western Europe Market Attractiveness by Resin, 2023 to 2033
Figure 94: Western Europe Market Attractiveness by Form, 2023 to 2033
Figure 95: Western Europe Market Attractiveness by End Use, 2023 to 2033
Figure 96: Western Europe Market Attractiveness by Country, 2023 to 2033
Figure 97: Eastern Europe Market Value (US$ Million) by Resin, 2023 to 2033
Figure 98: Eastern Europe Market Value (US$ Million) by Form, 2023 to 2033
Figure 99: Eastern Europe Market Value (US$ Million) by End Use, 2023 to 2033
Figure 100: Eastern Europe Market Value (US$ Million) by Country, 2023 to 2033
Figure 101: Eastern Europe Market Value (US$ Million) Analysis by Country, 2018 to 2033
Figure 102: Eastern Europe Market Volume (Sq. Mt.) Analysis by Country, 2018 to 2033
Figure 103: Eastern Europe Market Value Share (%) and BPS Analysis by Country, 2023 to 2033
Figure 104: Eastern Europe Market Y-o-Y Growth (%) Projections by Country, 2023 to 2033
Figure 105: Eastern Europe Market Value (US$ Million) Analysis by Resin, 2018 to 2033
Figure 106: Eastern Europe Market Volume (Sq. Mt.) Analysis by Resin, 2018 to 2033
Figure 107: Eastern Europe Market Value Share (%) and BPS Analysis by Resin, 2023 to 2033
Figure 108: Eastern Europe Market Y-o-Y Growth (%) Projections by Resin, 2023 to 2033
Figure 109: Eastern Europe Market Value (US$ Million) Analysis by Form, 2018 to 2033
Figure 110: Eastern Europe Market Volume (Sq. Mt.) Analysis by Form, 2018 to 2033
Figure 111: Eastern Europe Market Value Share (%) and BPS Analysis by Form, 2023 to 2033
Figure 112: Eastern Europe Market Y-o-Y Growth (%) Projections by Form, 2023 to 2033
Figure 113: Eastern Europe Market Value (US$ Million) Analysis by End Use, 2018 to 2033
Figure 114: Eastern Europe Market Volume (Sq. Mt.) Analysis by End Use, 2018 to 2033
Figure 115: Eastern Europe Market Value Share (%) and BPS Analysis by End Use, 2023 to 2033
Figure 116: Eastern Europe Market Y-o-Y Growth (%) Projections by End Use, 2023 to 2033
Figure 117: Eastern Europe Market Attractiveness by Resin, 2023 to 2033
Figure 118: Eastern Europe Market Attractiveness by Form, 2023 to 2033
Figure 119: Eastern Europe Market Attractiveness by End Use, 2023 to 2033
Figure 120: Eastern Europe Market Attractiveness by Country, 2023 to 2033
Figure 121: South Asia and Pacific Market Value (US$ Million) by Resin, 2023 to 2033
Figure 122: South Asia and Pacific Market Value (US$ Million) by Form, 2023 to 2033
Figure 123: South Asia and Pacific Market Value (US$ Million) by End Use, 2023 to 2033
Figure 124: South Asia and Pacific Market Value (US$ Million) by Country, 2023 to 2033
Figure 125: South Asia and Pacific Market Value (US$ Million) Analysis by Country, 2018 to 2033
Figure 126: South Asia and Pacific Market Volume (Sq. Mt.) Analysis by Country, 2018 to 2033
Figure 127: South Asia and Pacific Market Value Share (%) and BPS Analysis by Country, 2023 to 2033
Figure 128: South Asia and Pacific Market Y-o-Y Growth (%) Projections by Country, 2023 to 2033
Figure 129: South Asia and Pacific Market Value (US$ Million) Analysis by Resin, 2018 to 2033
Figure 130: South Asia and Pacific Market Volume (Sq. Mt.) Analysis by Resin, 2018 to 2033
Figure 131: South Asia and Pacific Market Value Share (%) and BPS Analysis by Resin, 2023 to 2033
Figure 132: South Asia and Pacific Market Y-o-Y Growth (%) Projections by Resin, 2023 to 2033
Figure 133: South Asia and Pacific Market Value (US$ Million) Analysis by Form, 2018 to 2033
Figure 134: South Asia and Pacific Market Volume (Sq. Mt.) Analysis by Form, 2018 to 2033
Figure 135: South Asia and Pacific Market Value Share (%) and BPS Analysis by Form, 2023 to 2033
Figure 136: South Asia and Pacific Market Y-o-Y Growth (%) Projections by Form, 2023 to 2033
Figure 137: South Asia and Pacific Market Value (US$ Million) Analysis by End Use, 2018 to 2033
Figure 138: South Asia and Pacific Market Volume (Sq. Mt.) Analysis by End Use, 2018 to 2033
Figure 139: South Asia and Pacific Market Value Share (%) and BPS Analysis by End Use, 2023 to 2033
Figure 140: South Asia and Pacific Market Y-o-Y Growth (%) Projections by End Use, 2023 to 2033
Figure 141: South Asia and Pacific Market Attractiveness by Resin, 2023 to 2033
Figure 142: South Asia and Pacific Market Attractiveness by Form, 2023 to 2033
Figure 143: South Asia and Pacific Market Attractiveness by End Use, 2023 to 2033
Figure 144: South Asia and Pacific Market Attractiveness by Country, 2023 to 2033
Figure 145: East Asia Market Value (US$ Million) by Resin, 2023 to 2033
Figure 146: East Asia Market Value (US$ Million) by Form, 2023 to 2033
Figure 147: East Asia Market Value (US$ Million) by End Use, 2023 to 2033
Figure 148: East Asia Market Value (US$ Million) by Country, 2023 to 2033
Figure 149: East Asia Market Value (US$ Million) Analysis by Country, 2018 to 2033
Figure 150: East Asia Market Volume (Sq. Mt.) Analysis by Country, 2018 to 2033
Figure 151: East Asia Market Value Share (%) and BPS Analysis by Country, 2023 to 2033
Figure 152: East Asia Market Y-o-Y Growth (%) Projections by Country, 2023 to 2033
Figure 153: East Asia Market Value (US$ Million) Analysis by Resin, 2018 to 2033
Figure 154: East Asia Market Volume (Sq. Mt.) Analysis by Resin, 2018 to 2033
Figure 155: East Asia Market Value Share (%) and BPS Analysis by Resin, 2023 to 2033
Figure 156: East Asia Market Y-o-Y Growth (%) Projections by Resin, 2023 to 2033
Figure 157: East Asia Market Value (US$ Million) Analysis by Form, 2018 to 2033
Figure 158: East Asia Market Volume (Sq. Mt.) Analysis by Form, 2018 to 2033
Figure 159: East Asia Market Value Share (%) and BPS Analysis by Form, 2023 to 2033
Figure 160: East Asia Market Y-o-Y Growth (%) Projections by Form, 2023 to 2033
Figure 161: East Asia Market Value (US$ Million) Analysis by End Use, 2018 to 2033
Figure 162: East Asia Market Volume (Sq. Mt.) Analysis by End Use, 2018 to 2033
Figure 163: East Asia Market Value Share (%) and BPS Analysis by End Use, 2023 to 2033
Figure 164: East Asia Market Y-o-Y Growth (%) Projections by End Use, 2023 to 2033
Figure 165: East Asia Market Attractiveness by Resin, 2023 to 2033
Figure 166: East Asia Market Attractiveness by Form, 2023 to 2033
Figure 167: East Asia Market Attractiveness by End Use, 2023 to 2033
Figure 168: East Asia Market Attractiveness by Country, 2023 to 2033
Figure 169: Middle East and Africa Market Value (US$ Million) by Resin, 2023 to 2033
Figure 170: Middle East and Africa Market Value (US$ Million) by Form, 2023 to 2033
Figure 171: Middle East and Africa Market Value (US$ Million) by End Use, 2023 to 2033
Figure 172: Middle East and Africa Market Value (US$ Million) by Country, 2023 to 2033
Figure 173: Middle East and Africa Market Value (US$ Million) Analysis by Country, 2018 to 2033
Figure 174: Middle East and Africa Market Volume (Sq. Mt.) Analysis by Country, 2018 to 2033
Figure 175: Middle East and Africa Market Value Share (%) and BPS Analysis by Country, 2023 to 2033
Figure 176: Middle East and Africa Market Y-o-Y Growth (%) Projections by Country, 2023 to 2033
Figure 177: Middle East and Africa Market Value (US$ Million) Analysis by Resin, 2018 to 2033
Figure 178: Middle East and Africa Market Volume (Sq. Mt.) Analysis by Resin, 2018 to 2033
Figure 179: Middle East and Africa Market Value Share (%) and BPS Analysis by Resin, 2023 to 2033
Figure 180: Middle East and Africa Market Y-o-Y Growth (%) Projections by Resin, 2023 to 2033
Figure 181: Middle East and Africa Market Value (US$ Million) Analysis by Form, 2018 to 2033
Figure 182: Middle East and Africa Market Volume (Sq. Mt.) Analysis by Form, 2018 to 2033
Figure 183: Middle East and Africa Market Value Share (%) and BPS Analysis by Form, 2023 to 2033
Figure 184: Middle East and Africa Market Y-o-Y Growth (%) Projections by Form, 2023 to 2033
Figure 185: Middle East and Africa Market Value (US$ Million) Analysis by End Use, 2018 to 2033
Figure 186: Middle East and Africa Market Volume (Sq. Mt.) Analysis by End Use, 2018 to 2033
Figure 187: Middle East and Africa Market Value Share (%) and BPS Analysis by End Use, 2023 to 2033
Figure 188: Middle East and Africa Market Y-o-Y Growth (%) Projections by End Use, 2023 to 2033
Figure 189: Middle East and Africa Market Attractiveness by Resin, 2023 to 2033
Figure 190: Middle East and Africa Market Attractiveness by Form, 2023 to 2033
Figure 191: Middle East and Africa Market Attractiveness by End Use, 2023 to 2033
Figure 192: Middle East and Africa Market Attractiveness by Country, 2023 to 2033
The carbon tapes sector is estimated to be worth USD 3.7 billion in 2023.
The carbon tapes industry is expected to have a CAGR of 4.6% by 2033.
The carbon tapes industry expanded at a share of USD 3.6 billion in 2022.
North America expanded in the carbon tapes business, with a share of 26.4% in 2022.
The carbon tapes sector is expected to have a valuation of USD 5.8 billion by 2033.
Explore Similar Insights
Thank you!
You will receive an email from our Business Development Manager. Please be sure to check your SPAM/JUNK folder too.