Carbon Free Hose Market Size, Share & Forecast Outlook 2025 to 2035

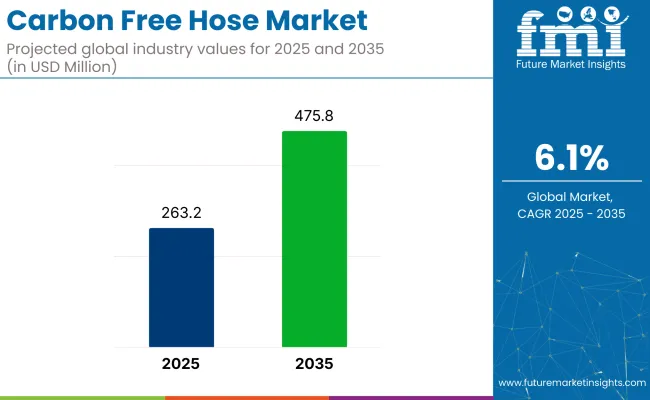
The carbon free hose market is projected to grow from USD 263.2 million in 2025 to USD 475.8 million by 2035, registering a CAGR of 6.1% during the forecast period.
Quick Stats in the Carbon Free Hose Market

  • Market Value (2025): USD 263.2 million
  • Forecast Value (2035): USD 475.8 million
  • Forecast CAGR: 6.1%
  • Leading Segment in 2025: Up to 25 mm (22% share)
  • Key Growth Region: Asia Pacific (China, 6.9% CAGR)
  • Top Key Players: Gates Corporation, Parker Hannifin, JYM Hose, Kwik-Flex Industries, Indomaksson

Carbon Free Hose Market

Growth is driven by the increasing demand for non-conductive hoses across industries such as automotive, construction, and industrial manufacturing. The hoses are being increasingly adopted due to their low leakage current and non-toxic materials, providing safer alternatives to traditional hoses used in electrical and chemical applications.

The carbon free hose market holds a specialized share within its parent markets. Within the rubber and plastic hose market, it accounts for approximately 2-3%, as carbon free hoses are a niche product designed for specific applications. In the automotive parts and components market, its share is around 1-2%, as these hoses are used primarily in high-performance automotive applications where contamination risks are critical.

Within the industrial equipment market, the share is approximately 3-4%, driven by the need for durable, non-contaminating hoses in various machinery and systems. In the hydraulic equipment market, carbon free hoses contribute around 2-3%, especially in hydraulic systems that require high standards of cleanliness and performance. In the construction and infrastructure market, its share is about 1-2%, used mainly in specialized applications to prevent contamination.

In April 2025, Continental commissioned a new production line for hydrogen hoses at its location in Korbach, expanding the company’s ability to provide safe and efficient solutions along the entire hydrogen value chain.

This facility, an investment of around €3 million, will offer products for hydrogen production, transportation, storage, distribution, and use in fuel cells and refueling applications for cars, trucks, ships, and aircraft. This move aligns with Continental's commitment to supporting the growing hydrogen economy by providing solutions for industries transitioning to clean energy.

Analyzing Carbon Free Hose Market by Top Investment Segments

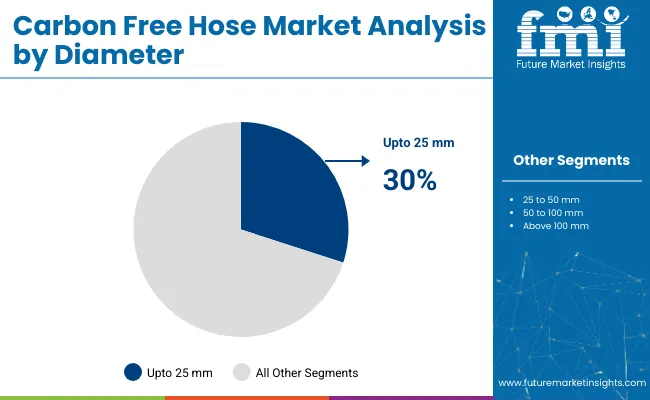
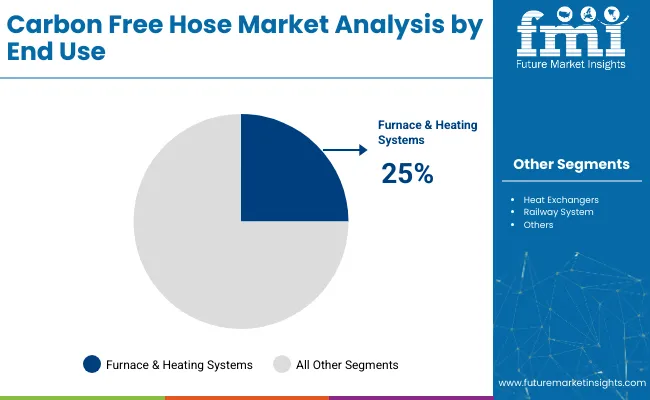
The industry is expected to grow steadily, with standard-duty hoses capturing 40% of the industry share in 2025. Hoses with diameters up to 25 mm are projected to hold 30%, while furnace & heating systems are expected to account for 25% of the end-use segment.

Standard duty hoses lead the pressure rating segment with 40% industry share

The standard-duty segment is anticipated to hold 40% of the industry share in 2025. Standard-duty hoses are widely used due to their versatility and suitability for a wide range of applications, particularly in industries requiring moderate pressure handling.

These hoses provide an effective balance between cost and performance, making them ideal for general-purpose applications in sectors such as manufacturing, construction, and automotive. The demand for standard-duty hoses is driven by their ability to withstand everyday pressure conditions without sacrificing durability or performance, particularly in environments with moderate fluid or gas pressures.

  • Widely used in industries with moderate pressure demands
  • Ideal balance between cost and performance for general-purpose applications
  • High demand in manufacturing, construction, and automotive sectors

Up to 25 mm diameter hoses expected to capture 30% industry share

Hoses with diameters up to 25 mm are projected to account for 30% of the industry in 2025. Smaller-diameter hoses are preferred for applications where compact and flexible hoses are necessary for ease of installation and handling. These hoses are commonly used in environments with space constraints, such as in laboratory equipment, medical devices, and various industrial machinery.

Their ability to efficiently transfer fluids and gases while maintaining structural integrity under low to moderate pressure makes them ideal for numerous industries, including pharmaceuticals and automotive. The demand for smaller diameter hoses continues to rise due to their ease of use and compact design.
  • Preferred for applications with space constraints and compact installations
  • Ideal for low to moderate pressure fluid and gas transfer
  • Increasing demand in pharmaceuticals, medical, and automotive sectors

Carbon Free Hose Market Analysis By Diameter

Furnace & heating systems to drive 25% of the end-use industry share

Furnace and heating systems are expected to dominate the end-use segment of the industry, capturing 25% of the share in 2025. These hoses are used in furnace and heating systems to transport high-temperature gases and fluids safely. The rise in demand for efficient and durable hoses in industrial heating applications drives the need for the hoses that can withstand elevated temperatures and harsh environments.

The growth in the construction of new industrial heating plants and the replacement of old systems further contributes to the demand for the hoses in this segment.
  • Essential for high-temperature fluid and gas transportation in heating systems
  • Increasing use in furnace systems requiring durable and safe hose solutions
  • Demand driven by industrial heating plant construction and system upgrades

Carbon Free Hose Market Analysis By End Use

Top Carbon Free Hose Market Dynamics

The industry is growing due to increasing demand for eco-friendly products and stricter environmental regulations. However, high production costs and limited consumer awareness are hindering widespread adoption, especially among small and medium-sized businesses.

Rising Demand for Eco-Friendly Materials and Environmental Regulations Are Driving Industry Growth

The industry is expanding due to increased demand for environmentally friendly products and stricter environmental regulations. Industries are under growing pressure to reduce their environmental impact, and the hoses are increasingly preferred for their reduced ecological footprint.

Sectors like automotive, food processing, and pharmaceuticals are adopting these hoses to comply with green standards. Advancements in material technology have further improved the performance, durability, and cost-effectiveness of the hoses, broadening their application across industries.

  • Growing environmental concerns and regulations are driving demand for eco-friendly hoses.
  • The hoses are preferred for their reduced ecological footprint and compliance with green standards.
  • Cutting-edge technology has enhanced the durability and cost-effectiveness of hoses, expanding their applications.

High Production Costs and Limited Consumer Awareness Are Hindering Broader Adoption

Despite the growing interest, challenges such as high production costs and limited consumer awareness remain barriers to wider adoption. Carbon-free materials typically come at a higher price compared to traditional options, which makes it difficult for small and medium-sized businesses to invest in these eco-friendly solutions. Additionally, the lack of widespread understanding regarding the long-term cost savings and environmental benefits of the hoses contributes to reluctance among companies to switch from conventional hoses.
  • Higher production costs of the hoses compared to traditional materials hinder adoption.
  • Limited consumer awareness about the long-term cost savings and environmental benefits slows industry penetration.
  • Small and medium-sized businesses struggle to adopt the hoses due to financial and awareness barriers.

Analyzing Top Countries Manufacturing, Distributing, and Supplying Carbon Free Hose Solutions

Country Wise Analysis Of Carbon Free Hose Market Cagr 2025 To 2035

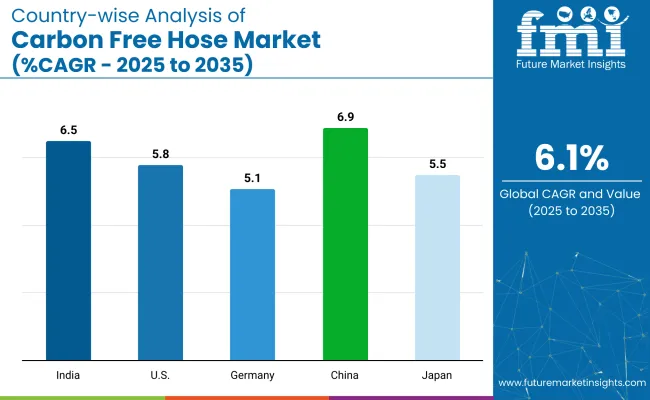
Countries CAGR (2025 to 2035)
United States 5.8%
China 6.9%
Germany 5.1%
India 6.5%
Japan 5.5%

The global carbon free hose market is projected to grow at a CAGR of 6.1% from 2025 to 2035. The United States, with a CAGR of 5.8%, shows steady growth, driven by increasing demand in industries such as automotive, manufacturing, and construction. China, at 6.9%, demonstrates stronger growth, supported by its expanding industrial base, large manufacturing sector, and growing adoption of eco-friendly products.

Germany, with a CAGR of 5.1%, reflects moderate growth, benefiting from strong demand in the European industrial market, although at a slightly slower pace. India, at 6.5%, sees solid growth due to rapid industrialization, infrastructure development, and increasing environmental awareness.

Japan, with a CAGR of 5.5%, experiences steady growth, driven by the demand for high-quality, environmentally-friendly products in industrial applications. While OECD countries show moderate growth, China and India are the fastest-growing industries, indicating the rising role of emerging economies in shaping the future of the industry.

The report covers in-depth analysis of 40+ countries; five top-performing OECD and BRICS countries are highlighted below.

Growth Analysis of Carbon Free Hose Market in the United States

The sales in the United States are set to record a CAGR of 5.8% through 2035. Growth has been supported by innovation-driven upgrades in industrial fluid systems and evolving OEM procurement standards. Major players such as Gates, Eaton, and Parker Hannifin have invested in performance-grade carbon-free variants tailored for aerospace, manufacturing, and auto components.

Environmental compliance protocols from agencies like the EPA have reinforced the shift away from conventional rubber hoses containing carbon black. Enhanced durability and chemical resistance have made these hoses preferable in high-temperature and heavy-duty settings. The USA remains a leading contributor to the hose production and application development.

  • Defense and aerospace OEMs have integrated hoses into retrofitted engine cooling systems.
  • State-led clean manufacturing subsidies have improved local adoption in Tier 1 supplier networks.
  • Hose design incorporating flame-retardant and non-marking features has been prioritized in automotive assembly lines.

Demand Forecast for Carbon Free Hose Market in China

Demand for the hoses in China is estimated to grow at a CAGR of 6.9% through 2035. Rapid industrial diversification and environmental enforcement across key sectors are accelerating the transition to non-carbon components in hydraulic and pneumatic systems. Domestic manufacturers such as Zhejiang Tianyao and Hebei Qianli Rubber Products are expanding multi-layer hose production using halogen-free materials.

Large-scale government investments in emission-compliant production under the “Made in China 2025” initiative have boosted R&D for polymer blends. Supply-chain resilience, especially in the construction and mining sectors, is being built around safer and recyclable hose formats.

  • New building-code updates have mandated non-toxic hose infrastructure in industrial zones.
  • Agriculture and irrigation projects have switched to carbon-free variants to comply with groundwater protection rules.
  • Provincial industrial parks have been offered fiscal incentives for low-emission hose conversion.

Future Outlook for Carbon Free Hose Market in Germany

The industry in Germany is projected to grow at a CAGR of 5.1% through 2035. The country’s mature industrial ecosystem and environmental enforcement have created a high-barrier, quality-focused industry for hose systems. Continental AG and Manuli Hydraulics continue to lead innovations in low-emission hose materials tailored for Tier 1 automotive suppliers and precision tooling factories.

Germany’s technical standard DIN 73379 and EU RoHS directives have eliminated carbon black from multiple hose lines. Increased demand for noise-reduction, chemical resistance, and thermal stability has redefined performance benchmarks across OEMs.

  • Advanced industrial parks in Bavaria have adopted zero-soot hoses in compressor systems.
  • Automotive brands now mandate carbon-free compatibility for under-the-hood fluid transport.
  • Custom hose fabrication using elastomer compounds has seen a rise in R&D grants from regional tech clusters.

Analysis of Carbon Free Hose Market in India

The industry in India is set to record a CAGR of 6.5% through 2035. Expansion has been led by growing industrial output, upgrades in fluid engineering systems, and public-sector green manufacturing programs. Local firms along with multinationals like Parker Hannifin have diversified offerings into agriculture and construction-grade hoses using EPDM and silicon blends.

Bureau of Indian Standards (BIS) certification updates have phased out low-grade rubber compounds, favoring eco-compliant variants. National missions in clean transportation and smart infrastructure have increased institutional procurement of hoses with higher abrasion resistance and minimal emissions.

  • The hoses have been introduced in cold-chain logistics for pharma and perishables.
  • New powerplant setups under NTPC have demanded halogen-free and flame-resistant hoses.
  • Ministry-backed industrial clusters now require periodic carbon emissions audits of hose assemblies.

Premium Carbon Free Hose Market Growth Outlook in Japan

Sales of the hoses in Japan are forecasted to grow at a CAGR of 5.5% through 2035. Regulatory pressures, alongside industrial robotics adoption, have sustained Japan’s demand for low-soot, high-resilience hose systems. Sumitomo Riko, Bridgestone, and Toyox have developed multilayered, lightweight hose models with advanced thermal shielding.

Compliance with Japan Industrial Standards (JIS) and global ISO frameworks has made these hoses essential in automated production lines. High-end automotive, mechatronics, and heavy equipment sectors have shifted toward carbon-free specifications, driven by OEM mandates and supplier scoring programs.

  • Robotics assembly plants have integrated hoses in air-tool systems.
  • EV battery-cooling modules now rely on halogen-free hose assemblies.
  • Hose manufacturers are partnering with universities for new elastomer R&D using renewable inputs.

Leading Carbon Free Hose Market Players

The carbon free hose market is characterized by dominant players, key players, and emerging firms. Gates Corporation is a dominant player, known for its high-performance Gates® Carbon Free Hose Series, designed to prevent static electricity buildup and eliminate carbon black content.

Key players in the industry include Parker Hannifin Corporation, which offers a comprehensive range of industrial hoses meeting stringent safety and performance standards; Continental AG, a global leader in rubber and plastic technology, providing durable hoses for various industrial applications; and Eaton Corporation, known for its reliable industrial hoses.

Emerging players such as Dantec, a UK-based manufacturer specializing in composite hoses, and SGL Carbon, which focuses on carbon-free solutions and material advancements, are expanding their industry presence.

Recent Carbon Free Hose Industry News

  • In March 2025, Gates Corporation launched the Data Master MegaFlex, a groundbreaking large-diameter cooling hose designed for high-flow liquid cooling systems in data centers.This innovation expands Gates' data center product portfolio, complementing the Data Master small-diameter hose introduced in 2024.
  • In June, 2025, Eaton and Siemens Energy announced their collaboration to accelerate the delivery of new data center capacity. This partnership focuses on integrated modular data center construction, designed to bring capacity online quickly to meet the growing global demand for AI and cloud computing. A key element of this collaboration is standardized on-site power generation, which will be crucial in accelerating the development of new data centers.

Research Coverage and Scope Summary

Report Attributes Details
Industry Size (2025) USD 263.2 million
Projected Industry Size (2035) USD 475.8 million
CAGR (2025 to 2035) 6.1%
Base Year for Estimation 2024
Historical Period 2020 to 2024
Projections Period 2025 to 2035
Quantitative Units USD million for value and million meters for volume
Pressure Ratings Analyzed (Segment 1) Standard Duty, Medium Duty, Heavy Duty
Diameters Analyzed (Segment 2) Up to 25 mm, 25 to 50 mm, 50 to 100 mm, Above 100 mm
End Uses Analyzed (Segment 3) Furnace & Heating Systems, Automotive & Transportation, Heat Exchangers, Electrical & Heavy Appliances, Railway System, Others
Regions Covered North America, Latin America, Eastern Europe, Western Europe, South Asia & Pacific, East Asia, Middle East & Africa
Countries Covered United States, Canada, Germany, United Kingdom, France, Italy, Spain, China, India, Japan, South Korea, Australia, Brazil, Mexico, Argentina, Saudi Arabia, UAE, South Africa
Key Players influencing the Industry Gates Corporation, Parker Hannifin, JYM Hose, Kwik-Flex Industries, Indomaksson, Polyhose, JK Fenner Ltd
Additional Attributes Dollar sales, share by pressure rating and diameter, increasing demand in automotive and industrial sectors, innovations in heavy-duty hose applications, regional industry penetration trends

Key Players in the Carbon Free Hose Market

  • Gates Corporation
  • Parker Hannifin
  • JYM Hose
  • Kwik-Flex Industries
  • Indomaksson
  • Polyhose
  • JK Fenner Ltd

Carbon Free Hose Market Analyzed by Key Investment Segments

By Pressure Rating:

The industry is segmented into standard duty, medium duty, and heavy duty.

By Diameter:

The industry includes hoses with diameters up to 25 mm, 25 to 50 mm, 50 to 100 mm, and above 100 mm.

By End Use:

The industry covers furnace & heating systems, automotive & transportation, heat exchangers, electrical & heavy appliances, railway systems, and others.

By Region:

The industry spans North America, Latin America, Eastern Europe, Western Europe, South Asia & Pacific, East Asia, and Middle East & Africa.

Table of Content

  1. Executive Summary
    • Global Market Outlook
    • Demand-side Trends
    • Supply-side Trends
    • Technology Roadmap Analysis
    • Analysis and Recommendations
  2. Market Overview
    • Market Coverage / Taxonomy
    • Market Definition / Scope / Limitations
  3. Market Background
    • Market Dynamics
      • Drivers
      • Restraints
      • Opportunity
      • Trends
    • Scenario Forecast
      • Demand in Optimistic Scenario
      • Demand in Likely Scenario
      • Demand in Conservative Scenario
    • Opportunity Map Analysis
    • Product Life Cycle Analysis
    • Supply Chain Analysis
      • Supply Side Participants and their Roles
        • Producers
        • Mid-Level Participants (Traders/ Agents/ Brokers)
        • Wholesalers and Distributors
      • Value Added and Value Created at Node in the Supply Chain
      • List of Raw Material Suppliers
      • List of Existing and Potential Buyer’s
    • Investment Feasibility Matrix
    • Value Chain Analysis
      • Profit Margin Analysis
      • Wholesalers and Distributors
      • Retailers
    • PESTLE and Porter’s Analysis
    • Regulatory Landscape
      • By Key Regions
      • By Key Countries
    • Regional Parent Market Outlook
    • Production and Consumption Statistics
    • Import and Export Statistics
  4. Global Market Analysis 2020 to 2024 and Forecast, 2025 to 2035
    • Historical Market Size Value (USD Million) & Volume (Million Meter) Analysis, 2020 to 2024
    • Current and Future Market Size Value (USD Million) & Volume (Million Meter) Projections, 2025 to 2035
      • Y-o-Y Growth Trend Analysis
      • Absolute $ Opportunity Analysis
  5. Global Market Pricing Analysis 2020 to 2024 and Forecast 2025 to 2035
  6. Global Market Analysis 2020 to 2024 and Forecast 2025 to 2035, By Pressure Rating
    • Introduction / Key Findings
    • Historical Market Size Value (USD Million) & Volume (Million Meter) Analysis By Pressure Rating, 2020 to 2024
    • Current and Future Market Size Value (USD Million) & Volume (Million Meter) Analysis and Forecast By Pressure Rating, 2025 to 2035
      • Standard Duty
      • Medium Duty
      • Heavy Duty
    • Y-o-Y Growth Trend Analysis By Pressure Rating, 2020 to 2024
    • Absolute $ Opportunity Analysis By Pressure Rating, 2025 to 2035
  7. Global Market Analysis 2020 to 2024 and Forecast 2025 to 2035, By Diameter
    • Introduction / Key Findings
    • Historical Market Size Value (USD Million) & Volume (Million Meter) Analysis By Diameter, 2020 to 2024
    • Current and Future Market Size Value (USD Million) & Volume (Million Meter) Analysis and Forecast By Diameter, 2025 to 2035
      • Upto 25 mm
      • 25 to 50 mm
      • 50 to 100 mm
      • Above 100 mm
    • Y-o-Y Growth Trend Analysis By Diameter, 2020 to 2024
    • Absolute $ Opportunity Analysis By Diameter, 2025 to 2035
  8. Global Market Analysis 2020 to 2024 and Forecast 2025 to 2035, By End Use
    • Introduction / Key Findings
    • Historical Market Size Value (USD Million) & Volume (Million Meter) Analysis By End Use, 2020 to 2024
    • Current and Future Market Size Value (USD Million) & Volume (Million Meter) Analysis and Forecast By End Use, 2025 to 2035
      • Furnace & Heating Systems
      • Automotive & Transportation
      • Heat Exchangers
      • Electrical & Heavy Appliances
      • Railway System
      • Others
    • Y-o-Y Growth Trend Analysis By End Use, 2020 to 2024
    • Absolute $ Opportunity Analysis By End Use, 2025 to 2035
  9. Global Market Analysis 2020 to 2024 and Forecast 2025 to 2035, By Region
    • Introduction
    • Historical Market Size Value (USD Million) & Volume (Million Meter) Analysis By Region, 2020 to 2024
    • Current Market Size Value (USD Million) & Volume (Million Meter) Analysis and Forecast By Region, 2025 to 2035
      • North America
      • Latin America
      • Western Europe
      • Eastern Europe
      • East Asia
      • South Asia & Pacific
      • Middle East and Africa
    • Market Attractiveness Analysis By Region
  10. North America Market Analysis 2020 to 2024 and Forecast 2025 to 2035, By Country
    • Historical Market Size Value (USD Million) & Volume (Million Meter) Trend Analysis By Market Taxonomy, 2020 to 2024
    • Market Size Value (USD Million) & Volume (Million Meter) Forecast By Market Taxonomy, 2025 to 2035
      • By Country
        • USA
        • Canada
        • Mexico
      • By Pressure Rating
      • By Diameter
      • By End Use
    • Market Attractiveness Analysis
      • By Country
      • By Pressure Rating
      • By Diameter
      • By End Use
    • Key Takeaways
  11. Latin America Market Analysis 2020 to 2024 and Forecast 2025 to 2035, By Country
    • Historical Market Size Value (USD Million) & Volume (Million Meter) Trend Analysis By Market Taxonomy, 2020 to 2024
    • Market Size Value (USD Million) & Volume (Million Meter) Forecast By Market Taxonomy, 2025 to 2035
      • By Country
        • Brazil
        • Argentina
        • Rest of LATAM
      • By Pressure Rating
      • By Diameter
      • By End Use
    • Market Attractiveness Analysis
      • By Country
      • By Pressure Rating
      • By Diameter
      • By End Use
    • Key Takeaways
  12. Western Europe Market Analysis 2020 to 2024 and Forecast 2025 to 2035, By Country
    • Historical Market Size Value (USD Million) & Volume (Million Meter) Trend Analysis By Market Taxonomy, 2020 to 2024
    • Market Size Value (USD Million) & Volume (Million Meter) Forecast By Market Taxonomy, 2025 to 2035
      • By Country
        • Germany
        • Italy
        • France
        • UK
        • Spain
        • BENELUX
        • Nordic
        • Rest of W.Europe
      • By Pressure Rating
      • By Diameter
      • By End Use
    • Market Attractiveness Analysis
      • By Country
      • By Pressure Rating
      • By Diameter
      • By End Use
    • Key Takeaways
  13. Eastern Europe Market Analysis 2020 to 2024 and Forecast 2025 to 2035, By Country
    • Historical Market Size Value (USD Million) & Volume (Million Meter) Trend Analysis By Market Taxonomy, 2020 to 2024
    • Market Size Value (USD Million) & Volume (Million Meter) Forecast By Market Taxonomy, 2025 to 2035
      • By Country
        • Russia
        • Hungary
        • Poland
        • Balkan & Baltics
        • Rest of E. Europe
      • By Pressure Rating
      • By Diameter
      • By End Use
    • Market Attractiveness Analysis
      • By Country
      • By Pressure Rating
      • By Diameter
      • By End Use
    • Key Takeaways
  14. East Asia Market Analysis 2020 to 2024 and Forecast 2025 to 2035, By Country
    • Historical Market Size Value (USD Million) & Volume (Million Meter) Trend Analysis By Market Taxonomy, 2020 to 2024
    • Market Size Value (USD Million) & Volume (Million Meter) Forecast By Market Taxonomy, 2025 to 2035
      • By Country
        • China
        • Japan
        • South Korea
      • By Pressure Rating
      • By Diameter
      • By End Use
    • Market Attractiveness Analysis
      • By Country
      • By Pressure Rating
      • By Diameter
      • By End Use
    • Key Takeaways
  15. South Asia & Pacific Market Analysis 2020 to 2024 and Forecast 2025 to 2035, By Country
    • Historical Market Size Value (USD Million) & Volume (Million Meter) Trend Analysis By Market Taxonomy, 2020 to 2024
    • Market Size Value (USD Million) & Volume (Million Meter) Forecast By Market Taxonomy, 2025 to 2035
      • By Country
        • India
        • Australia & New Zealand
        • ASEAN
        • Rest of SAP
      • By Pressure Rating
      • By Diameter
      • By End Use
    • Market Attractiveness Analysis
      • By Country
      • By Pressure Rating
      • By Diameter
      • By End Use
    • Key Takeaways
  16. Middle East and Africa Market Analysis 2020 to 2024 and Forecast 2025 to 2035, By Country
    • Historical Market Size Value (USD Million) & Volume (Million Meter) Trend Analysis By Market Taxonomy, 2020 to 2024
    • Market Size Value (USD Million) & Volume (Million Meter) Forecast By Market Taxonomy, 2025 to 2035
      • By Country
        • GCC Countries
        • Northern Africa
        • South Africa
        • Turkiye
        • Rest of MEA
      • By Pressure Rating
      • By Diameter
      • By End Use
    • Market Attractiveness Analysis
      • By Country
      • By Pressure Rating
      • By Diameter
      • By End Use
    • Key Takeaways
  17. Key Countries Market Analysis
    • USA
      • Pricing Analysis
      • Market Share Analysis, 2024
        • By Pressure Rating
        • By Diameter
        • By End Use
    • Canada
      • Pricing Analysis
      • Market Share Analysis, 2024
        • By Pressure Rating
        • By Diameter
        • By End Use
    • Brazil
      • Pricing Analysis
      • Market Share Analysis, 2024
        • By Pressure Rating
        • By Diameter
        • By End Use
    • Mexico
      • Pricing Analysis
      • Market Share Analysis, 2024
        • By Pressure Rating
        • By Diameter
        • By End Use
    • Argentina
      • Pricing Analysis
      • Market Share Analysis, 2024
        • By Pressure Rating
        • By Diameter
        • By End Use
  18. Market Structure Analysis
    • Competition Dashboard
    • Competition Benchmarking
    • Market Share Analysis of Top Players
      • By Regional
      • By Pressure Rating
      • By Diameter
      • By End Use
  19. Competition Analysis
    • Competition Deep Dive
      • Gates Corporation
        • Overview
        • Product Portfolio
        • Profitability by Market Segments (Product/Age /Sales Channel/Region)
        • Sales Footprint
        • Strategy Overview
          • Marketing Strategy
          • Product Strategy
          • Channel Strategy
      • Parker Hannifin
        • Overview
        • Product Portfolio
        • Profitability by Market Segments (Product/Age /Sales Channel/Region)
        • Sales Footprint
        • Strategy Overview
          • Marketing Strategy
          • Product Strategy
          • Channel Strategy
      • JYM Hose
        • Overview
        • Product Portfolio
        • Profitability by Market Segments (Product/Age /Sales Channel/Region)
        • Sales Footprint
        • Strategy Overview
          • Marketing Strategy
          • Product Strategy
          • Channel Strategy
      • Kwik-Flex Industries
        • Overview
        • Product Portfolio
        • Profitability by Market Segments (Product/Age /Sales Channel/Region)
        • Sales Footprint
        • Strategy Overview
          • Marketing Strategy
          • Product Strategy
          • Channel Strategy
      • Indomaksson
        • Overview
        • Product Portfolio
        • Profitability by Market Segments (Product/Age /Sales Channel/Region)
        • Sales Footprint
        • Strategy Overview
          • Marketing Strategy
          • Product Strategy
          • Channel Strategy
      • Polyhose
        • Overview
        • Product Portfolio
        • Profitability by Market Segments (Product/Age /Sales Channel/Region)
        • Sales Footprint
        • Strategy Overview
          • Marketing Strategy
          • Product Strategy
          • Channel Strategy
      • JK Fenner Ltd
        • Overview
        • Product Portfolio
        • Profitability by Market Segments (Product/Age /Sales Channel/Region)
        • Sales Footprint
        • Strategy Overview
          • Marketing Strategy
          • Product Strategy
          • Channel Strategy
  20. Assumptions & Acronyms Used
  21. Research Methodology

List of Tables

  • Table 1: Global Market Value (USD Million) Forecast by Region, 2020 to 2035
  • Table 2: Global Market Volume (Million Meter) Forecast by Region, 2020 to 2035
  • Table 3: Global Market Value (USD Million) Forecast by Pressure Rating, 2020 to 2035
  • Table 4: Global Market Volume (Million Meter) Forecast by Pressure Rating, 2020 to 2035
  • Table 5: Global Market Value (USD Million) Forecast by Diameter, 2020 to 2035
  • Table 6: Global Market Volume (Million Meter) Forecast by Diameter, 2020 to 2035
  • Table 7: Global Market Value (USD Million) Forecast by End Use, 2020 to 2035
  • Table 8: Global Market Volume (Million Meter) Forecast by End Use, 2020 to 2035
  • Table 9: North America Market Value (USD Million) Forecast by Country, 2020 to 2035
  • Table 10: North America Market Volume (Million Meter) Forecast by Country, 2020 to 2035
  • Table 11: North America Market Value (USD Million) Forecast by Pressure Rating, 2020 to 2035
  • Table 12: North America Market Volume (Million Meter) Forecast by Pressure Rating, 2020 to 2035
  • Table 13: North America Market Value (USD Million) Forecast by Diameter, 2020 to 2035
  • Table 14: North America Market Volume (Million Meter) Forecast by Diameter, 2020 to 2035
  • Table 15: North America Market Value (USD Million) Forecast by End Use, 2020 to 2035
  • Table 16: North America Market Volume (Million Meter) Forecast by End Use, 2020 to 2035
  • Table 17: Latin America Market Value (USD Million) Forecast by Country, 2020 to 2035
  • Table 18: Latin America Market Volume (Million Meter) Forecast by Country, 2020 to 2035
  • Table 19: Latin America Market Value (USD Million) Forecast by Pressure Rating, 2020 to 2035
  • Table 20: Latin America Market Volume (Million Meter) Forecast by Pressure Rating, 2020 to 2035
  • Table 21: Latin America Market Value (USD Million) Forecast by Diameter, 2020 to 2035
  • Table 22: Latin America Market Volume (Million Meter) Forecast by Diameter, 2020 to 2035
  • Table 23: Latin America Market Value (USD Million) Forecast by End Use, 2020 to 2035
  • Table 24: Latin America Market Volume (Million Meter) Forecast by End Use, 2020 to 2035
  • Table 25: Western Europe Market Value (USD Million) Forecast by Country, 2020 to 2035
  • Table 26: Western Europe Market Volume (Million Meter) Forecast by Country, 2020 to 2035
  • Table 27: Western Europe Market Value (USD Million) Forecast by Pressure Rating, 2020 to 2035
  • Table 28: Western Europe Market Volume (Million Meter) Forecast by Pressure Rating, 2020 to 2035
  • Table 29: Western Europe Market Value (USD Million) Forecast by Diameter, 2020 to 2035
  • Table 30: Western Europe Market Volume (Million Meter) Forecast by Diameter, 2020 to 2035
  • Table 31: Western Europe Market Value (USD Million) Forecast by End Use, 2020 to 2035
  • Table 32: Western Europe Market Volume (Million Meter) Forecast by End Use, 2020 to 2035
  • Table 33: Eastern Europe Market Value (USD Million) Forecast by Country, 2020 to 2035
  • Table 34: Eastern Europe Market Volume (Million Meter) Forecast by Country, 2020 to 2035
  • Table 35: Eastern Europe Market Value (USD Million) Forecast by Pressure Rating, 2020 to 2035
  • Table 36: Eastern Europe Market Volume (Million Meter) Forecast by Pressure Rating, 2020 to 2035
  • Table 37: Eastern Europe Market Value (USD Million) Forecast by Diameter, 2020 to 2035
  • Table 38: Eastern Europe Market Volume (Million Meter) Forecast by Diameter, 2020 to 2035
  • Table 39: Eastern Europe Market Value (USD Million) Forecast by End Use, 2020 to 2035
  • Table 40: Eastern Europe Market Volume (Million Meter) Forecast by End Use, 2020 to 2035
  • Table 41: East Asia Market Value (USD Million) Forecast by Country, 2020 to 2035
  • Table 42: East Asia Market Volume (Million Meter) Forecast by Country, 2020 to 2035
  • Table 43: East Asia Market Value (USD Million) Forecast by Pressure Rating, 2020 to 2035
  • Table 44: East Asia Market Volume (Million Meter) Forecast by Pressure Rating, 2020 to 2035
  • Table 45: East Asia Market Value (USD Million) Forecast by Diameter, 2020 to 2035
  • Table 46: East Asia Market Volume (Million Meter) Forecast by Diameter, 2020 to 2035
  • Table 47: East Asia Market Value (USD Million) Forecast by End Use, 2020 to 2035
  • Table 48: East Asia Market Volume (Million Meter) Forecast by End Use, 2020 to 2035
  • Table 49: South Asia & Pacific Market Value (USD Million) Forecast by Country, 2020 to 2035
  • Table 50: South Asia & Pacific Market Volume (Million Meter) Forecast by Country, 2020 to 2035
  • Table 51: South Asia & Pacific Market Value (USD Million) Forecast by Pressure Rating, 2020 to 2035
  • Table 52: South Asia & Pacific Market Volume (Million Meter) Forecast by Pressure Rating, 2020 to 2035
  • Table 53: South Asia & Pacific Market Value (USD Million) Forecast by Diameter, 2020 to 2035
  • Table 54: South Asia & Pacific Market Volume (Million Meter) Forecast by Diameter, 2020 to 2035
  • Table 55: South Asia & Pacific Market Value (USD Million) Forecast by End Use, 2020 to 2035
  • Table 56: South Asia & Pacific Market Volume (Million Meter) Forecast by End Use, 2020 to 2035
  • Table 57: Middle East and Africa Market Value (USD Million) Forecast by Country, 2020 to 2035
  • Table 58: Middle East and Africa Market Volume (Million Meter) Forecast by Country, 2020 to 2035
  • Table 59: Middle East and Africa Market Value (USD Million) Forecast by Pressure Rating, 2020 to 2035
  • Table 60: Middle East and Africa Market Volume (Million Meter) Forecast by Pressure Rating, 2020 to 2035
  • Table 61: Middle East and Africa Market Value (USD Million) Forecast by Diameter, 2020 to 2035
  • Table 62: Middle East and Africa Market Volume (Million Meter) Forecast by Diameter, 2020 to 2035
  • Table 63: Middle East and Africa Market Value (USD Million) Forecast by End Use, 2020 to 2035
  • Table 64: Middle East and Africa Market Volume (Million Meter) Forecast by End Use, 2020 to 2035

List of Figures

  • Figure 1: Global Market Volume (Million Meter) Forecast 2020 to 2035
  • Figure 2: Global Market Pricing Analysis
  • Figure 3: Global Market Value (USD Million) Forecast 2020 to 2035
  • Figure 4: Global Market Value Share and BPS Analysis by Pressure Rating, 2025 and 2035
  • Figure 5: Global Market Y-o-Y Growth Comparison by Pressure Rating, 2025 to 2035
  • Figure 6: Global Market Attractiveness Analysis by Pressure Rating
  • Figure 7: Global Market Value Share and BPS Analysis by Diameter, 2025 and 2035
  • Figure 8: Global Market Y-o-Y Growth Comparison by Diameter, 2025 to 2035
  • Figure 9: Global Market Attractiveness Analysis by Diameter
  • Figure 10: Global Market Value Share and BPS Analysis by End Use, 2025 and 2035
  • Figure 11: Global Market Y-o-Y Growth Comparison by End Use, 2025 to 2035
  • Figure 12: Global Market Attractiveness Analysis by End Use
  • Figure 13: Global Market Value (USD Million) Share and BPS Analysis by Region, 2025 and 2035
  • Figure 14: Global Market Y-o-Y Growth Comparison by Region, 2025 to 2035
  • Figure 15: Global Market Attractiveness Analysis by Region
  • Figure 16: North America Market Incremental $ Opportunity, 2025 to 2035
  • Figure 17: Latin America Market Incremental $ Opportunity, 2025 to 2035
  • Figure 18: Western Europe Market Incremental $ Opportunity, 2025 to 2035
  • Figure 19: Eastern Europe Market Incremental $ Opportunity, 2025 to 2035
  • Figure 20: East Asia Market Incremental $ Opportunity, 2025 to 2035
  • Figure 21: South Asia & Pacific Market Incremental $ Opportunity, 2025 to 2035
  • Figure 22: Middle East and Africa Market Incremental $ Opportunity, 2025 to 2035
  • Figure 23: North America Market Value Share and BPS Analysis by Country, 2025 and 2035
  • Figure 24: North America Market Value Share and BPS Analysis by Pressure Rating, 2025 and 2035
  • Figure 25: North America Market Y-o-Y Growth Comparison by Pressure Rating, 2025 to 2035
  • Figure 26: North America Market Attractiveness Analysis by Pressure Rating
  • Figure 27: North America Market Value Share and BPS Analysis by Diameter, 2025 and 2035
  • Figure 28: North America Market Y-o-Y Growth Comparison by Diameter, 2025 to 2035
  • Figure 29: North America Market Attractiveness Analysis by Diameter
  • Figure 30: North America Market Value Share and BPS Analysis by End Use, 2025 and 2035
  • Figure 31: North America Market Y-o-Y Growth Comparison by End Use, 2025 to 2035
  • Figure 32: North America Market Attractiveness Analysis by End Use
  • Figure 33: Latin America Market Value Share and BPS Analysis by Country, 2025 and 2035
  • Figure 34: Latin America Market Value Share and BPS Analysis by Pressure Rating, 2025 and 2035
  • Figure 35: Latin America Market Y-o-Y Growth Comparison by Pressure Rating, 2025 to 2035
  • Figure 36: Latin America Market Attractiveness Analysis by Pressure Rating
  • Figure 37: Latin America Market Value Share and BPS Analysis by Diameter, 2025 and 2035
  • Figure 38: Latin America Market Y-o-Y Growth Comparison by Diameter, 2025 to 2035
  • Figure 39: Latin America Market Attractiveness Analysis by Diameter
  • Figure 40: Latin America Market Value Share and BPS Analysis by End Use, 2025 and 2035
  • Figure 41: Latin America Market Y-o-Y Growth Comparison by End Use, 2025 to 2035
  • Figure 42: Latin America Market Attractiveness Analysis by End Use
  • Figure 43: Western Europe Market Value Share and BPS Analysis by Country, 2025 and 2035
  • Figure 44: Western Europe Market Value Share and BPS Analysis by Pressure Rating, 2025 and 2035
  • Figure 45: Western Europe Market Y-o-Y Growth Comparison by Pressure Rating, 2025 to 2035
  • Figure 46: Western Europe Market Attractiveness Analysis by Pressure Rating
  • Figure 47: Western Europe Market Value Share and BPS Analysis by Diameter, 2025 and 2035
  • Figure 48: Western Europe Market Y-o-Y Growth Comparison by Diameter, 2025 to 2035
  • Figure 49: Western Europe Market Attractiveness Analysis by Diameter
  • Figure 50: Western Europe Market Value Share and BPS Analysis by End Use, 2025 and 2035
  • Figure 51: Western Europe Market Y-o-Y Growth Comparison by End Use, 2025 to 2035
  • Figure 52: Western Europe Market Attractiveness Analysis by End Use
  • Figure 53: Eastern Europe Market Value Share and BPS Analysis by Country, 2025 and 2035
  • Figure 54: Eastern Europe Market Value Share and BPS Analysis by Pressure Rating, 2025 and 2035
  • Figure 55: Eastern Europe Market Y-o-Y Growth Comparison by Pressure Rating, 2025 to 2035
  • Figure 56: Eastern Europe Market Attractiveness Analysis by Pressure Rating
  • Figure 57: Eastern Europe Market Value Share and BPS Analysis by Diameter, 2025 and 2035
  • Figure 58: Eastern Europe Market Y-o-Y Growth Comparison by Diameter, 2025 to 2035
  • Figure 59: Eastern Europe Market Attractiveness Analysis by Diameter
  • Figure 60: Eastern Europe Market Value Share and BPS Analysis by End Use, 2025 and 2035
  • Figure 61: Eastern Europe Market Y-o-Y Growth Comparison by End Use, 2025 to 2035
  • Figure 62: Eastern Europe Market Attractiveness Analysis by End Use
  • Figure 63: East Asia Market Value Share and BPS Analysis by Country, 2025 and 2035
  • Figure 64: East Asia Market Value Share and BPS Analysis by Pressure Rating, 2025 and 2035
  • Figure 65: East Asia Market Y-o-Y Growth Comparison by Pressure Rating, 2025 to 2035
  • Figure 66: East Asia Market Attractiveness Analysis by Pressure Rating
  • Figure 67: East Asia Market Value Share and BPS Analysis by Diameter, 2025 and 2035
  • Figure 68: East Asia Market Y-o-Y Growth Comparison by Diameter, 2025 to 2035
  • Figure 69: East Asia Market Attractiveness Analysis by Diameter
  • Figure 70: East Asia Market Value Share and BPS Analysis by End Use, 2025 and 2035
  • Figure 71: East Asia Market Y-o-Y Growth Comparison by End Use, 2025 to 2035
  • Figure 72: East Asia Market Attractiveness Analysis by End Use
  • Figure 73: South Asia & Pacific Market Value Share and BPS Analysis by Country, 2025 and 2035
  • Figure 74: South Asia & Pacific Market Value Share and BPS Analysis by Pressure Rating, 2025 and 2035
  • Figure 75: South Asia & Pacific Market Y-o-Y Growth Comparison by Pressure Rating, 2025 to 2035
  • Figure 76: South Asia & Pacific Market Attractiveness Analysis by Pressure Rating
  • Figure 77: South Asia & Pacific Market Value Share and BPS Analysis by Diameter, 2025 and 2035
  • Figure 78: South Asia & Pacific Market Y-o-Y Growth Comparison by Diameter, 2025 to 2035
  • Figure 79: South Asia & Pacific Market Attractiveness Analysis by Diameter
  • Figure 80: South Asia & Pacific Market Value Share and BPS Analysis by End Use, 2025 and 2035
  • Figure 81: South Asia & Pacific Market Y-o-Y Growth Comparison by End Use, 2025 to 2035
  • Figure 82: South Asia & Pacific Market Attractiveness Analysis by End Use
  • Figure 83: Middle East and Africa Market Value Share and BPS Analysis by Country, 2025 and 2035
  • Figure 84: Middle East and Africa Market Value Share and BPS Analysis by Pressure Rating, 2025 and 2035
  • Figure 85: Middle East and Africa Market Y-o-Y Growth Comparison by Pressure Rating, 2025 to 2035
  • Figure 86: Middle East and Africa Market Attractiveness Analysis by Pressure Rating
  • Figure 87: Middle East and Africa Market Value Share and BPS Analysis by Diameter, 2025 and 2035
  • Figure 88: Middle East and Africa Market Y-o-Y Growth Comparison by Diameter, 2025 to 2035
  • Figure 89: Middle East and Africa Market Attractiveness Analysis by Diameter
  • Figure 90: Middle East and Africa Market Value Share and BPS Analysis by End Use, 2025 and 2035
  • Figure 91: Middle East and Africa Market Y-o-Y Growth Comparison by End Use, 2025 to 2035
  • Figure 92: Middle East and Africa Market Attractiveness Analysis by End Use
  • Figure 93: Global Market - Tier Structure Analysis
  • Figure 94: Global Market - Company Share Analysis

Frequently Asked Questions

What is the projected size of the carbon free hose industry by 2035?

The industry is expected to reach USD 475.8 million by 2035.

What is the estimated size of the carbon free hose industry in 2025?

The industry is projected to be USD 263.2 million in 2025.

What is the CAGR of the carbon free hose industry from 2025 to 2035?

The industry is expected to grow at a CAGR of 6.1%.

Which segment is expected to lead the carbon free hose industry in 2025?

The "Up to 25 mm" segment is expected to lead with a 22% industry share.

Which region is expected to experience the highest growth in the carbon free hose industry?

Asia Pacific, particularly China, is expected to grow at a 6.9% CAGR.

Explore Similar Insights

Future Market Insights

Carbon Free Hose Market