Pouch Tapes Market Outlook (2023 to 2033)

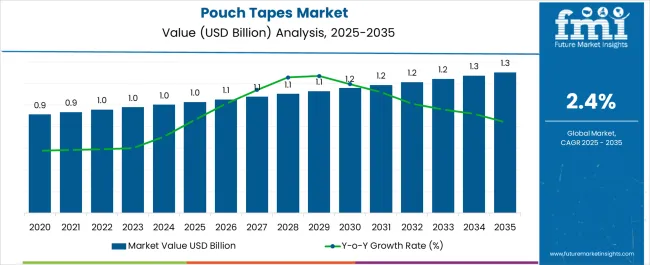
The pouch tapes market is anticipated to value at USD 979.25 million in 2023. The pouch tapes market share is likely to reach USD 1241.35 million by 2033 with a CAGR of 2.4% during the forecast period from 2023 to 2033.

Attributes Details
Pouch Tapes Market Value (2023) USD 979.25 million
Pouch Tapes Market Anticipated Forecast Value (2033) USD 1241.35 million
Pouch Tapes Market Projected Growth Rate (2023 to 2033) 2.4%

The pouch tapes market share is expected to expand with a better CAGR over the forecast period as compared to its historic data, due to rising the demand for pouch tapes by several new end-user verticals in recent years. Pouch tapes are types of pressure-sensitive tapes used for attaching documents, invoices, literature and samples to packages that are supposed to raise the demand for pouch tapes during the forecast period.

Pouch tape sales have been high for tacking property and are used for documents in shipping and logistics and others without damaging any packed things inside it. The demand for pouch tapes is rising as they help in wrapping properties that are essential for moisture resistance, abrasion resistance, etc. Pouch tapes market share is likely to expand as they have high tacking property, preventing rubbing off and reducing the chance of lost or delayed packages and bar codes from becoming scuffed and non-legible during the forecast period.

Moreover, pouch tapes provide a see-through window for easy document identification making it highly desirable for marketing purpose. Therefore, the global pouch tapes market share growth is expected to be positive over the forecast period.

What are some of the Factors Spearheading the Pouch Tapes Market?

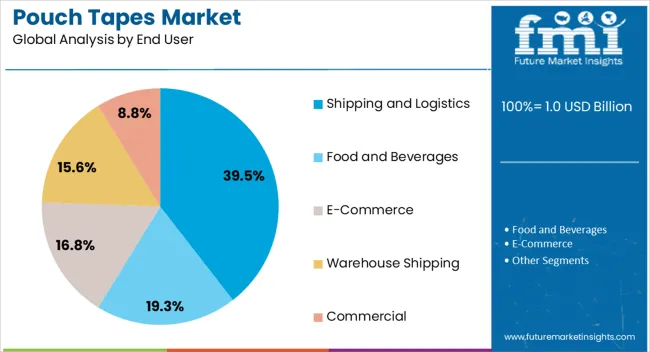
Shipping and logistics sectors are expected to grow under the backdrop of e-commerce growth, increasing the sales of pouch tapes as per the market demand analysis. Pouch tapes have tacky borders, resulting in strong adhesion for attaching and protecting packing lists, information & work instructions and others that have raised the sales of pouch tapes in the postal communication department.

The key features leading to the demand for pouch tapes are high resistance to moisture and abrasion, which can be used in adverse climatic conditions. And the growing necessity of keeping the official documents safe is likely to grow the sales of pouch tapes in the coming years.

The demand for pouch tapes is rising as they are reducing waste disposal, thus resulting in reduced carbon emissions. It also improves the overall look of the package that has also contributed remarkably for the boosting of pouch tapes market share in last couple of years.

Pouch tapes offer less material usage which reduces the transportation and storage cost leading to greater demand for pouch tapes in recent years. Also pouch tapes are easy to use, low price, and exhibit good performance in various applications that is likely to increase the sales of pouch tapes in small scale industrial sectors.

Demand for pouch tapes is rising as they are light in weight, as it does not increase the overall weight of the products to be shipped. Pouch Tapes provide a quick, simple, and secure method of attaching documents, fueling the pouch tapes market share growth.

Despite the favorable opportunities, there has been a decline in the sales of pouch tapes in the recent past due to the stringent government regulations towards the use of plastics. Moreover, substitute products such as document pouches can hamper the pouch tapes market share growth to a certain degree.
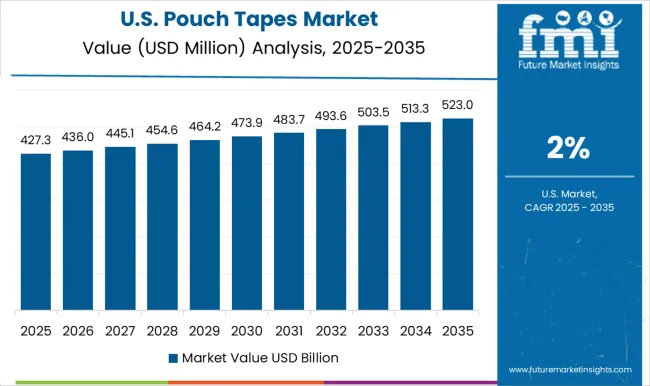
Regional Analysis of the Pouch Tapes Market

How is the Performance of the North America Pouch Tapes Market?

North America is expected to dominate the pouch tapes market during the forecast period.

The North American region acquires about 32% of the share. Due to an increase in shipping and logistics activity in the region, the demand for pouch tapes in the countries of the United States and Canada is poised to remain intact throughout the forecast years.
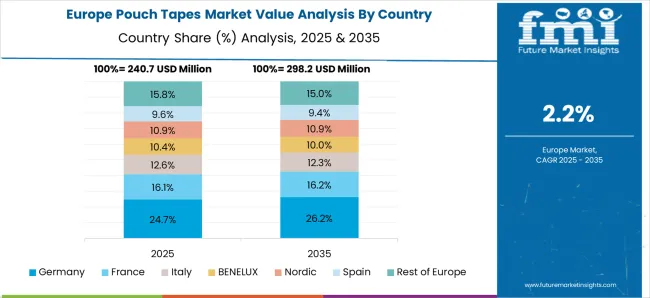
How will the Europe Pouch Tapes Market Grow?

Europe region is anticipated to follow North America in terms of growth rate and placed second in the sales of pouch tapes. It acquires 26% of the total pouch tapes market share all around the globe.

The increase in the e-commerce sector in European countries resulting in the consumer preference towards online purchasing, is likely to boost the sales of pouch tapes in Europe as per market survey.

How is the Start-up Ecosystem in the Pouch Tapes Market?

New trends, innovative technology, and product phase are the tactics adopted by start-ups emerging in the pouch tapes market share at another height in recent years.

The pouch tapes start-up market is innovating on chemical resistance and adhesion pouch tapes which are not harmful and are performing better to re-use at your standards. These pouch tapes prevent the packed accessories with their electroplating solutions and are expected to drive the market in the coming forecast period.

Recently available printed pouch tapes are improved by 40% with Scotch adjustable tape dispenser M797 and scotch pouch tape dispenser M727 which can boost the demand for pouch tapes during the forecast period.
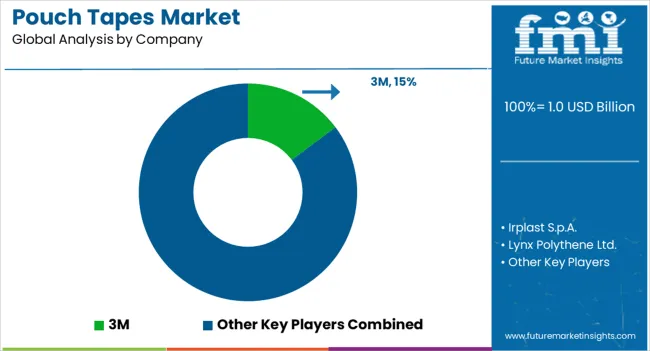
Who are the Key Competitors in the Pouch Tapes Market?

Some of the key players in the pouch tapes market are 3M, Irplast S.p.A., Lynx Polythene Ltd., and Flexopack Ltd., among others.

The industry players are focused on generating large revenue by adopting various methods, business model analysis, and key strategies that can be predicted to raise the pouch tapes market future trends as per market reports in the coming period.

IRPLAST, the pouch tapes company that innovates cost-saving solutions, has introduced print-on tape, UV-resistant, in its recently launched products with solvent-free and reverse printing techniques.

Report Scope

Report Attribute Details
Growth Rate CAGR of 2.4% from 2023 to 2033
Base Year for Estimation 2023
Historical Data 2018 to 2022
Forecast Period 2023 to 2033
Quantitative Units Revenue in USD million and CAGR from 2023 to 2033
Report Coverage Revenue Forecast, Volume Forecast, Company Ranking, Competitive Landscape, Growth Factors, Trends and Pricing Analysis
Segments Covered Material Type, Width, End User, Region
Regions Covered North America; Latin America; Europe; East Asia; South Asia; Oceania; Middle East and Africa
Key Countries Profiled USA, Canada, Brazil, Argentina, Germany, UK, France, Spain, Italy, Nordics, BENELUX, Australia & New Zealand, China, India, ASEAN, GCC, South Africa
Key Companies Profiled 3M; Irplast S.p.A.; Lynx Polythene Ltd.; Flexopack Ltd
Customization Available Upon Request

Key Segments

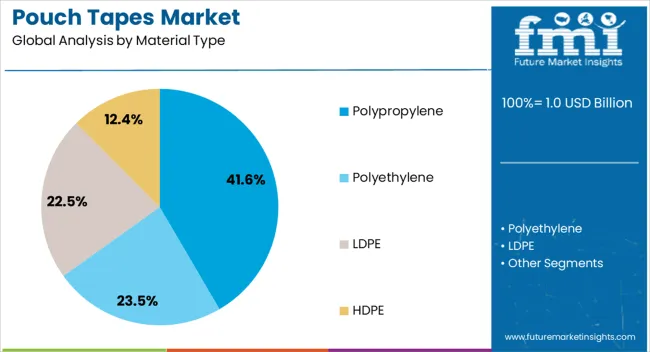
By Material Type:

  • Polypropylene
  • Polyethylene
  • LDPE
  • HDPE

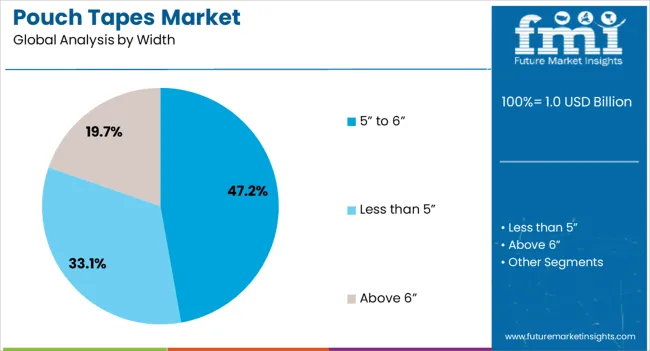
By Width:

  • Less than 5”
  • 5” to 6”
  • Above 6”

By End User:

  • Shipping and Logistics
  • Food and Beverages
  • E-Commerce
  • Warehouse Shipping
  • Commercial

By Region:

  • North America
  • Latin America
  • Asia Pacific
  • MEA
  • Europe

Table of Content

  • 1. Executive Summary
  • 2. Market Overview
  • 3. Market Background
  • 4. Global Market Analysis 2018 to 2022 and Forecast, 2023 to 2033
  • 5. Global Market Analysis 2018 to 2022 and Forecast 2023 to 2033, By Material Type
    • 5.1. Polypropylene
    • 5.2. Polyethylene
    • 5.3. LDPE
    • 5.4. HDPE
  • 6. Global Market Analysis 2018 to 2022 and Forecast 2023 to 2033, By Width
    • 6.1. Less than 5”
    • 6.2. 5” to 6”
    • 6.3. Above 6”
  • 7. Global Market Analysis 2018 to 2022 and Forecast 2023 to 2033, By End User
    • 7.1. Shipping and Logistics
    • 7.2. Food and Beverages
    • 7.3. E-Commerce
    • 7.4. Warehouse Shipping
    • 7.5. Commercial
  • 8. Global Market Analysis 2018 to 2022 and Forecast 2023 to 2033, By Region
    • 8.1. North America
    • 8.2. Latin America
    • 8.3. Western Europe
    • 8.4. Eastern Europe
    • 8.5. South Asia and Pacific
    • 8.6. East Asia
    • 8.7. Middle East and Africa
  • 9. North America Market Analysis 2018 to 2022 and Forecast 2023 to 2033, By Country
  • 10. Latin America Market Analysis 2018 to 2022 and Forecast 2023 to 2033, By Country
  • 11. Western Europe Market Analysis 2018 to 2022 and Forecast 2023 to 2033, By Country
  • 12. Eastern Europe Market Analysis 2018 to 2022 and Forecast 2023 to 2033, By Country
  • 13. South Asia and Pacific Market Analysis 2018 to 2022 and Forecast 2023 to 2033, By Country
  • 14. East Asia Market Analysis 2018 to 2022 and Forecast 2023 to 2033, By Country
  • 15. Middle East and Africa Market Analysis 2018 to 2022 and Forecast 2023 to 2033, By Country
  • 16. Key Countries Market Analysis
  • 17. Market Structure Analysis
  • 18. Competition Analysis
    • 18.1. 3M
    • 18.2. Irplast S.p.A.
    • 18.3. Lynx Polythene Ltd.
    • 18.4. Flexopack Ltd
    • 18.5. Test Valley Packaging
    • 18.6. BGR Packaging
    • 18.7. Thomco Specialty Products
    • 18.8. ULINE
    • 18.9. Raja SA
    • 18.10. Kilby Packaging
  • 19. Assumptions & Acronyms Used
  • 20. Research Methodology

List of Tables

Table 1: Global Market Value (US$ Million) Forecast by Region, 2018 to 2033

Table 2: Global Market Volume (Units) Forecast by Region, 2018 to 2033

Table 3: Global Market Value (US$ Million) Forecast by Material Type, 2018 to 2033

Table 4: Global Market Volume (Units) Forecast by Material Type, 2018 to 2033

Table 5: Global Market Value (US$ Million) Forecast by Width, 2018 to 2033

Table 6: Global Market Volume (Units) Forecast by Width, 2018 to 2033

Table 7: Global Market Value (US$ Million) Forecast by End User, 2018 to 2033

Table 8: Global Market Volume (Units) Forecast by End User, 2018 to 2033

Table 9: North America Market Value (US$ Million) Forecast by Country, 2018 to 2033

Table 10: North America Market Volume (Units) Forecast by Country, 2018 to 2033

Table 11: North America Market Value (US$ Million) Forecast by Material Type, 2018 to 2033

Table 12: North America Market Volume (Units) Forecast by Material Type, 2018 to 2033

Table 13: North America Market Value (US$ Million) Forecast by Width, 2018 to 2033

Table 14: North America Market Volume (Units) Forecast by Width, 2018 to 2033

Table 15: North America Market Value (US$ Million) Forecast by End User, 2018 to 2033

Table 16: North America Market Volume (Units) Forecast by End User, 2018 to 2033

Table 17: Latin America Market Value (US$ Million) Forecast by Country, 2018 to 2033

Table 18: Latin America Market Volume (Units) Forecast by Country, 2018 to 2033

Table 19: Latin America Market Value (US$ Million) Forecast by Material Type, 2018 to 2033

Table 20: Latin America Market Volume (Units) Forecast by Material Type, 2018 to 2033

Table 21: Latin America Market Value (US$ Million) Forecast by Width, 2018 to 2033

Table 22: Latin America Market Volume (Units) Forecast by Width, 2018 to 2033

Table 23: Latin America Market Value (US$ Million) Forecast by End User, 2018 to 2033

Table 24: Latin America Market Volume (Units) Forecast by End User, 2018 to 2033

Table 25: Western Europe Market Value (US$ Million) Forecast by Country, 2018 to 2033

Table 26: Western Europe Market Volume (Units) Forecast by Country, 2018 to 2033

Table 27: Western Europe Market Value (US$ Million) Forecast by Material Type, 2018 to 2033

Table 28: Western Europe Market Volume (Units) Forecast by Material Type, 2018 to 2033

Table 29: Western Europe Market Value (US$ Million) Forecast by Width, 2018 to 2033

Table 30: Western Europe Market Volume (Units) Forecast by Width, 2018 to 2033

Table 31: Western Europe Market Value (US$ Million) Forecast by End User, 2018 to 2033

Table 32: Western Europe Market Volume (Units) Forecast by End User, 2018 to 2033

Table 33: Eastern Europe Market Value (US$ Million) Forecast by Country, 2018 to 2033

Table 34: Eastern Europe Market Volume (Units) Forecast by Country, 2018 to 2033

Table 35: Eastern Europe Market Value (US$ Million) Forecast by Material Type, 2018 to 2033

Table 36: Eastern Europe Market Volume (Units) Forecast by Material Type, 2018 to 2033

Table 37: Eastern Europe Market Value (US$ Million) Forecast by Width, 2018 to 2033

Table 38: Eastern Europe Market Volume (Units) Forecast by Width, 2018 to 2033

Table 39: Eastern Europe Market Value (US$ Million) Forecast by End User, 2018 to 2033

Table 40: Eastern Europe Market Volume (Units) Forecast by End User, 2018 to 2033

Table 41: South Asia and Pacific Market Value (US$ Million) Forecast by Country, 2018 to 2033

Table 42: South Asia and Pacific Market Volume (Units) Forecast by Country, 2018 to 2033

Table 43: South Asia and Pacific Market Value (US$ Million) Forecast by Material Type, 2018 to 2033

Table 44: South Asia and Pacific Market Volume (Units) Forecast by Material Type, 2018 to 2033

Table 45: South Asia and Pacific Market Value (US$ Million) Forecast by Width, 2018 to 2033

Table 46: South Asia and Pacific Market Volume (Units) Forecast by Width, 2018 to 2033

Table 47: South Asia and Pacific Market Value (US$ Million) Forecast by End User, 2018 to 2033

Table 48: South Asia and Pacific Market Volume (Units) Forecast by End User, 2018 to 2033

Table 49: East Asia Market Value (US$ Million) Forecast by Country, 2018 to 2033

Table 50: East Asia Market Volume (Units) Forecast by Country, 2018 to 2033

Table 51: East Asia Market Value (US$ Million) Forecast by Material Type, 2018 to 2033

Table 52: East Asia Market Volume (Units) Forecast by Material Type, 2018 to 2033

Table 53: East Asia Market Value (US$ Million) Forecast by Width, 2018 to 2033

Table 54: East Asia Market Volume (Units) Forecast by Width, 2018 to 2033

Table 55: East Asia Market Value (US$ Million) Forecast by End User, 2018 to 2033

Table 56: East Asia Market Volume (Units) Forecast by End User, 2018 to 2033

Table 57: Middle East and Africa Market Value (US$ Million) Forecast by Country, 2018 to 2033

Table 58: Middle East and Africa Market Volume (Units) Forecast by Country, 2018 to 2033

Table 59: Middle East and Africa Market Value (US$ Million) Forecast by Material Type, 2018 to 2033

Table 60: Middle East and Africa Market Volume (Units) Forecast by Material Type, 2018 to 2033

Table 61: Middle East and Africa Market Value (US$ Million) Forecast by Width, 2018 to 2033

Table 62: Middle East and Africa Market Volume (Units) Forecast by Width, 2018 to 2033

Table 63: Middle East and Africa Market Value (US$ Million) Forecast by End User, 2018 to 2033

Table 64: Middle East and Africa Market Volume (Units) Forecast by End User, 2018 to 2033

List of Figures

Figure 1: Global Market Value (US$ Million) by Material Type, 2023 to 2033

Figure 2: Global Market Value (US$ Million) by Width, 2023 to 2033

Figure 3: Global Market Value (US$ Million) by End User, 2023 to 2033

Figure 4: Global Market Value (US$ Million) by Region, 2023 to 2033

Figure 5: Global Market Value (US$ Million) Analysis by Region, 2018 to 2033

Figure 6: Global Market Volume (Units) Analysis by Region, 2018 to 2033

Figure 7: Global Market Value Share (%) and BPS Analysis by Region, 2023 to 2033

Figure 8: Global Market Y-o-Y Growth (%) Projections by Region, 2023 to 2033

Figure 9: Global Market Value (US$ Million) Analysis by Material Type, 2018 to 2033

Figure 10: Global Market Volume (Units) Analysis by Material Type, 2018 to 2033

Figure 11: Global Market Value Share (%) and BPS Analysis by Material Type, 2023 to 2033

Figure 12: Global Market Y-o-Y Growth (%) Projections by Material Type, 2023 to 2033

Figure 13: Global Market Value (US$ Million) Analysis by Width, 2018 to 2033

Figure 14: Global Market Volume (Units) Analysis by Width, 2018 to 2033

Figure 15: Global Market Value Share (%) and BPS Analysis by Width, 2023 to 2033

Figure 16: Global Market Y-o-Y Growth (%) Projections by Width, 2023 to 2033

Figure 17: Global Market Value (US$ Million) Analysis by End User, 2018 to 2033

Figure 18: Global Market Volume (Units) Analysis by End User, 2018 to 2033

Figure 19: Global Market Value Share (%) and BPS Analysis by End User, 2023 to 2033

Figure 20: Global Market Y-o-Y Growth (%) Projections by End User, 2023 to 2033

Figure 21: Global Market Attractiveness by Material Type, 2023 to 2033

Figure 22: Global Market Attractiveness by Width, 2023 to 2033

Figure 23: Global Market Attractiveness by End User, 2023 to 2033

Figure 24: Global Market Attractiveness by Region, 2023 to 2033

Figure 25: North America Market Value (US$ Million) by Material Type, 2023 to 2033

Figure 26: North America Market Value (US$ Million) by Width, 2023 to 2033

Figure 27: North America Market Value (US$ Million) by End User, 2023 to 2033

Figure 28: North America Market Value (US$ Million) by Country, 2023 to 2033

Figure 29: North America Market Value (US$ Million) Analysis by Country, 2018 to 2033

Figure 30: North America Market Volume (Units) Analysis by Country, 2018 to 2033

Figure 31: North America Market Value Share (%) and BPS Analysis by Country, 2023 to 2033

Figure 32: North America Market Y-o-Y Growth (%) Projections by Country, 2023 to 2033

Figure 33: North America Market Value (US$ Million) Analysis by Material Type, 2018 to 2033

Figure 34: North America Market Volume (Units) Analysis by Material Type, 2018 to 2033

Figure 35: North America Market Value Share (%) and BPS Analysis by Material Type, 2023 to 2033

Figure 36: North America Market Y-o-Y Growth (%) Projections by Material Type, 2023 to 2033

Figure 37: North America Market Value (US$ Million) Analysis by Width, 2018 to 2033

Figure 38: North America Market Volume (Units) Analysis by Width, 2018 to 2033

Figure 39: North America Market Value Share (%) and BPS Analysis by Width, 2023 to 2033

Figure 40: North America Market Y-o-Y Growth (%) Projections by Width, 2023 to 2033

Figure 41: North America Market Value (US$ Million) Analysis by End User, 2018 to 2033

Figure 42: North America Market Volume (Units) Analysis by End User, 2018 to 2033

Figure 43: North America Market Value Share (%) and BPS Analysis by End User, 2023 to 2033

Figure 44: North America Market Y-o-Y Growth (%) Projections by End User, 2023 to 2033

Figure 45: North America Market Attractiveness by Material Type, 2023 to 2033

Figure 46: North America Market Attractiveness by Width, 2023 to 2033

Figure 47: North America Market Attractiveness by End User, 2023 to 2033

Figure 48: North America Market Attractiveness by Country, 2023 to 2033

Figure 49: Latin America Market Value (US$ Million) by Material Type, 2023 to 2033

Figure 50: Latin America Market Value (US$ Million) by Width, 2023 to 2033

Figure 51: Latin America Market Value (US$ Million) by End User, 2023 to 2033

Figure 52: Latin America Market Value (US$ Million) by Country, 2023 to 2033

Figure 53: Latin America Market Value (US$ Million) Analysis by Country, 2018 to 2033

Figure 54: Latin America Market Volume (Units) Analysis by Country, 2018 to 2033

Figure 55: Latin America Market Value Share (%) and BPS Analysis by Country, 2023 to 2033

Figure 56: Latin America Market Y-o-Y Growth (%) Projections by Country, 2023 to 2033

Figure 57: Latin America Market Value (US$ Million) Analysis by Material Type, 2018 to 2033

Figure 58: Latin America Market Volume (Units) Analysis by Material Type, 2018 to 2033

Figure 59: Latin America Market Value Share (%) and BPS Analysis by Material Type, 2023 to 2033

Figure 60: Latin America Market Y-o-Y Growth (%) Projections by Material Type, 2023 to 2033

Figure 61: Latin America Market Value (US$ Million) Analysis by Width, 2018 to 2033

Figure 62: Latin America Market Volume (Units) Analysis by Width, 2018 to 2033

Figure 63: Latin America Market Value Share (%) and BPS Analysis by Width, 2023 to 2033

Figure 64: Latin America Market Y-o-Y Growth (%) Projections by Width, 2023 to 2033

Figure 65: Latin America Market Value (US$ Million) Analysis by End User, 2018 to 2033

Figure 66: Latin America Market Volume (Units) Analysis by End User, 2018 to 2033

Figure 67: Latin America Market Value Share (%) and BPS Analysis by End User, 2023 to 2033

Figure 68: Latin America Market Y-o-Y Growth (%) Projections by End User, 2023 to 2033

Figure 69: Latin America Market Attractiveness by Material Type, 2023 to 2033

Figure 70: Latin America Market Attractiveness by Width, 2023 to 2033

Figure 71: Latin America Market Attractiveness by End User, 2023 to 2033

Figure 72: Latin America Market Attractiveness by Country, 2023 to 2033

Figure 73: Western Europe Market Value (US$ Million) by Material Type, 2023 to 2033

Figure 74: Western Europe Market Value (US$ Million) by Width, 2023 to 2033

Figure 75: Western Europe Market Value (US$ Million) by End User, 2023 to 2033

Figure 76: Western Europe Market Value (US$ Million) by Country, 2023 to 2033

Figure 77: Western Europe Market Value (US$ Million) Analysis by Country, 2018 to 2033

Figure 78: Western Europe Market Volume (Units) Analysis by Country, 2018 to 2033

Figure 79: Western Europe Market Value Share (%) and BPS Analysis by Country, 2023 to 2033

Figure 80: Western Europe Market Y-o-Y Growth (%) Projections by Country, 2023 to 2033

Figure 81: Western Europe Market Value (US$ Million) Analysis by Material Type, 2018 to 2033

Figure 82: Western Europe Market Volume (Units) Analysis by Material Type, 2018 to 2033

Figure 83: Western Europe Market Value Share (%) and BPS Analysis by Material Type, 2023 to 2033

Figure 84: Western Europe Market Y-o-Y Growth (%) Projections by Material Type, 2023 to 2033

Figure 85: Western Europe Market Value (US$ Million) Analysis by Width, 2018 to 2033

Figure 86: Western Europe Market Volume (Units) Analysis by Width, 2018 to 2033

Figure 87: Western Europe Market Value Share (%) and BPS Analysis by Width, 2023 to 2033

Figure 88: Western Europe Market Y-o-Y Growth (%) Projections by Width, 2023 to 2033

Figure 89: Western Europe Market Value (US$ Million) Analysis by End User, 2018 to 2033

Figure 90: Western Europe Market Volume (Units) Analysis by End User, 2018 to 2033

Figure 91: Western Europe Market Value Share (%) and BPS Analysis by End User, 2023 to 2033

Figure 92: Western Europe Market Y-o-Y Growth (%) Projections by End User, 2023 to 2033

Figure 93: Western Europe Market Attractiveness by Material Type, 2023 to 2033

Figure 94: Western Europe Market Attractiveness by Width, 2023 to 2033

Figure 95: Western Europe Market Attractiveness by End User, 2023 to 2033

Figure 96: Western Europe Market Attractiveness by Country, 2023 to 2033

Figure 97: Eastern Europe Market Value (US$ Million) by Material Type, 2023 to 2033

Figure 98: Eastern Europe Market Value (US$ Million) by Width, 2023 to 2033

Figure 99: Eastern Europe Market Value (US$ Million) by End User, 2023 to 2033

Figure 100: Eastern Europe Market Value (US$ Million) by Country, 2023 to 2033

Figure 101: Eastern Europe Market Value (US$ Million) Analysis by Country, 2018 to 2033

Figure 102: Eastern Europe Market Volume (Units) Analysis by Country, 2018 to 2033

Figure 103: Eastern Europe Market Value Share (%) and BPS Analysis by Country, 2023 to 2033

Figure 104: Eastern Europe Market Y-o-Y Growth (%) Projections by Country, 2023 to 2033

Figure 105: Eastern Europe Market Value (US$ Million) Analysis by Material Type, 2018 to 2033

Figure 106: Eastern Europe Market Volume (Units) Analysis by Material Type, 2018 to 2033

Figure 107: Eastern Europe Market Value Share (%) and BPS Analysis by Material Type, 2023 to 2033

Figure 108: Eastern Europe Market Y-o-Y Growth (%) Projections by Material Type, 2023 to 2033

Figure 109: Eastern Europe Market Value (US$ Million) Analysis by Width, 2018 to 2033

Figure 110: Eastern Europe Market Volume (Units) Analysis by Width, 2018 to 2033

Figure 111: Eastern Europe Market Value Share (%) and BPS Analysis by Width, 2023 to 2033

Figure 112: Eastern Europe Market Y-o-Y Growth (%) Projections by Width, 2023 to 2033

Figure 113: Eastern Europe Market Value (US$ Million) Analysis by End User, 2018 to 2033

Figure 114: Eastern Europe Market Volume (Units) Analysis by End User, 2018 to 2033

Figure 115: Eastern Europe Market Value Share (%) and BPS Analysis by End User, 2023 to 2033

Figure 116: Eastern Europe Market Y-o-Y Growth (%) Projections by End User, 2023 to 2033

Figure 117: Eastern Europe Market Attractiveness by Material Type, 2023 to 2033

Figure 118: Eastern Europe Market Attractiveness by Width, 2023 to 2033

Figure 119: Eastern Europe Market Attractiveness by End User, 2023 to 2033

Figure 120: Eastern Europe Market Attractiveness by Country, 2023 to 2033

Figure 121: South Asia and Pacific Market Value (US$ Million) by Material Type, 2023 to 2033

Figure 122: South Asia and Pacific Market Value (US$ Million) by Width, 2023 to 2033

Figure 123: South Asia and Pacific Market Value (US$ Million) by End User, 2023 to 2033

Figure 124: South Asia and Pacific Market Value (US$ Million) by Country, 2023 to 2033

Figure 125: South Asia and Pacific Market Value (US$ Million) Analysis by Country, 2018 to 2033

Figure 126: South Asia and Pacific Market Volume (Units) Analysis by Country, 2018 to 2033

Figure 127: South Asia and Pacific Market Value Share (%) and BPS Analysis by Country, 2023 to 2033

Figure 128: South Asia and Pacific Market Y-o-Y Growth (%) Projections by Country, 2023 to 2033

Figure 129: South Asia and Pacific Market Value (US$ Million) Analysis by Material Type, 2018 to 2033

Figure 130: South Asia and Pacific Market Volume (Units) Analysis by Material Type, 2018 to 2033

Figure 131: South Asia and Pacific Market Value Share (%) and BPS Analysis by Material Type, 2023 to 2033

Figure 132: South Asia and Pacific Market Y-o-Y Growth (%) Projections by Material Type, 2023 to 2033

Figure 133: South Asia and Pacific Market Value (US$ Million) Analysis by Width, 2018 to 2033

Figure 134: South Asia and Pacific Market Volume (Units) Analysis by Width, 2018 to 2033

Figure 135: South Asia and Pacific Market Value Share (%) and BPS Analysis by Width, 2023 to 2033

Figure 136: South Asia and Pacific Market Y-o-Y Growth (%) Projections by Width, 2023 to 2033

Figure 137: South Asia and Pacific Market Value (US$ Million) Analysis by End User, 2018 to 2033

Figure 138: South Asia and Pacific Market Volume (Units) Analysis by End User, 2018 to 2033

Figure 139: South Asia and Pacific Market Value Share (%) and BPS Analysis by End User, 2023 to 2033

Figure 140: South Asia and Pacific Market Y-o-Y Growth (%) Projections by End User, 2023 to 2033

Figure 141: South Asia and Pacific Market Attractiveness by Material Type, 2023 to 2033

Figure 142: South Asia and Pacific Market Attractiveness by Width, 2023 to 2033

Figure 143: South Asia and Pacific Market Attractiveness by End User, 2023 to 2033

Figure 144: South Asia and Pacific Market Attractiveness by Country, 2023 to 2033

Figure 145: East Asia Market Value (US$ Million) by Material Type, 2023 to 2033

Figure 146: East Asia Market Value (US$ Million) by Width, 2023 to 2033

Figure 147: East Asia Market Value (US$ Million) by End User, 2023 to 2033

Figure 148: East Asia Market Value (US$ Million) by Country, 2023 to 2033

Figure 149: East Asia Market Value (US$ Million) Analysis by Country, 2018 to 2033

Figure 150: East Asia Market Volume (Units) Analysis by Country, 2018 to 2033

Figure 151: East Asia Market Value Share (%) and BPS Analysis by Country, 2023 to 2033

Figure 152: East Asia Market Y-o-Y Growth (%) Projections by Country, 2023 to 2033

Figure 153: East Asia Market Value (US$ Million) Analysis by Material Type, 2018 to 2033

Figure 154: East Asia Market Volume (Units) Analysis by Material Type, 2018 to 2033

Figure 155: East Asia Market Value Share (%) and BPS Analysis by Material Type, 2023 to 2033

Figure 156: East Asia Market Y-o-Y Growth (%) Projections by Material Type, 2023 to 2033

Figure 157: East Asia Market Value (US$ Million) Analysis by Width, 2018 to 2033

Figure 158: East Asia Market Volume (Units) Analysis by Width, 2018 to 2033

Figure 159: East Asia Market Value Share (%) and BPS Analysis by Width, 2023 to 2033

Figure 160: East Asia Market Y-o-Y Growth (%) Projections by Width, 2023 to 2033

Figure 161: East Asia Market Value (US$ Million) Analysis by End User, 2018 to 2033

Figure 162: East Asia Market Volume (Units) Analysis by End User, 2018 to 2033

Figure 163: East Asia Market Value Share (%) and BPS Analysis by End User, 2023 to 2033

Figure 164: East Asia Market Y-o-Y Growth (%) Projections by End User, 2023 to 2033

Figure 165: East Asia Market Attractiveness by Material Type, 2023 to 2033

Figure 166: East Asia Market Attractiveness by Width, 2023 to 2033

Figure 167: East Asia Market Attractiveness by End User, 2023 to 2033

Figure 168: East Asia Market Attractiveness by Country, 2023 to 2033

Figure 169: Middle East and Africa Market Value (US$ Million) by Material Type, 2023 to 2033

Figure 170: Middle East and Africa Market Value (US$ Million) by Width, 2023 to 2033

Figure 171: Middle East and Africa Market Value (US$ Million) by End User, 2023 to 2033

Figure 172: Middle East and Africa Market Value (US$ Million) by Country, 2023 to 2033

Figure 173: Middle East and Africa Market Value (US$ Million) Analysis by Country, 2018 to 2033

Figure 174: Middle East and Africa Market Volume (Units) Analysis by Country, 2018 to 2033

Figure 175: Middle East and Africa Market Value Share (%) and BPS Analysis by Country, 2023 to 2033

Figure 176: Middle East and Africa Market Y-o-Y Growth (%) Projections by Country, 2023 to 2033

Figure 177: Middle East and Africa Market Value (US$ Million) Analysis by Material Type, 2018 to 2033

Figure 178: Middle East and Africa Market Volume (Units) Analysis by Material Type, 2018 to 2033

Figure 179: Middle East and Africa Market Value Share (%) and BPS Analysis by Material Type, 2023 to 2033

Figure 180: Middle East and Africa Market Y-o-Y Growth (%) Projections by Material Type, 2023 to 2033

Figure 181: Middle East and Africa Market Value (US$ Million) Analysis by Width, 2018 to 2033

Figure 182: Middle East and Africa Market Volume (Units) Analysis by Width, 2018 to 2033

Figure 183: Middle East and Africa Market Value Share (%) and BPS Analysis by Width, 2023 to 2033

Figure 184: Middle East and Africa Market Y-o-Y Growth (%) Projections by Width, 2023 to 2033

Figure 185: Middle East and Africa Market Value (US$ Million) Analysis by End User, 2018 to 2033

Figure 186: Middle East and Africa Market Volume (Units) Analysis by End User, 2018 to 2033

Figure 187: Middle East and Africa Market Value Share (%) and BPS Analysis by End User, 2023 to 2033

Figure 188: Middle East and Africa Market Y-o-Y Growth (%) Projections by End User, 2023 to 2033

Figure 189: Middle East and Africa Market Attractiveness by Material Type, 2023 to 2033

Figure 190: Middle East and Africa Market Attractiveness by Width, 2023 to 2033

Figure 191: Middle East and Africa Market Attractiveness by End User, 2023 to 2033

Figure 192: Middle East and Africa Market Attractiveness by Country, 2023 to 2033

Frequently Asked Questions

What is the Pouch Tapes Market value in 2023? 

The market is valued at USD 979.2 million in 2023. 

What is the Growth Forecast for the Pouch Tapes Market? 

The market is forecast to register a CAGR of 2.4% through 2033.

Who are the Key Market Players? 

3M, Irplast S.p.A., and Lynx Polythene Ltd. are the key market players. 

What Opportunities Await the Market Players? 

Rising demand from various industries to boost the market prospects.

What is the Expected Market Share in North America? 

North America is likely to generate a share of 32% in 2023. 

Explore Similar Insights

Future Market Insights

Pouch Tapes Market