Pouch Filler Market Size and Share Forecast Outlook 2025 to 2035

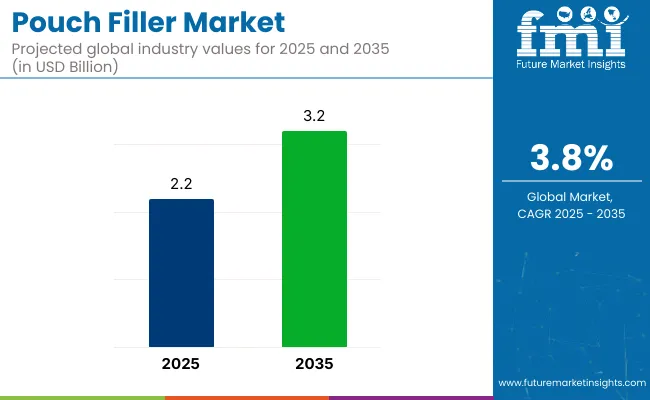
The global pouch filler market is expected to reach USD 3.2 billion by 2035, growing from USD 2.2 billion in 2025, with a CAGR of 3.8%.
Quick Stats for Pouch Filler Market

  • Market Value (2025): USD 2.2 billion
  • Forecast Value (2035): USD 3.2 billion
  • Forecast CAGR (2025 to 2035): 3.8%
  • Leading Segment in 2035: Volumetric (62% share)
  • Key Growth Region: Asia Pacific (India)
  • Key Players: Volpak, Bossar Packaging, Mespack, Fres-Co System USA, Viking Masek, Nichrome India, All-Fill Inc., Paxiom Group, and KHS GmbH.

Pouch Filler Market

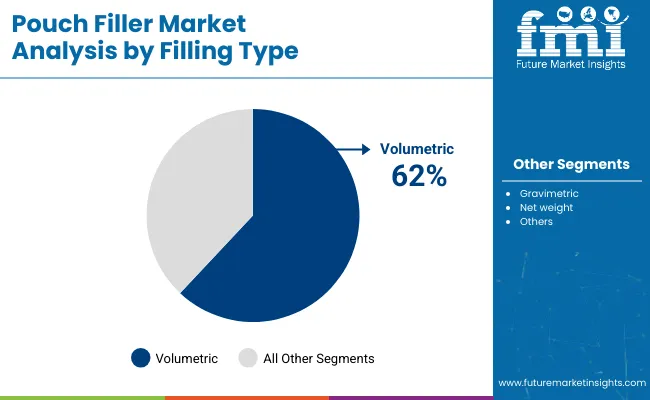
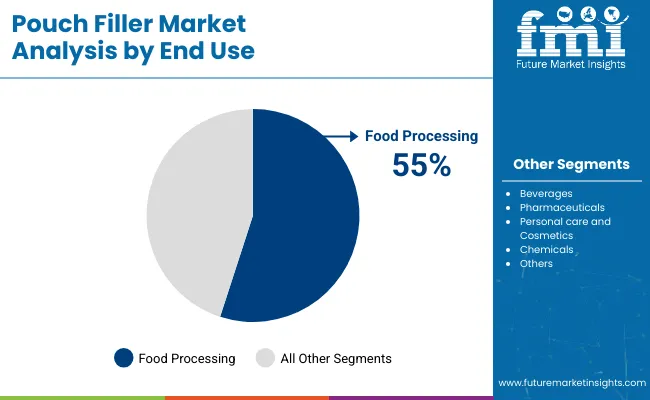
This growth is primarily driven by the increasing adoption of Volumetric filling technology, which is projected to account for 62% of the market share in 2025. Volumetric filling technology is favored for its cost efficiency, ease of maintenance, and versatility in handling various pouch sizes and fill volumes. The food processing sector will continue to dominate, capturing nearly 55% of the market share in 2025, fueled by rising demand for packaged ready-to-eat meals, dairy products, and snack foods.

The pouch filler market holds a specific share within various packaging segments. In the flexible packaging market, it represents about 3-5% due to its role in packaging liquids, powders, and foods. Within the pouch packaging market, this share is higher, around 10-15%, as pouch fillers are integral for efficiently filling and sealing various pouch types.

In the seafood packaging market, it accounts for roughly 5-8%, driven by the need for freshness retention in seafood products like fish fillets. Within the broader food packaging market, the pouch filler market holds about 6-8%, with pouches gaining popularity for ready-to-eat meals and beverages. In the cold chain packaging market, its share is lower, around 3-5%, due to the specialized nature of cold chain systems for perishable goods.

In May 2025, ProMach’s Flexibles & Trays business unit introduced its state-of-the-art MAG-R rotary horizontal form-fill-seal machine during the Pack Expo Southeast event. The MAG-R system is designed to deliver enhanced operational flexibility and performance efficiency for pouch packaging lines.

It features a modular design architecture and employs advanced magnetic linear track technology that enables faster tool changeovers, improved sealing precision, and minimized downtime. This new machine targets food and snack manufacturers seeking reliable, high-speed filling solutions that comply with stringent food safety and packaging quality standards. This development was officially announced by ProMach and listed on its website

Analysis of Pouch Filler Market by Top Investment Segments

Volumetric filling systems, food processing end use, automatic pouch fillers, and Asia Pacific region are expected to dominate the industry in 2025, driven by rising automation and packaged food demand.

Volumetric Filling Systems Lead Filling Type Segment

Volumetric filling systems are projected to lead the filling type segment with a 62% industry share in 2025, due to their accuracy, cost-effectiveness, and adaptability across dry and liquid products. These systems are mostly preferred in industries like food processing and beverages, where quick product changeover and reduced spillage are essential.
  • Gravimetric and net weight filling systems follow, serving applications demanding ultra-precise weight measurement such as pharmaceutical powders and fine chemicals. Other systems include customized fillers for unique pouch designs and specialty products but represent a smaller share.
  • Top equipment manufacturers increasingly focus on improving volumetric system flexibility and throughput efficiency to maintain competitive advantage.

Pouch Filler Market Analysis By Filling Type

Food Processing Dominates End Use Segment

Food processing will dominate the end use category with an estimated 55% industry share in 2025, fueled by rising global demand for packaged snacks, ready-to-eat meals, and dairy products. Pouch fillers ensure product freshness, portability, and attractive packaging in foods like cereals, sauces, and frozen items.
  • Beverage manufacturers also utilize for juice, milk, and energy drink packaging, contributing to industry expansion.
  • Pharmaceuticals leverage these machines for sterile liquid and powder filling, while personal care, cosmetics, and chemicals employ them for flexible, lightweight packs. Other end-use sectors comprise specialty and artisanal producers adopting pouches for niche industry differentiation and convenience.

Pouch Filler Market Analysis By End Use

Automatic Pouch Fillers Remain Preferred Automation Type

Automatic pouch fillers are projected to capture the largest share of 68% in 2025, driven by the need for speed, efficiency, and consistency in high-volume production lines. These systems reduce labour dependency and operational costs while ensuring precise filling and sealing, especially in food and beverage processing facilities.

  • Semi-automatic machines serve mid-sized manufacturers offering cost-effective alternatives where flexibility is critical for multiple product formats.
  • Manual filling solutions remain relevant for small-scale or artisanal producers requiring affordable equipment for limited runs. Top industry players focus on integrating smart controls and IoT connectivity in automatic fillers to meet Industry 4.0 manufacturing standards.

Top Pouch Filler Market DynamicsThe pouch filler market is driven by increasing demand for efficient, automated packaging systems, advancements in technology, and growing applications across industries like food and beverages, pharmaceuticals, and chemicals. However, challenges remain in integration costs and regulatory compliance.

Recent Market Trends and New Innovation by Key Players

Key players are investing in advanced robotics and automation to improve pouch filling speed and precision.The adoption of IoT-enabled systems enhances production efficiency and real-time monitoring.

  • Environmentally friendly materials and sustainable packaging solutions are being prioritized.
  • Companies are developing smart packaging features, including tamper-evident and leak-proof designs.
  • Automation is increasing to meet the growing demand for high-volume production, reducing labor costs and errors.

Top Challenges Limiting Market Potential
  • High initial investment costs for automation and advanced machinery.
  • Regulatory compliance regarding food safety standards and packaging materials.
  • Integration of new technologies into existing production lines without causing disruptions.

Top Countries Manufacturing, Synthesizing, Distributing, and Generating Demand for Pouch Fillers

Country Wise Analysis Of Pouch Filler Market

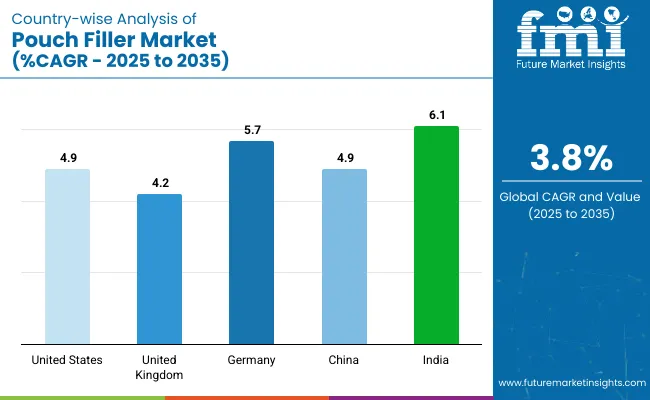
Country CAGR (2025 to 2035)
United States 4.9%
United Kingdom 4.2%
Germany 5.7%
China 4.9%
India 6.1%

India leads the growth in the Pouch Filler market with a projected CAGR of 6.1%, driven by increasing demand in the food and beverage sector, along with advancements in packaging technology. China follows closely with a CAGR of 4.9%, reflecting strong industrial growth and the increasing use of pouch fillers in various applications such as food, beverages, and consumer goods.In developed economies.

The United States (4.9%) and Germany (5.7%) show steady growth, supported by innovations in packaging solutions and the rising preference for convenient packaging options. The United Kingdom (4.2%) also continues to grow at a moderate pace, bolstered by rising demand for efficient packaging solutions in food processing.

This report covers the in-depth analysis of 40+ Countries; Five top performing OECD countries highlighted below.

An Overview of United States Pouch Filler Market Growth

The United States industry continues to lead globally, registering a steady CAGR of 4.9% from 2025 to 2035. Growth is driven by the increasing demand for fully automated, high-speed, and flexible filling systems catering to food, beverage, and pharmaceutical industries.

  • Key players prioritize smart control systems, rapid format changeovers, and energy efficiency to meet evolving production requirements. The green initiatives are prompting machinery upgrades to support recyclable and biodegradable packaging materials.
  • The rise of customized pouch packaging for premium and health-oriented food products boosts demand. This technological edge secures the United States’ position as a leader in the pouch filler equipment sector.

In-depth Analysis of United Kingdom Pouch Filler Market Performance

The United Kingdom industry is projected to expand at a CAGR of 4.2%, supported by regulatory emphasis on green packaging and low-carbon manufacturing. Manufacturers are investing in compact, multi-functional filling systems optimized for organic foods, specialty beverages, and health products.

  • Innovations focus on energy efficiency, reduced material waste, and compliance with strict food-grade standards such as BRCGS and EU safety directives.
  • Demand is also rising for flexible production lines capable of quick adaptation to small-batch and seasonal product variations. These factors combine to strengthen the UK’s role in offering precision-engineered pouch filling solutions that align with both environmental and consumer preferences.

Germany Pouch Filler Market Analysis and Growth Prospects

The Industryin Germany is anticipated to grow at a steady CAGR of 5.7% during the forecast period, reflecting its reputation for advanced industrial machinery.Robotics, IoT connectivity, and sensor-driven automation are being integrated into pouch filling lines by German manufacturers. These systems accommodate diverse product types-including viscous liquids, granules, and powders-while maintaining superior hygiene standards vital for food and pharmaceutical applications.

  • The country’s adherence to European Union green policy mandates has accelerated the development of recyclable and energy-efficient pouch filling technologies.
  • Strong export demand for high-precision filling equipment.
  • Enhances Germany’s competitive standing in the global pouch machinery landscape.

China Pouch Filler Market Expansion Amidst Industrial Upgrades

The Industry in China is expected to maintain a CAGR of 4.9%, propelled by rapid industrialization and expansion in the packaged food and personal care sectors. Domestic machinery producers are scaling up production of versatile filling equipment tailored for high-volume output, addressing the needs of both local manufacturers and export-driven industries.

  • The government’s “Made in China 2025” policy supports technological modernization, leading to increased adoption of semi-automatic and fully automatic pouch fillers.
  • Rising urban consumption and demand for convenience packaging, especially in snacks and beverages.
  • Stimulate growth. Focus on cost-effective, durable, and easy-maintenance machinery solidifies China’s role in this segment.

India Pouch Filler Market Analysis and Growth Outlook

India is set to record the highest CAGR of 6.1% in the industry between 2025 and 2035, fueled by booming demand in packaged food, dairy, and ready-to-drink beverage segments. Rapid urbanization, rising middle-class incomes, and changing dietary patterns drive the need for efficient, flexible pouch filling solutions.
  • Local manufacturers are expanding their machinery capabilities to accommodate growing small and medium-scale enterprises. Foreign direct investments from global packaging machinery brands introduce advanced automation and quality standards to the industry.
  • Government incentives promoting food safety, production efficiency, and eco packaging materials.

Leading Pouch Filler Suppliers

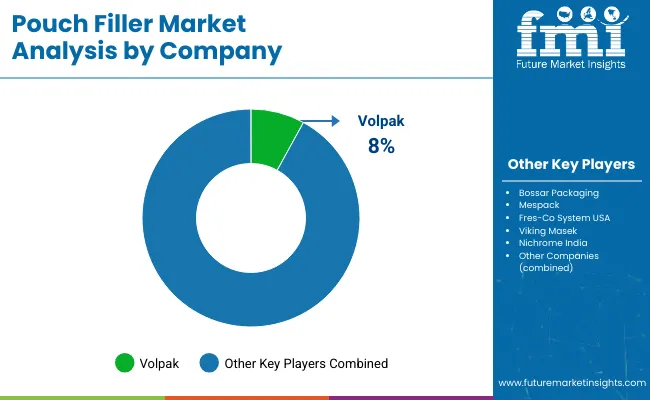
Pouch Filler Market Analysis By Company

The pouch filling machinery industry is a mix of established leaders and emerging innovators. Companies like ElecsterOyj and R.A. Jones Group have solidified their positions through years of experience and technological advancements.

Elecster, known for its aseptic pouch filling systems, serves the dairy and beverage industries with a focus on green initiative. R.A. Jones Group offers high-speed filling solutions, like the Pouch King machine, which caters to industries such as food and pharmaceuticals. New players are entering the market by focusing on flexible, modular, and eco-friendly filling solutions, addressing the growing demand for ecofriendly packaging.

The industry is expected to grow steadily, driven by the increasing demand for flexible packaging and automation in manufacturing processes. However, entry barriers are high due to the significant capital required, complex integration needs, and regulatory challenges. Despite these obstacles, consolidation is occurring, with larger firms acquiring smaller innovators to expand their technological capabilities and industry reach, leading to a more competitive landscape.

Recent Pouch Filler Industry News

  • On April 23, 2025, Volpak, a Coesia Group company, officially launched its new SM+ modular pouch packaging platform, as confirmed on its corporate website and by industry publication PackMedia. This innovative system supports both reel-fed and pre-made pouches, enabling high-speed filling of 50-240 pouches per minute.
  • SM+ offers advanced automation features, magnetic drives, and eco-friendly material compatibility, addressing the growing demand for flexible and green packaging solutions in the food, personal care, and home care industries.

Leading Players

  • Advanced Pouch Fillers
  • Southern
  • Gloex Products
  • R.A Jones Group
  • PACK'R
  • ElecsterOyj
  • Bartelt Packaging
  • FL TÈCNICS™
  • INKOPACK
  • Penn Packaging Limited

Report Scope - Pouch Filler Market

Report Attributes Details
Market Size (2025) USD 2.2 billion
Projected Market Size (2035) USD 3.2 billion
CAGR (2025 to 2035) 3.8%
Base Year for Estimation 2024
Historical Period 2020 to 2024
Projections Period 2025 to 2035
Quantitative Units USD billion for value and thousand units for volume
Filling Types Analyzed (Segment 1) Volumetric Filling Systems, Gravimetric Filling Systems, Net Weight Filling Systems, Others
Automation Types Analyzed (Segment 2) Automatic Pouch Fillers, Semi-Automatic Pouch Fillers, Manual Pouch Fillers
End Uses Analyzed (Segment 3) Food Processing, Beverages, Pharmaceuticals, Personal Care and Cosmetics, Chemicals, Others
Regions Covered North America, Europe, Asia Pacific, Latin America, Middle East & Africa
Countries Covered United States, Canada, Germany, United Kingdom, France, Italy, Spain, China, India, Japan, South Korea, Australia, Brazil, Mexico, Argentina, Saudi Arabia, UAE, South Africa
Key Players influencing the Market Volpak , Bossar Packaging, Mespack , Fres -Co System USA, Viking Masek , Nichrome India, All-Fill Inc., Paxiom Group, KHS GmbH
Additional Attributes Dollar sales, share by automation type and end use, growing demand in food processing and beverage sectors, technological advancements in automatic filling solutions, regional machinery adoption trends

Key Pouch Filler Market Segmentation

By Filling Type:

The industry is segmented by filling type into volumetric filling systems, gravimetric filling systems, net weight filling systems, and others.

By Automation Type:

By automation type, the industry is divided into automatic pouch fillers, semi-automatic pouch fillers, and manual pouch fillers.

By End Use:

By end use, the industry is segmented into food processing, beverages, pharmaceuticals, personal care and cosmetics, chemicals, and others.

By Region:

By region, the industry is segmented into North America, Europe, Asia Pacific, Latin America, and Middle East & Africa.

Table of Content

  1. Executive Summary
    • Global Market Outlook
    • Demand-side Trends
    • Supply-side Trends
    • Technology Roadmap Analysis
    • Analysis and Recommendations
  2. Market Overview
    • Market Coverage / Taxonomy
    • Market Definition / Scope / Limitations
  3. Market Background
    • Market Dynamics
      • Drivers
      • Restraints
      • Opportunity
      • Trends
    • Scenario Forecast
      • Demand in Optimistic Scenario
      • Demand in Likely Scenario
      • Demand in Conservative Scenario
    • Opportunity Map Analysis
    • Product Life Cycle Analysis
    • Supply Chain Analysis
      • Supply Side Participants and their Roles
        • Producers
        • Mid-Level Participants (Traders/ Agents/ Brokers)
        • Wholesalers and Distributors
      • Value Added and Value Created at Node in the Supply Chain
      • List of Raw Material Suppliers
      • List of Existing and Potential Buyer’s
    • Investment Feasibility Matrix
    • Value Chain Analysis
      • Profit Margin Analysis
      • Wholesalers and Distributors
      • Retailers
    • PESTLE and Porter’s Analysis
    • Regulatory Landscape
      • By Key Regions
      • By Key Countries
    • Regional Parent Market Outlook
    • Production and Consumption Statistics
    • Import and Export Statistics
  4. Global Market Analysis 2020 to 2024 and Forecast, 2025 to 2035
    • Historical Market Size Value (USD Billion) & Volume (kilotons) Analysis, 2020 to 2024
    • Current and Future Market Size Value (USD Billion) & Volume (kilotons) Projections, 2025 to 2035
      • Y-o-Y Growth Trend Analysis
      • Absolute $ Opportunity Analysis
  5. Global Market Pricing Analysis 2020 to 2024 and Forecast 2025 to 2035
  6. Global Market Analysis 2020 to 2024 and Forecast 2025 to 2035, By Filling Type
    • Introduction / Key Findings
    • Historical Market Size Value (USD Billion) & Volume (kilotons) Analysis By Filling Type, 2020 to 2024
    • Current and Future Market Size Value (USD Billion) & Volume (kilotons) Analysis and Forecast By Filling Type, 2025 to 2035
      • Volumetric Filling Systems
      • Gravimetric Filling Systems
      • Net Weight Filling Systems
      • Others
    • Y-o-Y Growth Trend Analysis By Filling Type, 2020 to 2024
    • Absolute $ Opportunity Analysis By Filling Type, 2025 to 2035
  7. Global Market Analysis 2020 to 2024 and Forecast 2025 to 2035, By Automation Type
    • Introduction / Key Findings
    • Historical Market Size Value (USD Billion) & Volume (kilotons) Analysis By Automation Type, 2020 to 2024
    • Current and Future Market Size Value (USD Billion) & Volume (kilotons) Analysis and Forecast By Automation Type, 2025 to 2035
      • Automatic Pouch Fillers
      • Semi-Automatic Pouch Fillers
      • Manual Pouch Fillers
    • Y-o-Y Growth Trend Analysis By Automation Type, 2020 to 2024
    • Absolute $ Opportunity Analysis By Automation Type, 2025 to 2035
  8. Global Market Analysis 2020 to 2024 and Forecast 2025 to 2035, By End Use
    • Introduction / Key Findings
    • Historical Market Size Value (USD Billion) & Volume (kilotons) Analysis By End Use, 2020 to 2024
    • Current and Future Market Size Value (USD Billion) & Volume (kilotons) Analysis and Forecast By End Use, 2025 to 2035
      • Food Processing
      • Beverages
      • Pharmaceuticals
      • Personal Care And Cosmetics
      • Chemicals
      • Others
    • Y-o-Y Growth Trend Analysis By End Use, 2020 to 2024
    • Absolute $ Opportunity Analysis By End Use, 2025 to 2035
  9. Global Market Analysis 2020 to 2024 and Forecast 2025 to 2035, By Region
    • Introduction
    • Historical Market Size Value (USD Billion) & Volume (kilotons) Analysis By Region, 2020 to 2024
    • Current Market Size Value (USD Billion) & Volume (kilotons) Analysis and Forecast By Region, 2025 to 2035
      • North America
      • Latin America
      • Europe
      • East Asia
      • South Asia
      • Oceania
      • MEA
    • Market Attractiveness Analysis By Region
  10. North America Market Analysis 2020 to 2024 and Forecast 2025 to 2035, By Country
    • Historical Market Size Value (USD Billion) & Volume (kilotons) Trend Analysis By Market Taxonomy, 2020 to 2024
    • Market Size Value (USD Billion) & Volume (kilotons) Forecast By Market Taxonomy, 2025 to 2035
      • By Country
        • U.S.
        • Canada
      • By Filling Type
      • By Automation Type
      • By End Use
    • Market Attractiveness Analysis
      • By Country
      • By Filling Type
      • By Automation Type
      • By End Use
    • Key Takeaways
  11. Latin America Market Analysis 2020 to 2024 and Forecast 2025 to 2035, By Country
    • Historical Market Size Value (USD Billion) & Volume (kilotons) Trend Analysis By Market Taxonomy, 2020 to 2024
    • Market Size Value (USD Billion) & Volume (kilotons) Forecast By Market Taxonomy, 2025 to 2035
      • By Country
        • Brazil
        • Mexico
        • Argentina
        • Chile
        • Peru
        • Rest of Latin America
      • By Filling Type
      • By Automation Type
      • By End Use
    • Market Attractiveness Analysis
      • By Country
      • By Filling Type
      • By Automation Type
      • By End Use
    • Key Takeaways
  12. Europe Market Analysis 2020 to 2024 and Forecast 2025 to 2035, By Country
    • Historical Market Size Value (USD Billion) & Volume (kilotons) Trend Analysis By Market Taxonomy, 2020 to 2024
    • Market Size Value (USD Billion) & Volume (kilotons) Forecast By Market Taxonomy, 2025 to 2035
      • By Country
        • Germany
        • Italy
        • France
        • U.K.
        • Spain
        • Russia
        • BENELUX
        • Rest of Europe
      • By Filling Type
      • By Automation Type
      • By End Use
    • Market Attractiveness Analysis
      • By Country
      • By Filling Type
      • By Automation Type
      • By End Use
    • Key Takeaways
  13. East Asia Market Analysis 2020 to 2024 and Forecast 2025 to 2035, By Country
    • Historical Market Size Value (USD Billion) & Volume (kilotons) Trend Analysis By Market Taxonomy, 2020 to 2024
    • Market Size Value (USD Billion) & Volume (kilotons) Forecast By Market Taxonomy, 2025 to 2035
      • By Country
        • China
        • Japan
        • South Korea
      • By Filling Type
      • By Automation Type
      • By End Use
    • Market Attractiveness Analysis
      • By Country
      • By Filling Type
      • By Automation Type
      • By End Use
    • Key Takeaways
  14. South Asia Market Analysis 2020 to 2024 and Forecast 2025 to 2035, By Country
    • Historical Market Size Value (USD Billion) & Volume (kilotons) Trend Analysis By Market Taxonomy, 2020 to 2024
    • Market Size Value (USD Billion) & Volume (kilotons) Forecast By Market Taxonomy, 2025 to 2035
      • By Country
        • India
        • Thailand
        • Malaysia
        • Indonesia
        • Rest of South Asia
      • By Filling Type
      • By Automation Type
      • By End Use
    • Market Attractiveness Analysis
      • By Country
      • By Filling Type
      • By Automation Type
      • By End Use
    • Key Takeaways
  15. Oceania Market Analysis 2020 to 2024 and Forecast 2025 to 2035, By Country
    • Historical Market Size Value (USD Billion) & Volume (kilotons) Trend Analysis By Market Taxonomy, 2020 to 2024
    • Market Size Value (USD Billion) & Volume (kilotons) Forecast By Market Taxonomy, 2025 to 2035
      • By Country
        • Australia
        • New Zealand
      • By Filling Type
      • By Automation Type
      • By End Use
    • Market Attractiveness Analysis
      • By Country
      • By Filling Type
      • By Automation Type
      • By End Use
    • Key Takeaways
  16. MEA Market Analysis 2020 to 2024 and Forecast 2025 to 2035, By Country
    • Historical Market Size Value (USD Billion) & Volume (kilotons) Trend Analysis By Market Taxonomy, 2020 to 2024
    • Market Size Value (USD Billion) & Volume (kilotons) Forecast By Market Taxonomy, 2025 to 2035
      • By Country
        • GCC
        • Rest of MEA
      • By Filling Type
      • By Automation Type
      • By End Use
    • Market Attractiveness Analysis
      • By Country
      • By Filling Type
      • By Automation Type
      • By End Use
    • Key Takeaways
  17. Key Countries Market Analysis
    • U.S.
      • Pricing Analysis
      • Market Share Analysis, 2024
        • By Filling Type
        • By Automation Type
        • By End Use
    • Canada
      • Pricing Analysis
      • Market Share Analysis, 2024
        • By Filling Type
        • By Automation Type
        • By End Use
    • Brazil
      • Pricing Analysis
      • Market Share Analysis, 2024
        • By Filling Type
        • By Automation Type
        • By End Use
    • Mexico
      • Pricing Analysis
      • Market Share Analysis, 2024
        • By Filling Type
        • By Automation Type
        • By End Use
    • Argentina
      • Pricing Analysis
      • Market Share Analysis, 2024
        • By Filling Type
        • By Automation Type
        • By End Use
  18. Market Structure Analysis
    • Competition Dashboard
    • Competition Benchmarking
    • Market Share Analysis of Top Players
      • By Regional
      • By Filling Type
      • By Automation Type
      • By End Use
  19. Competition Analysis
    • Competition Deep Dive
      • Volpak
        • Overview
        • Product Portfolio
        • Profitability by Market Segments (Product/Age /Sales Channel/Region)
        • Sales Footprint
        • Strategy Overview
          • Marketing Strategy
          • Product Strategy
          • Channel Strategy
      • Bossar Packaging
        • Overview
        • Product Portfolio
        • Profitability by Market Segments (Product/Age /Sales Channel/Region)
        • Sales Footprint
        • Strategy Overview
          • Marketing Strategy
          • Product Strategy
          • Channel Strategy
      • Mespack
        • Overview
        • Product Portfolio
        • Profitability by Market Segments (Product/Age /Sales Channel/Region)
        • Sales Footprint
        • Strategy Overview
          • Marketing Strategy
          • Product Strategy
          • Channel Strategy
      • Fres-Co System USA
        • Overview
        • Product Portfolio
        • Profitability by Market Segments (Product/Age /Sales Channel/Region)
        • Sales Footprint
        • Strategy Overview
          • Marketing Strategy
          • Product Strategy
          • Channel Strategy
      • Viking Masek
        • Overview
        • Product Portfolio
        • Profitability by Market Segments (Product/Age /Sales Channel/Region)
        • Sales Footprint
        • Strategy Overview
          • Marketing Strategy
          • Product Strategy
          • Channel Strategy
      • Nichrome India
        • Overview
        • Product Portfolio
        • Profitability by Market Segments (Product/Age /Sales Channel/Region)
        • Sales Footprint
        • Strategy Overview
          • Marketing Strategy
          • Product Strategy
          • Channel Strategy
      • All-Fill Inc.
        • Overview
        • Product Portfolio
        • Profitability by Market Segments (Product/Age /Sales Channel/Region)
        • Sales Footprint
        • Strategy Overview
          • Marketing Strategy
          • Product Strategy
          • Channel Strategy
      • Paxiom Group
        • Overview
        • Product Portfolio
        • Profitability by Market Segments (Product/Age /Sales Channel/Region)
        • Sales Footprint
        • Strategy Overview
          • Marketing Strategy
          • Product Strategy
          • Channel Strategy
      • KHS GmbH
        • Overview
        • Product Portfolio
        • Profitability by Market Segments (Product/Age /Sales Channel/Region)
        • Sales Footprint
        • Strategy Overview
          • Marketing Strategy
          • Product Strategy
          • Channel Strategy
  20. Assumptions & Acronyms Used
  21. Research Methodology

List of Tables

  • Table 1: Global Market Value (USD Billion) Forecast by Region, 2020 to 2035
  • Table 2: Global Market Volume (kilotons) Forecast by Region, 2020 to 2035
  • Table 3: Global Market Value (USD Billion) Forecast by Filling Type, 2020 to 2035
  • Table 4: Global Market Volume (kilotons) Forecast by Filling Type, 2020 to 2035
  • Table 5: Global Market Value (USD Billion) Forecast by Automation Type, 2020 to 2035
  • Table 6: Global Market Volume (kilotons) Forecast by Automation Type, 2020 to 2035
  • Table 7: Global Market Value (USD Billion) Forecast by End Use, 2020 to 2035
  • Table 8: Global Market Volume (kilotons) Forecast by End Use, 2020 to 2035
  • Table 9: North America Market Value (USD Billion) Forecast by Country, 2020 to 2035
  • Table 10: North America Market Volume (kilotons) Forecast by Country, 2020 to 2035
  • Table 11: North America Market Value (USD Billion) Forecast by Filling Type, 2020 to 2035
  • Table 12: North America Market Volume (kilotons) Forecast by Filling Type, 2020 to 2035
  • Table 13: North America Market Value (USD Billion) Forecast by Automation Type, 2020 to 2035
  • Table 14: North America Market Volume (kilotons) Forecast by Automation Type, 2020 to 2035
  • Table 15: North America Market Value (USD Billion) Forecast by End Use, 2020 to 2035
  • Table 16: North America Market Volume (kilotons) Forecast by End Use, 2020 to 2035
  • Table 17: Latin America Market Value (USD Billion) Forecast by Country, 2020 to 2035
  • Table 18: Latin America Market Volume (kilotons) Forecast by Country, 2020 to 2035
  • Table 19: Latin America Market Value (USD Billion) Forecast by Filling Type, 2020 to 2035
  • Table 20: Latin America Market Volume (kilotons) Forecast by Filling Type, 2020 to 2035
  • Table 21: Latin America Market Value (USD Billion) Forecast by Automation Type, 2020 to 2035
  • Table 22: Latin America Market Volume (kilotons) Forecast by Automation Type, 2020 to 2035
  • Table 23: Latin America Market Value (USD Billion) Forecast by End Use, 2020 to 2035
  • Table 24: Latin America Market Volume (kilotons) Forecast by End Use, 2020 to 2035
  • Table 25: Europe Market Value (USD Billion) Forecast by Country, 2020 to 2035
  • Table 26: Europe Market Volume (kilotons) Forecast by Country, 2020 to 2035
  • Table 27: Europe Market Value (USD Billion) Forecast by Filling Type, 2020 to 2035
  • Table 28: Europe Market Volume (kilotons) Forecast by Filling Type, 2020 to 2035
  • Table 29: Europe Market Value (USD Billion) Forecast by Automation Type, 2020 to 2035
  • Table 30: Europe Market Volume (kilotons) Forecast by Automation Type, 2020 to 2035
  • Table 31: Europe Market Value (USD Billion) Forecast by End Use, 2020 to 2035
  • Table 32: Europe Market Volume (kilotons) Forecast by End Use, 2020 to 2035
  • Table 33: East Asia Market Value (USD Billion) Forecast by Country, 2020 to 2035
  • Table 34: East Asia Market Volume (kilotons) Forecast by Country, 2020 to 2035
  • Table 35: East Asia Market Value (USD Billion) Forecast by Filling Type, 2020 to 2035
  • Table 36: East Asia Market Volume (kilotons) Forecast by Filling Type, 2020 to 2035
  • Table 37: East Asia Market Value (USD Billion) Forecast by Automation Type, 2020 to 2035
  • Table 38: East Asia Market Volume (kilotons) Forecast by Automation Type, 2020 to 2035
  • Table 39: East Asia Market Value (USD Billion) Forecast by End Use, 2020 to 2035
  • Table 40: East Asia Market Volume (kilotons) Forecast by End Use, 2020 to 2035
  • Table 41: South Asia Market Value (USD Billion) Forecast by Country, 2020 to 2035
  • Table 42: South Asia Market Volume (kilotons) Forecast by Country, 2020 to 2035
  • Table 43: South Asia Market Value (USD Billion) Forecast by Filling Type, 2020 to 2035
  • Table 44: South Asia Market Volume (kilotons) Forecast by Filling Type, 2020 to 2035
  • Table 45: South Asia Market Value (USD Billion) Forecast by Automation Type, 2020 to 2035
  • Table 46: South Asia Market Volume (kilotons) Forecast by Automation Type, 2020 to 2035
  • Table 47: South Asia Market Value (USD Billion) Forecast by End Use, 2020 to 2035
  • Table 48: South Asia Market Volume (kilotons) Forecast by End Use, 2020 to 2035
  • Table 49: Oceania Market Value (USD Billion) Forecast by Country, 2020 to 2035
  • Table 50: Oceania Market Volume (kilotons) Forecast by Country, 2020 to 2035
  • Table 51: Oceania Market Value (USD Billion) Forecast by Filling Type, 2020 to 2035
  • Table 52: Oceania Market Volume (kilotons) Forecast by Filling Type, 2020 to 2035
  • Table 53: Oceania Market Value (USD Billion) Forecast by Automation Type, 2020 to 2035
  • Table 54: Oceania Market Volume (kilotons) Forecast by Automation Type, 2020 to 2035
  • Table 55: Oceania Market Value (USD Billion) Forecast by End Use, 2020 to 2035
  • Table 56: Oceania Market Volume (kilotons) Forecast by End Use, 2020 to 2035
  • Table 57: MEA Market Value (USD Billion) Forecast by Country, 2020 to 2035
  • Table 58: MEA Market Volume (kilotons) Forecast by Country, 2020 to 2035
  • Table 59: MEA Market Value (USD Billion) Forecast by Filling Type, 2020 to 2035
  • Table 60: MEA Market Volume (kilotons) Forecast by Filling Type, 2020 to 2035
  • Table 61: MEA Market Value (USD Billion) Forecast by Automation Type, 2020 to 2035
  • Table 62: MEA Market Volume (kilotons) Forecast by Automation Type, 2020 to 2035
  • Table 63: MEA Market Value (USD Billion) Forecast by End Use, 2020 to 2035
  • Table 64: MEA Market Volume (kilotons) Forecast by End Use, 2020 to 2035

List of Figures

  • Figure 1: Global Market Volume (kilotons) Forecast 2020 to 2035
  • Figure 2: Global Market Pricing Analysis
  • Figure 3: Global Market Value (USD Billion) Forecast 2020 to 2035
  • Figure 4: Global Market Value Share and BPS Analysis by Filling Type, 2025 and 2035
  • Figure 5: Global Market Y-o-Y Growth Comparison by Filling Type, 2025 to 2035
  • Figure 6: Global Market Attractiveness Analysis by Filling Type
  • Figure 7: Global Market Value Share and BPS Analysis by Automation Type, 2025 and 2035
  • Figure 8: Global Market Y-o-Y Growth Comparison by Automation Type, 2025 to 2035
  • Figure 9: Global Market Attractiveness Analysis by Automation Type
  • Figure 10: Global Market Value Share and BPS Analysis by End Use, 2025 and 2035
  • Figure 11: Global Market Y-o-Y Growth Comparison by End Use, 2025 to 2035
  • Figure 12: Global Market Attractiveness Analysis by End Use
  • Figure 13: Global Market Value (USD Billion) Share and BPS Analysis by Region, 2025 and 2035
  • Figure 14: Global Market Y-o-Y Growth Comparison by Region, 2025 to 2035
  • Figure 15: Global Market Attractiveness Analysis by Region
  • Figure 16: North America Market Incremental $ Opportunity, 2025 to 2035
  • Figure 17: Latin America Market Incremental $ Opportunity, 2025 to 2035
  • Figure 18: Europe Market Incremental $ Opportunity, 2025 to 2035
  • Figure 19: East Asia Market Incremental $ Opportunity, 2025 to 2035
  • Figure 20: South Asia Market Incremental $ Opportunity, 2025 to 2035
  • Figure 21: Oceania Market Incremental $ Opportunity, 2025 to 2035
  • Figure 22: MEA Market Incremental $ Opportunity, 2025 to 2035
  • Figure 23: North America Market Value Share and BPS Analysis by Country, 2025 and 2035
  • Figure 24: North America Market Value Share and BPS Analysis by Filling Type, 2025 and 2035
  • Figure 25: North America Market Y-o-Y Growth Comparison by Filling Type, 2025 to 2035
  • Figure 26: North America Market Attractiveness Analysis by Filling Type
  • Figure 27: North America Market Value Share and BPS Analysis by Automation Type, 2025 and 2035
  • Figure 28: North America Market Y-o-Y Growth Comparison by Automation Type, 2025 to 2035
  • Figure 29: North America Market Attractiveness Analysis by Automation Type
  • Figure 30: North America Market Value Share and BPS Analysis by End Use, 2025 and 2035
  • Figure 31: North America Market Y-o-Y Growth Comparison by End Use, 2025 to 2035
  • Figure 32: North America Market Attractiveness Analysis by End Use
  • Figure 33: Latin America Market Value Share and BPS Analysis by Country, 2025 and 2035
  • Figure 34: Latin America Market Value Share and BPS Analysis by Filling Type, 2025 and 2035
  • Figure 35: Latin America Market Y-o-Y Growth Comparison by Filling Type, 2025 to 2035
  • Figure 36: Latin America Market Attractiveness Analysis by Filling Type
  • Figure 37: Latin America Market Value Share and BPS Analysis by Automation Type, 2025 and 2035
  • Figure 38: Latin America Market Y-o-Y Growth Comparison by Automation Type, 2025 to 2035
  • Figure 39: Latin America Market Attractiveness Analysis by Automation Type
  • Figure 40: Latin America Market Value Share and BPS Analysis by End Use, 2025 and 2035
  • Figure 41: Latin America Market Y-o-Y Growth Comparison by End Use, 2025 to 2035
  • Figure 42: Latin America Market Attractiveness Analysis by End Use
  • Figure 43: Europe Market Value Share and BPS Analysis by Country, 2025 and 2035
  • Figure 44: Europe Market Value Share and BPS Analysis by Filling Type, 2025 and 2035
  • Figure 45: Europe Market Y-o-Y Growth Comparison by Filling Type, 2025 to 2035
  • Figure 46: Europe Market Attractiveness Analysis by Filling Type
  • Figure 47: Europe Market Value Share and BPS Analysis by Automation Type, 2025 and 2035
  • Figure 48: Europe Market Y-o-Y Growth Comparison by Automation Type, 2025 to 2035
  • Figure 49: Europe Market Attractiveness Analysis by Automation Type
  • Figure 50: Europe Market Value Share and BPS Analysis by End Use, 2025 and 2035
  • Figure 51: Europe Market Y-o-Y Growth Comparison by End Use, 2025 to 2035
  • Figure 52: Europe Market Attractiveness Analysis by End Use
  • Figure 53: East Asia Market Value Share and BPS Analysis by Country, 2025 and 2035
  • Figure 54: East Asia Market Value Share and BPS Analysis by Filling Type, 2025 and 2035
  • Figure 55: East Asia Market Y-o-Y Growth Comparison by Filling Type, 2025 to 2035
  • Figure 56: East Asia Market Attractiveness Analysis by Filling Type
  • Figure 57: East Asia Market Value Share and BPS Analysis by Automation Type, 2025 and 2035
  • Figure 58: East Asia Market Y-o-Y Growth Comparison by Automation Type, 2025 to 2035
  • Figure 59: East Asia Market Attractiveness Analysis by Automation Type
  • Figure 60: East Asia Market Value Share and BPS Analysis by End Use, 2025 and 2035
  • Figure 61: East Asia Market Y-o-Y Growth Comparison by End Use, 2025 to 2035
  • Figure 62: East Asia Market Attractiveness Analysis by End Use
  • Figure 63: South Asia Market Value Share and BPS Analysis by Country, 2025 and 2035
  • Figure 64: South Asia Market Value Share and BPS Analysis by Filling Type, 2025 and 2035
  • Figure 65: South Asia Market Y-o-Y Growth Comparison by Filling Type, 2025 to 2035
  • Figure 66: South Asia Market Attractiveness Analysis by Filling Type
  • Figure 67: South Asia Market Value Share and BPS Analysis by Automation Type, 2025 and 2035
  • Figure 68: South Asia Market Y-o-Y Growth Comparison by Automation Type, 2025 to 2035
  • Figure 69: South Asia Market Attractiveness Analysis by Automation Type
  • Figure 70: South Asia Market Value Share and BPS Analysis by End Use, 2025 and 2035
  • Figure 71: South Asia Market Y-o-Y Growth Comparison by End Use, 2025 to 2035
  • Figure 72: South Asia Market Attractiveness Analysis by End Use
  • Figure 73: Oceania Market Value Share and BPS Analysis by Country, 2025 and 2035
  • Figure 74: Oceania Market Value Share and BPS Analysis by Filling Type, 2025 and 2035
  • Figure 75: Oceania Market Y-o-Y Growth Comparison by Filling Type, 2025 to 2035
  • Figure 76: Oceania Market Attractiveness Analysis by Filling Type
  • Figure 77: Oceania Market Value Share and BPS Analysis by Automation Type, 2025 and 2035
  • Figure 78: Oceania Market Y-o-Y Growth Comparison by Automation Type, 2025 to 2035
  • Figure 79: Oceania Market Attractiveness Analysis by Automation Type
  • Figure 80: Oceania Market Value Share and BPS Analysis by End Use, 2025 and 2035
  • Figure 81: Oceania Market Y-o-Y Growth Comparison by End Use, 2025 to 2035
  • Figure 82: Oceania Market Attractiveness Analysis by End Use
  • Figure 83: MEA Market Value Share and BPS Analysis by Country, 2025 and 2035
  • Figure 84: MEA Market Value Share and BPS Analysis by Filling Type, 2025 and 2035
  • Figure 85: MEA Market Y-o-Y Growth Comparison by Filling Type, 2025 to 2035
  • Figure 86: MEA Market Attractiveness Analysis by Filling Type
  • Figure 87: MEA Market Value Share and BPS Analysis by Automation Type, 2025 and 2035
  • Figure 88: MEA Market Y-o-Y Growth Comparison by Automation Type, 2025 to 2035
  • Figure 89: MEA Market Attractiveness Analysis by Automation Type
  • Figure 90: MEA Market Value Share and BPS Analysis by End Use, 2025 and 2035
  • Figure 91: MEA Market Y-o-Y Growth Comparison by End Use, 2025 to 2035
  • Figure 92: MEA Market Attractiveness Analysis by End Use
  • Figure 93: Global Market - Tier Structure Analysis
  • Figure 94: Global Market - Company Share Analysis

Frequently Asked Questions

What is the estimated market size of the pouch filler industry in 2025?

The global industry is projected to reach USD 2.2 billion in 2025.

What will be the forecasted market value of mas by 2035?

The industry is expected to grow to USD 3.2 billion by 2035.

Which companies are key players in the global pouch filler market?

Leading players include Volpak, Bossar Packaging, Mespack, Fres-Co System USA, Viking Masek, Nichrome India, All-Fill Inc., Paxiom Group, and KHS GmbH.

What is the expected CAGR for the pouch filler market from 2025 to 2035?

The industry is anticipated to expand at a CAGR of 3.8% during the forecast period.

What are the main factors driving the growth of the pouch filler market?

Rising demand for flexible packaging, automation in filling systems, and growing usage in food & beverage and pharmaceutical sectors are key drivers.

Explore Similar Insights

Future Market Insights

Pouch Filler Market