Fire Sprinkler System Market Size and Share Forecast Outlook 2025 to 2035

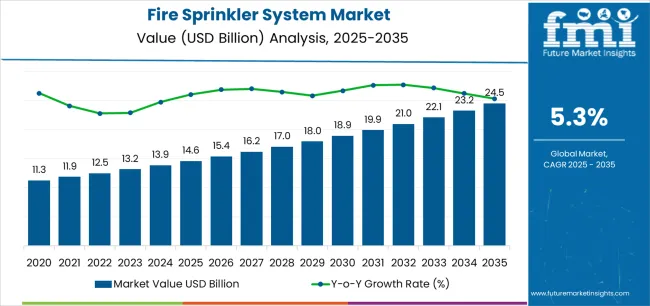
The fire sprinkler system market, valued at USD 14.6 billion in 2025, is projected to reach USD 24.4 billion by 2035, growing at a CAGR of 5.3%. The early growth phase of the market is expected to be steady but measured, driven primarily by increasing awareness of fire safety regulations and rising adoption in commercial and residential construction. Initial growth is influenced by regulatory compliance, especially in regions where building codes mandate fire suppression systems, and by retrofit projects in existing buildings seeking improved safety standards.

In the late growth phase, market expansion is anticipated to accelerate due to broader adoption across industrial facilities, educational institutions, and large-scale infrastructure projects. Technological advancements, including smart sprinkler systems, improved detection mechanisms, and integration with building management systems, will enhance system efficiency and reliability, encouraging wider deployment. Manufacturers focusing on product innovation and strategic regional expansion are likely to capture a greater share of the growing market.

Comparing early and late growth phases, the early curve reflects incremental adoption and cautious investment, while the late curve demonstrates faster accumulation of market value as infrastructure development intensifies and technological benefits become more widely recognized.
Quick Stats for Fire Sprinkler System Market

  • Fire Sprinkler System Market Value (2025): USD 14.6 billion
  • Fire Sprinkler System Market Forecast Value (2035): USD 24.4 billion
  • Fire Sprinkler System Market Forecast CAGR: 5.3%
  • Leading System Type in Fire Sprinkler System Market: Wet Pipe
  • Key Growth Regions in Fire Sprinkler System Market: South Asia Pacific, East Asia, and North America
  • Top Key Players in Fire Sprinkler System Market: Tyco (Johnson Controls), Viking Group Inc., Reliable Automatic Sprinkler Co., Globe Fire Sprinkler Corp., Victaulic Company

Fire Sprinkler System Market Market Value Analysis

Where revenue comes from - now vs next (industry-level view)

Period Primary Revenue Buckets Share Notes
Today New system installations (commercial, industrial, residential) 48% Code-driven, new construction requirements
Retrofit & upgrade projects 24% Existing buildings, regulatory compliance
Maintenance & inspection services 14% Periodic testing, code compliance verification
Component replacement & repair 10% Sprinkler heads, valves, piping upgrades
Design & engineering services 4% System specification, hydraulic calculations
Future (3-5 yrs) Connected & smart sprinkler systems 28-32% IoT integration, predictive maintenance
New construction installations 24-28% High-rise, warehouse automation, data centers
Retrofit & code compliance 18-22% High-rise safety, social housing upgrades
Service & lifecycle management 12-16% Subscription models, remote monitoring
Specialized systems (ESFR, water-mist, clean agent) 10-14% High-value, high-performance applications
Component & parts revenue 6-8% Replacement heads, valves, accessories

Fire Sprinkler System Market Key Takeaways

Metric Value
Market Value (2025) USD 14.6 billion
Market Forecast (2035) USD 24.4 billion
Growth Rate 5.3% CAGR
Leading System Technology Wet Pipe
Primary Application Commercial Segment

The market demonstrates strong fundamentals with wet pipe sprinkler systems capturing dominant share through proven reliability capabilities and commercial building optimization. Commercial applications drive primary demand, supported by increasing code enforcement requirements and high-rise construction development. Geographic expansion remains concentrated in developed markets with established fire safety infrastructure, while emerging economies show accelerating adoption rates driven by urbanization initiatives and rising life safety standards.

Imperatives for Stakeholders in Fire Sprinkler System Market

Design for compliance, not just water delivery

  • Offer integrated solutions: sprinklers + hydraulic calculations + code compliance documentation + installation support + commissioning services + inspection protocols.
  • Preconfigured building packages: commercial office systems, industrial warehouse solutions, residential tower configurations, and digital monitoring integration for lifecycle management.

Connected technology readiness

  • IoT sensor integration, predictive maintenance analytics, remote monitoring capabilities, and cloud-based management platforms with real-time system health visibility and automated compliance reporting.

Lifecycle service approach

  • Installation quality assurance, periodic inspection programs, component replacement tracking, and comprehensive maintenance contracts with guaranteed code compliance and system reliability over building lifespan.

Value-based business models

  • Clear system pricing + transparent installation costs + code compliance guarantees; service subscription programs for facility operators with assured inspection schedules and predictive maintenance optimization.

Segmental Analysis

Primary Classification: The market segments by system type into wet pipe, dry pipe, pre-action, water-mist, clean agent, deluge, and standpipe systems, representing the evolution from basic water-based suppression to sophisticated fire protection solutions for comprehensive life safety optimization.

Secondary Classification: Technology segmentation divides the market into CMDA (Control Mode Density Area), ESFR (Early Suppression Fast Response), CMSA (Control Mode Specific Application), and in-rack sprinkler configurations, reflecting distinct requirements for fire control methodology, storage protection, and suppression effectiveness standards.

Tertiary Classification: Application segmentation covers commercial, industrial, residential, and government & institutional sectors, while response time spans quick response and standard response categories, and hazard class encompasses ordinary hazard, light hazard, and extra hazard classifications.

Regional Classification: Geographic distribution covers North America, Latin America, Western Europe, Eastern Europe, East Asia, South Asia Pacific, and Middle East & Africa, with developed markets leading installations while emerging economies show accelerating growth patterns driven by building code adoption programs.

The segmentation structure reveals technology progression from traditional water-based systems toward sophisticated suppression technologies with enhanced control and monitoring capabilities, while application diversity spans from commercial offices to industrial warehouses requiring comprehensive fire protection solutions.
By System Type, the Wet Pipe Segment Accounts for Dominant Market Share

Fire Sprinkler System Market Analysis By System Type

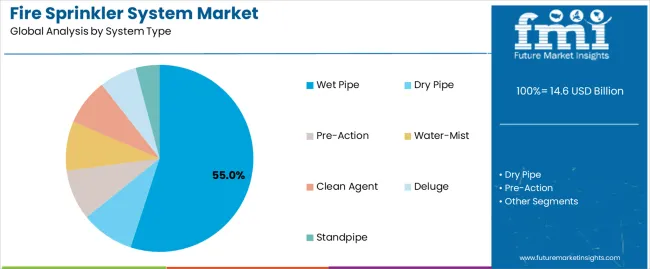
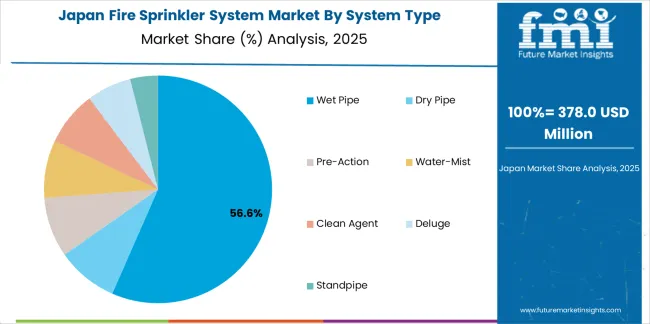
Market Position: Wet pipe systems command the leading position in the fire sprinkler system market with 55.0% market share through proven reliability features, including simple operation, rapid response, and commercial building optimization that enable property owners to achieve effective fire protection across diverse office, retail, and hospitality environments.

Value Drivers: The segment benefits from building owner preference for straightforward suppression systems that provide immediate water discharge, lower installation costs, and operational simplicity without requiring complex controls or freeze protection. Advanced design features enable code compliance assurance, standard component availability, and integration with building fire alarm systems, where reliability and cost-effectiveness represent critical investment requirements.

Competitive Advantages: Wet pipe sprinkler systems differentiate through proven field reliability, lowest total cost of ownership, and compatibility with comprehensive fire protection strategies that enhance building safety while maintaining optimal economic value suitable for diverse commercial and residential applications.

Key market characteristics:

  • Advanced hydraulic designs with optimized pipe sizing and sprinkler placement configurations
  • Enhanced reliability, enabling immediate water discharge with minimal maintenance requirements
  • Building code compatibility, including NFPA compliance, insurance approval, and authority having jurisdiction acceptance for fire protection operations

Dry Pipe Shows Cold Climate Strength

Dry pipe systems maintain a 16.0% market position in the fire sprinkler system market due to their freeze protection capabilities in unheated spaces. These systems appeal to facilities requiring fire protection in cold storage, parking structures, and outdoor loading areas. Market strength is driven by warehouse expansion and cold climate applications, emphasizing reliable freeze-proof solutions through pressurized pipe configurations.

Pre-Action Shows High-Value Asset Protection

Pre-action systems capture 9.0% market share through specialized requirements in data centers, museums, and archives requiring dual-interlock protection against accidental water discharge. Water-mist systems hold 6.0%, clean agent systems account for 5.0%, deluge systems represent 5.0%, while standpipe systems maintain 4.0% through specialized fire protection applications.
By Technology, the CMDA Segment Shows Dominant Market Position

Fire Sprinkler System Market Analysis By Technology

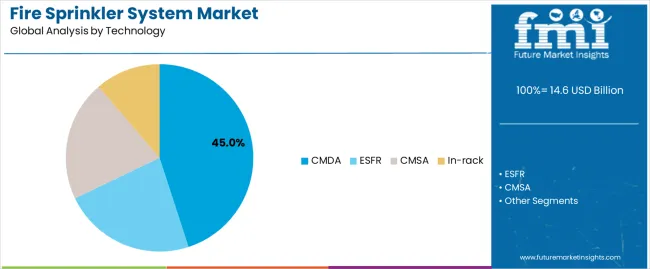
Market Context: Control Mode Density Area (CMDA) technology demonstrates the dominant market position in the fire sprinkler system market with 45.0% market share due to widespread adoption of conventional sprinkler protection and increasing focus on general fire control, building occupancy protection, and traditional hazard coverage that maximizes life safety while maintaining code compliance standards.

Appeal Factors: CMDA users prioritize proven protection methodology, broad applicability, and compatibility with standard building designs that enable effective fire control across multiple occupancy types. The segment benefits from substantial building code acceptance and established design standards that emphasize the deployment of density-based systems for general commercial and residential fire protection applications.

Growth Drivers: Commercial construction programs incorporate CMDA sprinklers as baseline fire protection for office buildings, while residential high-rise development increases demand for code-compliant systems that provide adequate occupant protection and property conservation.

Market Challenges: High-challenge storage and specialized industrial applications may require more advanced ESFR or specialized technologies beyond traditional CMDA capabilities.

Application dynamics include:

  • Strong adoption in commercial office buildings requiring code-compliant fire protection systems
  • Increasing deployment in residential towers and mixed-use developments for life safety applications
  • Rising integration with fire alarm systems for coordinated building protection and emergency response

ESFR Shows Storage Application Leadership

Early Suppression Fast Response (ESFR) technology captures 18.0% market share through superior performance in high-piling storage and warehouse applications requiring fire suppression rather than mere control. In-rack sprinklers hold 25.0% market share, while CMSA (Control Mode Specific Application) accounts for 12.0% through specialized protection scenarios.
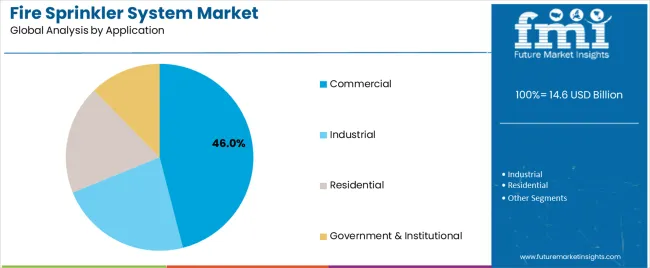
By Application, the Commercial Segment Leads Market Share

Fire Sprinkler System Market Analysis By Application

Market Position: Commercial applications command dominant market position with 46.0% market share through extensive building code requirements and property protection mandates.

Value Drivers: This application segment provides the fundamental fire protection requirements for office buildings, retail centers, hotels, and healthcare facilities, meeting life safety needs, insurance requirements, and building code compliance without operational exceptions.

Growth Characteristics: The segment benefits from continuous commercial construction activity, retrofit mandate programs, and insurance incentive structures that support widespread sprinkler adoption and system upgrade cycles.

Industrial Applications Show Specialized Growth

Industrial facilities capture 25.0% market share through manufacturing, warehouse, and logistics protection requiring high-challenge fire suppression and property conservation. Residential applications hold 24.0% share, while government & institutional sectors account for 5.0% through public buildings, schools, and infrastructure facilities.

What are the Drivers, Restraints, and Key Trends of the Fire Sprinkler System Market?

Category Factor Impact Why It Matters
Driver Building code enforcement & high-rise regulations (residential tower mandates, commercial retrofit requirements, tragic fire incident responses) ★★★★★ Fatal building fires driving regulatory tightening; jurisdictions mandating sprinkler retrofits in existing high-rises and social housing creating substantial market expansion beyond new construction.
Driver Warehouse automation & e-commerce logistics (fulfillment center construction, high-piling storage, automated retrieval systems) ★★★★★ E-commerce growth driving massive warehouse construction; automated high-bay facilities requiring sophisticated ESFR and in-rack sprinkler protection for property conservation and business continuity.
Driver Insurance incentives & premium reduction (property loss prevention, business interruption mitigation, carrier requirements) ★★★★☆ Insurance carriers offering significant premium discounts for sprinklered buildings; loss prevention economics improving sprinkler ROI beyond code compliance for property owners and tenants.
Restraint Installation cost & water infrastructure (upfront capital, water supply requirements, building disruption during retrofit) ★★★★☆ High retrofit costs deterring voluntary adoption; water supply adequacy and building disruption challenges in existing structures limiting penetration despite life safety benefits.
Restraint Maintenance requirements & false activation concerns (testing obligations, freeze risks in dry pipe, water damage from accidental discharge) ★★★☆☆ Property owners concerned about ongoing inspection costs; rare but costly accidental discharge incidents and freeze-related failures creating adoption hesitancy despite statistical safety advantages.
Trend Connected & smart sprinkler systems (IoT sensors, predictive maintenance, cloud monitoring, analytics-driven inspection) ★★★★★ Building automation driving sprinkler system digitization; connected devices enabling remote monitoring, predictive component replacement, and automated compliance documentation transforming service models.
Trend Water-mist & clean agent alternatives (water-efficient technologies, sensitive equipment protection, heritage building applications) ★★★★☆ Water scarcity and data center growth driving alternative suppression; mist and gaseous systems protecting electronics and artifacts while reducing water consumption and environmental impact.

Analysis of the Fire Sprinkler System Market by Key Country

The market demonstrates varied regional dynamics with Growth Leaders including India (5.8% growth rate) and China (5.6% growth rate) driving expansion through urbanization initiatives and high-rise construction development. Steady Performers encompass United States (5.5% growth rate), South Korea (5.4% growth rate), and United Kingdom (5.1% growth rate), benefiting from established fire codes and retrofit mandate programs. Developed Markets feature Germany (5.0% growth rate) and Japan (4.4% growth rate), where industrial facility upgrades and building stock modernization support consistent growth patterns.

Regional synthesis reveals South Asian markets leading adoption through rapid urban construction and safety code tightening, while North American and East Asian countries maintain strong growth supported by warehouse automation and commercial real estate development. European markets show steady growth driven by retrofit programs and industrial safety directive compliance.
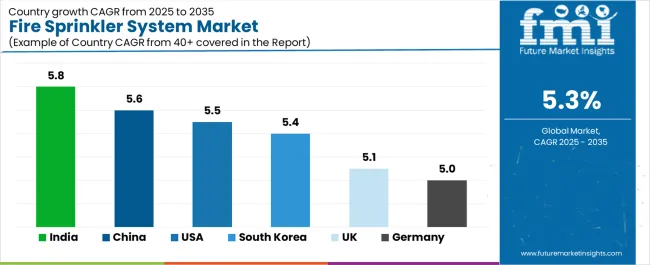
Fire Sprinkler System Market Cagr Analysis By Country

Region/Country 2025-2035 Growth How to win What to watch out
India 5.8% Focus on high-rise expertise Payment cycles; enforcement inconsistency
China 5.6% Lead with ESFR warehouse solutions Local competition; margin pressure
United States 5.5% Push connected services Contractor availability; code fragmentation
South Korea 5.4% Premium data center systems Economic cycles; export dependency
United Kingdom 5.1% Retrofit program alignment Skills shortage; supply chain Brexit impacts
Germany 5.0% Industrial upgrade focus Conservative adoption; extended sales cycles
Japan 4.4% Compact system innovation Shrinking construction; deflation pressures

India Drives Fastest Market Growth

Fire Sprinkler System Market Country Value Analysis

India establishes fastest market growth through aggressive urban development programs and comprehensive high-rise construction expansion, integrating fire sprinkler systems as mandatory components in residential towers and commercial complexes. The country's 5.8% growth rate reflects government initiatives promoting building safety and fire code enforcement that mandate the use of automatic suppression systems in high-rise and commercial facilities. Growth concentrates in major metropolitan regions, including Mumbai high-rise developments, Bengaluru IT parks, and NCR commercial construction, where building infrastructure showcases expanding sprinkler deployment that appeals to developers seeking code compliance and insurance approval.

Indian construction markets are adopting fire sprinkler technology through increasing code enforcement in metro cities and tragic fire incident responses driving regulatory tightening, including residential tower mandates and commercial building requirements. Installation channels through fire protection contractors and MEP system integrators expand market access, while growing fire safety awareness and insurance requirements support adoption across diverse commercial and residential segments.

Strategic Market Indicators:

  • Rapid urban construction with high-rise residential and commercial pipeline requiring automatic sprinkler protection
  • Tightening safety compliance in metropolitan areas following high-profile fire incidents driving retrofit demand
  • Commercial office and IT park construction incorporating sprinkler systems for occupant safety and insurance compliance
  • Growing awareness among developers and property owners regarding fire protection importance and liability mitigation

China Maintains Warehouse and Commercial Construction Leadership

In Shanghai logistics parks, Guangzhou commercial developments, and nationwide e-commerce fulfillment centers, property developers and warehouse operators are implementing fire sprinkler systems as mandatory infrastructure for building approval and operational insurance applications, driven by warehousing build-out and commercial construction scale that emphasize the importance of property protection. The market holds a 5.6% growth rate, supported by continued urbanization and automated logistics expansion that promote advanced sprinkler systems for warehouse and commercial building facilities. Chinese operators are deploying sprinkler systems that provide reliable fire suppression and code compliance, particularly appealing in high-bay warehouse regions where inventory protection and business continuity represent critical investment requirements.

Market expansion benefits from massive e-commerce logistics infrastructure development and commercial real estate construction that require comprehensive fire protection systems. Technology adoption follows patterns established in building systems, where code compliance and insurance requirements drive installation decisions and facility-scale deployment.

Market Intelligence Brief:

  • Warehousing and logistics build-out driving ESFR and in-rack sprinkler demand for automated fulfillment centers
  • Automated storage facilities requiring sophisticated sprinkler protection for high-piling and robotic retrieval systems
  • Commercial construction maintaining steady sprinkler installation demand for office towers and retail developments
  • Industrial facility expansion incorporating fire suppression systems for manufacturing and process operations

United States Shows Retrofit and Smart System Leadership

United States establishes market leadership through comprehensive building code enforcement and emerging connected sprinkler technology adoption, integrating fire protection systems across commercial retrofits and new construction. The country's 5.5% growth rate reflects strict code requirements and mature fire safety infrastructure that supports widespread sprinkler installation in commercial and residential high-rise facilities. Demand concentrates in commercial real estate markets, warehouse automation projects, and residential tower construction, where building development showcases mandatory sprinkler deployment that appeals to property owners seeking code compliance and liability protection.

American fire protection markets leverage established contractor networks and comprehensive code enforcement frameworks, including NFPA standards and local building requirements that mandate sprinkler installation. The market benefits from insurance premium incentives and retrofit mandate programs that support system installation in existing buildings and emerging smart sprinkler service models offering predictive maintenance.

Market Intelligence Brief:

  • Strict code enforcement driving commercial real estate sprinkler installation and retrofit compliance
  • Warehouse automation and e-commerce fulfillment center construction requiring sophisticated ESFR protection
  • Connected sprinkler services gaining traction with real-time monitoring and predictive maintenance capabilities
  • Residential high-rise development maintaining steady sprinkler installation demand in urban markets

South Korea Shows Data Center and Manufacturing Focus

In Seoul data center clusters, Gyeonggi manufacturing complexes, and nationwide semiconductor facilities, industrial operators are implementing advanced fire sprinkler systems as critical infrastructure for equipment protection and business continuity applications, driven by technology infrastructure investment and stringent fire codes that emphasize the importance of reliable suppression. The market holds a 5.4% growth rate, supported by advanced manufacturing expansion and data center construction that promote specialized sprinkler systems for high-value asset protection. Korean operators are deploying sprinkler systems that provide equipment-safe suppression and rapid response, particularly appealing in technology facilities where downtime prevention and asset protection represent paramount operational requirements.

Market expansion benefits from substantial technology infrastructure investment and comprehensive national fire code enforcement that require sophisticated fire protection. Technology adoption follows patterns established in facility systems, where asset value and business continuity drive specification decisions and premium system deployment.

Market Intelligence Brief:

  • Advanced manufacturing facilities requiring specialized fire protection for cleanrooms and process equipment
  • Data center investments driving water-mist and pre-action system demand for sensitive electronics protection
  • Strong national fire codes and regular inspection programs ensuring consistent sprinkler system maintenance
  • Technology infrastructure growth supporting premium fire protection system specifications and installations

United Kingdom Shows High-Rise Retrofit Leadership

United Kingdom's building safety reform demonstrates accelerated fire sprinkler deployment with emphasis on high-rise residential retrofits and social housing upgrades through regulatory response to building safety failures. The country maintains a 5.1% growth rate, driven by comprehensive retrofit mandates and warehouse automation expansion.

Market dynamics focus on residential tower sprinkler retrofits meeting new safety regulations and warehouse fire protection for e-commerce logistics expansion. Regulatory change and automation trends create sustained opportunities for sprinkler installation in existing buildings and new industrial facilities.

Strategic Market Considerations:

  • High-rise residential regulations mandating sprinkler retrofits in existing towers and social housing complexes
  • Social housing fire safety programs driving systematic sprinkler installation across public housing stock
  • Warehouse automation in retail and e-commerce hubs requiring ESFR and rack sprinkler protection
  • Building safety awareness following Grenfell Tower creating political and social pressure for comprehensive fire protection

Germany Shows Industrial Safety Focus

Germany's industrial safety standards demonstrate comprehensive fire sprinkler deployment with emphasis on manufacturing facility upgrades and compliance with EU safety directives through established regulatory frameworks. The country maintains a 5.0% growth rate, driven by industrial modernization and public building retrofit programs.

Market dynamics focus on industrial facility fire protection meeting stringent German and EU safety requirements combined with steady public building upgrade cycles. Safety culture and regulatory compliance create consistent demand for sprinkler systems in industrial and institutional applications.

Strategic Market Considerations:
  • Industrial facility upgrades incorporating sprinkler systems for worker safety and property protection compliance
  • Stringent EU safety directives driving fire protection system installation in manufacturing and process industries
  • Public building retrofit programs systematically adding sprinklers to schools, hospitals, and government facilities
  • Insurance requirements and loss prevention focus supporting voluntary sprinkler adoption beyond code mandates

Japan Shows Building Stock Modernization Demand

Fire Sprinkler System Market Japan Market Share Analysis By System Type

Japan's aging building infrastructure demonstrates fire sprinkler deployment with focus on retrofit applications and healthcare facility protection through quality standards and disaster preparedness culture. The country maintains a 4.4% growth rate, driven by building stock modernization and specialized facility requirements.

Market dynamics focus on aging building retrofits addressing fire safety in older construction and healthcare facilities requiring life safety systems for vulnerable populations. Conservative but steady upgrade programs and disaster preparedness focus create sustained sprinkler demand in institutional applications.

Strategic Market Considerations:
  • Aging building stock retrofit programs incorporating sprinklers in existing commercial and residential structures
  • Healthcare and transit facility upgrades prioritizing fire protection for vulnerable populations and public safety
  • Conservative but steady renovation cycles addressing fire safety in older construction inventory
  • Disaster preparedness culture supporting comprehensive building protection including fire suppression systems

Europe Market Split by Country

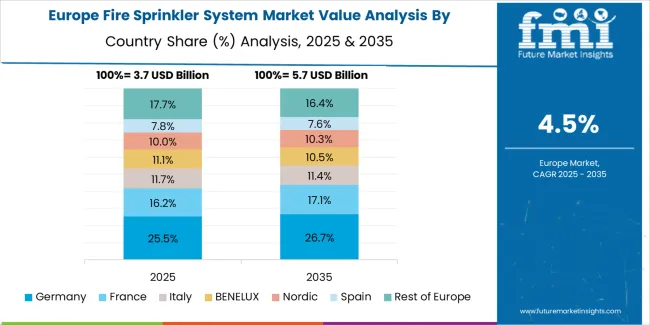
Fire Sprinkler System Market Europe Country Market Share Analysis, 2025 & 2035

The fire sprinkler system market in Europe is projected to grow from USD 3.9 billion in 2025 to USD 6.3 billion by 2035, registering a CAGR of 5.0% over the forecast period. Germany is expected to maintain leadership with a 26.5% share in 2025, easing to 25.8% by 2035, supported by stringent industrial safety norms and steady retrofit activity.

France follows with an 18.7% share in 2025, edging to 19.0% by 2035 on hospital and public building upgrades. United Kingdom holds a 17.1% share in 2025, moving to 16.9% by 2035 amid strong warehouse automation demand. Italy accounts for a 14.0% share in 2025, while Spain represents 11.8% in 2025, both benefiting from tourism-related hospitality development and mixed-use construction projects. Rest of Europe collectively rises from 11.9% to 12.6% by 2035 as Nordic and Eastern European markets accelerate fire code adoption and building safety standard implementation.
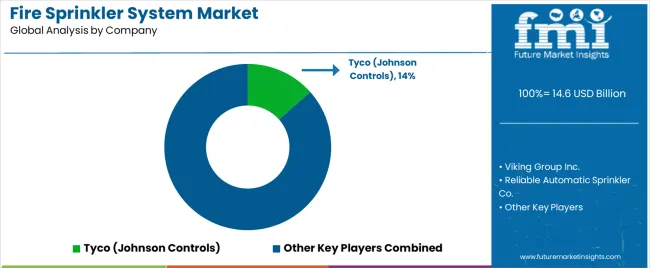
Competitive Landscape of the Fire Sprinkler System Market

Fire Sprinkler System Market Analysis By Company
  • Structure: Approximately 20-30 credible players; top 5-7 hold approximately 45-50% by revenue.
  • Leadership is maintained through: product breadth, distribution networks, and code expertise (UL/FM listings + installation base + technical support).
  • What's commoditizing: standard wet pipe sprinkler heads and basic system components in common applications.
  • Margin Opportunities: connected/smart systems, specialized ESFR products, and comprehensive service programs (predictive maintenance, remote monitoring, lifecycle management contracts).
Stakeholder What they actually control Typical strengths Typical blind spots
Integrated fire protection OEMs Product development, UL/FM testing, distribution networks Technology innovation, code expertise, brand credibility Installation execution; local market nuances
Regional/national contractors Installation relationships, code authority connections, service networks Customer intimacy, inspection business, permit knowledge Product technology; global reach
Wholesale distributors Inventory management, contractor credit, logistics networks Volume aggregation, working capital, delivery speed Manufacturing control; end-user relationships
Building services integrators MEP coordination, general contractor relationships, project management System integration, single-source convenience, schedule certainty Sprinkler expertise depth; aftermarket service
Specialty technology providers Water-mist systems, clean agent, digital platforms Performance differentiation, niche applications Market scale; distribution breadth

Key Players in the Fire Sprinkler System Market

  • Tyco (Johnson Controls)
  • Viking Group Inc.
  • Reliable Automatic Sprinkler Co.
  • Globe Fire Sprinkler Corp.
  • Victaulic Company
  • Minimax GmbH
  • Siemens AG (Building Technologies)
  • Honeywell International Inc.
  • APi Group Corporation
  • Hochiki Corporation

Scope of the Report

Item Value
Quantitative Units USD 14.6 billion
System Type Wet Pipe, Dry Pipe, Pre-Action, Water-Mist, Clean Agent, Deluge, Standpipe
Technology CMDA, ESFR, CMSA, In-rack
Application Commercial, Industrial, Residential, Government & Institutional
Response Time Quick, Standard
Hazard Class Ordinary Hazard, Light Hazard, Extra Hazard
Regions Covered North America, Latin America, Western Europe, Eastern Europe, East Asia, South Asia Pacific, Middle East & Africa
Countries Covered United States, China, Germany, India, United Kingdom, Japan, South Korea, Canada, Brazil, France, Australia, and 25+ additional countries
Key Companies Profiled Tyco (Johnson Controls), Viking Group Inc., Reliable Automatic Sprinkler Co., Globe Fire Sprinkler Corp., Victaulic Company, Minimax GmbH, Siemens AG (Building Technologies), Honeywell International Inc., APi Group Corporation, Hochiki Corporation
Additional Attributes Dollar sales by system type and application categories, regional installation trends across South Asia Pacific, East Asia, and North America, competitive landscape with fire protection equipment manufacturers and building services contractors, building owner preferences for code compliance and life safety protection, integration with fire alarm systems and building management platforms, innovations in connected sprinkler technology and suppression performance, and development of specialized fire protection solutions with enhanced reliability and service optimization capabilities.

Fire Sprinkler System Market by Segments

System Type:

  • Wet Pipe
  • Dry Pipe
  • Pre-Action
  • Water-Mist
  • Clean Agent
  • Deluge
  • Standpipe

Technology:

  • CMDA
  • ESFR
  • CMSA
  • In-rack

Application:

  • Commercial
  • Industrial
  • Residential
  • Government & Institutional

Response Time:

  • Quick
  • Standard

Hazard Class:

  • Ordinary Hazard
  • Light Hazard
  • Extra Hazard

Region:

  • North America
    • United States
    • Canada
    • Mexico
  • Latin America
    • Brazil
    • Chile
    • Rest of Latin America
  • Western Europe
    • Germany
    • United Kingdom
    • France
    • Italy
    • Spain
    • Nordic
    • BENELUX
    • Rest of Western Europe
  • Eastern Europe
    • Russia
    • Poland
    • Rest of Eastern Europe
  • East Asia
    • China
    • Japan
    • South Korea
  • South Asia Pacific
    • India
    • ASEAN
    • Australia & New Zealand
    • Rest of South Asia Pacific
  • Middle East & Africa
    • Kingdom of Saudi Arabia
    • Other GCC Countries
    • Turkey
    • South Africa
    • Other African Union
    • Rest of Middle East & Africa

Frequently Asked Questions

How big is the fire sprinkler system market in 2025?

The global fire sprinkler system market is estimated to be valued at USD 14.6 billion in 2025.

What will be the size of fire sprinkler system market in 2035?

The market size for the fire sprinkler system market is projected to reach USD 24.5 billion by 2035.

How much will be the fire sprinkler system market growth between 2025 and 2035?

The fire sprinkler system market is expected to grow at a 5.3% CAGR between 2025 and 2035.

What are the key product types in the fire sprinkler system market?

The key product types in fire sprinkler system market are wet pipe, dry pipe, pre-action, water-mist, clean agent, deluge and standpipe.

Which technology segment to contribute significant share in the fire sprinkler system market in 2025?

In terms of technology, cmda segment to command 45.0% share in the fire sprinkler system market in 2025.

Table of Content

  1. Executive Summary
    • Global Market Outlook
    • Demand to side Trends
    • Supply to side Trends
    • Technology Roadmap Analysis
    • Analysis and Recommendations
  2. Market Overview
    • Market Coverage / Taxonomy
    • Market Definition / Scope / Limitations
  3. Market Background
    • Market Dynamics
      • Drivers
      • Restraints
      • Opportunity
      • Trends
    • Scenario Forecast
      • Demand in Optimistic Scenario
      • Demand in Likely Scenario
      • Demand in Conservative Scenario
    • Opportunity Map Analysis
    • Product Life Cycle Analysis
    • Supply Chain Analysis
    • Investment Feasibility Matrix
    • Value Chain Analysis
    • PESTLE and Porter’s Analysis
    • Regulatory Landscape
    • Regional Parent Market Outlook
    • Production and Consumption Statistics
    • Import and Export Statistics
  4. Global Market Analysis 2020 to 2024 and Forecast, 2025 to 2035
    • Historical Market Size Value (USD Million) Analysis, 2020 to 2024
    • Current and Future Market Size Value (USD Million) Projections, 2025 to 2035
      • Y to o to Y Growth Trend Analysis
      • Absolute $ Opportunity Analysis
  5. Global Market Pricing Analysis 2020 to 2024 and Forecast 2025 to 2035
  6. Global Market Analysis 2020 to 2024 and Forecast 2025 to 2035, By System Type
    • Introduction / Key Findings
    • Historical Market Size Value (USD Million) Analysis By System Type , 2020 to 2024
    • Current and Future Market Size Value (USD Million) Analysis and Forecast By System Type , 2025 to 2035
      • Wet Pipe
      • Dry Pipe
      • Pre-Action
      • Water-Mist
      • Clean Agent
      • Deluge
      • Standpipe
    • Y to o to Y Growth Trend Analysis By System Type , 2020 to 2024
    • Absolute $ Opportunity Analysis By System Type , 2025 to 2035
  7. Global Market Analysis 2020 to 2024 and Forecast 2025 to 2035, By Technology
    • Introduction / Key Findings
    • Historical Market Size Value (USD Million) Analysis By Technology, 2020 to 2024
    • Current and Future Market Size Value (USD Million) Analysis and Forecast By Technology, 2025 to 2035
      • CMDA
      • ESFR
      • CMSA
      • In-rack
    • Y to o to Y Growth Trend Analysis By Technology, 2020 to 2024
    • Absolute $ Opportunity Analysis By Technology, 2025 to 2035
  8. Global Market Analysis 2020 to 2024 and Forecast 2025 to 2035, By Application
    • Introduction / Key Findings
    • Historical Market Size Value (USD Million) Analysis By Application, 2020 to 2024
    • Current and Future Market Size Value (USD Million) Analysis and Forecast By Application, 2025 to 2035
      • Commercial
      • Industrial
      • Residential
      • Government & Institutional
    • Y to o to Y Growth Trend Analysis By Application, 2020 to 2024
    • Absolute $ Opportunity Analysis By Application, 2025 to 2035
  9. Global Market Analysis 2020 to 2024 and Forecast 2025 to 2035, By Region
    • Introduction
    • Historical Market Size Value (USD Million) Analysis By Region, 2020 to 2024
    • Current Market Size Value (USD Million) Analysis and Forecast By Region, 2025 to 2035
      • North America
      • Latin America
      • Western Europe
      • Eastern Europe
      • East Asia
      • South Asia and Pacific
      • Middle East & Africa
    • Market Attractiveness Analysis By Region
  10. North America Market Analysis 2020 to 2024 and Forecast 2025 to 2035, By Country
    • Historical Market Size Value (USD Million) Trend Analysis By Market Taxonomy, 2020 to 2024
    • Market Size Value (USD Million) Forecast By Market Taxonomy, 2025 to 2035
      • By Country
        • USA
        • Canada
        • Mexico
      • By System Type
      • By Technology
      • By Application
    • Market Attractiveness Analysis
      • By Country
      • By System Type
      • By Technology
      • By Application
    • Key Takeaways
  11. Latin America Market Analysis 2020 to 2024 and Forecast 2025 to 2035, By Country
    • Historical Market Size Value (USD Million) Trend Analysis By Market Taxonomy, 2020 to 2024
    • Market Size Value (USD Million) Forecast By Market Taxonomy, 2025 to 2035
      • By Country
        • Brazil
        • Chile
        • Rest of Latin America
      • By System Type
      • By Technology
      • By Application
    • Market Attractiveness Analysis
      • By Country
      • By System Type
      • By Technology
      • By Application
    • Key Takeaways
  12. Western Europe Market Analysis 2020 to 2024 and Forecast 2025 to 2035, By Country
    • Historical Market Size Value (USD Million) Trend Analysis By Market Taxonomy, 2020 to 2024
    • Market Size Value (USD Million) Forecast By Market Taxonomy, 2025 to 2035
      • By Country
        • Germany
        • UK
        • Italy
        • Spain
        • France
        • Nordic
        • BENELUX
        • Rest of Western Europe
      • By System Type
      • By Technology
      • By Application
    • Market Attractiveness Analysis
      • By Country
      • By System Type
      • By Technology
      • By Application
    • Key Takeaways
  13. Eastern Europe Market Analysis 2020 to 2024 and Forecast 2025 to 2035, By Country
    • Historical Market Size Value (USD Million) Trend Analysis By Market Taxonomy, 2020 to 2024
    • Market Size Value (USD Million) Forecast By Market Taxonomy, 2025 to 2035
      • By Country
        • Russia
        • Poland
        • Hungary
        • Balkan & Baltic
        • Rest of Eastern Europe
      • By System Type
      • By Technology
      • By Application
    • Market Attractiveness Analysis
      • By Country
      • By System Type
      • By Technology
      • By Application
    • Key Takeaways
  14. East Asia Market Analysis 2020 to 2024 and Forecast 2025 to 2035, By Country
    • Historical Market Size Value (USD Million) Trend Analysis By Market Taxonomy, 2020 to 2024
    • Market Size Value (USD Million) Forecast By Market Taxonomy, 2025 to 2035
      • By Country
        • China
        • Japan
        • South Korea
      • By System Type
      • By Technology
      • By Application
    • Market Attractiveness Analysis
      • By Country
      • By System Type
      • By Technology
      • By Application
    • Key Takeaways
  15. South Asia and Pacific Market Analysis 2020 to 2024 and Forecast 2025 to 2035, By Country
    • Historical Market Size Value (USD Million) Trend Analysis By Market Taxonomy, 2020 to 2024
    • Market Size Value (USD Million) Forecast By Market Taxonomy, 2025 to 2035
      • By Country
        • India
        • ASEAN
        • Australia & New Zealand
        • Rest of South Asia and Pacific
      • By System Type
      • By Technology
      • By Application
    • Market Attractiveness Analysis
      • By Country
      • By System Type
      • By Technology
      • By Application
    • Key Takeaways
  16. Middle East & Africa Market Analysis 2020 to 2024 and Forecast 2025 to 2035, By Country
    • Historical Market Size Value (USD Million) Trend Analysis By Market Taxonomy, 2020 to 2024
    • Market Size Value (USD Million) Forecast By Market Taxonomy, 2025 to 2035
      • By Country
        • Kingdom of Saudi Arabia
        • Other GCC Countries
        • Turkiye
        • South Africa
        • Other African Union
        • Rest of Middle East & Africa
      • By System Type
      • By Technology
      • By Application
    • Market Attractiveness Analysis
      • By Country
      • By System Type
      • By Technology
      • By Application
    • Key Takeaways
  17. Key Countries Market Analysis
    • USA
      • Pricing Analysis
      • Market Share Analysis, 2024
        • By System Type
        • By Technology
        • By Application
    • Canada
      • Pricing Analysis
      • Market Share Analysis, 2024
        • By System Type
        • By Technology
        • By Application
    • Mexico
      • Pricing Analysis
      • Market Share Analysis, 2024
        • By System Type
        • By Technology
        • By Application
    • Brazil
      • Pricing Analysis
      • Market Share Analysis, 2024
        • By System Type
        • By Technology
        • By Application
    • Chile
      • Pricing Analysis
      • Market Share Analysis, 2024
        • By System Type
        • By Technology
        • By Application
    • Germany
      • Pricing Analysis
      • Market Share Analysis, 2024
        • By System Type
        • By Technology
        • By Application
    • UK
      • Pricing Analysis
      • Market Share Analysis, 2024
        • By System Type
        • By Technology
        • By Application
    • Italy
      • Pricing Analysis
      • Market Share Analysis, 2024
        • By System Type
        • By Technology
        • By Application
    • Spain
      • Pricing Analysis
      • Market Share Analysis, 2024
        • By System Type
        • By Technology
        • By Application
    • France
      • Pricing Analysis
      • Market Share Analysis, 2024
        • By System Type
        • By Technology
        • By Application
    • India
      • Pricing Analysis
      • Market Share Analysis, 2024
        • By System Type
        • By Technology
        • By Application
    • ASEAN
      • Pricing Analysis
      • Market Share Analysis, 2024
        • By System Type
        • By Technology
        • By Application
    • Australia & New Zealand
      • Pricing Analysis
      • Market Share Analysis, 2024
        • By System Type
        • By Technology
        • By Application
    • China
      • Pricing Analysis
      • Market Share Analysis, 2024
        • By System Type
        • By Technology
        • By Application
    • Japan
      • Pricing Analysis
      • Market Share Analysis, 2024
        • By System Type
        • By Technology
        • By Application
    • South Korea
      • Pricing Analysis
      • Market Share Analysis, 2024
        • By System Type
        • By Technology
        • By Application
    • Russia
      • Pricing Analysis
      • Market Share Analysis, 2024
        • By System Type
        • By Technology
        • By Application
    • Poland
      • Pricing Analysis
      • Market Share Analysis, 2024
        • By System Type
        • By Technology
        • By Application
    • Hungary
      • Pricing Analysis
      • Market Share Analysis, 2024
        • By System Type
        • By Technology
        • By Application
    • Kingdom of Saudi Arabia
      • Pricing Analysis
      • Market Share Analysis, 2024
        • By System Type
        • By Technology
        • By Application
    • Turkiye
      • Pricing Analysis
      • Market Share Analysis, 2024
        • By System Type
        • By Technology
        • By Application
    • South Africa
      • Pricing Analysis
      • Market Share Analysis, 2024
        • By System Type
        • By Technology
        • By Application
  18. Market Structure Analysis
    • Competition Dashboard
    • Competition Benchmarking
    • Market Share Analysis of Top Players
      • By Regional
      • By System Type
      • By Technology
      • By Application
  19. Competition Analysis
    • Competition Deep Dive
      • Tyco (Johnson Controls)
        • Overview
        • Product Portfolio
        • Profitability by Market Segments (Product/Age /Sales Channel/Region)
        • Sales Footprint
        • Strategy Overview
          • Marketing Strategy
          • Product Strategy
          • Channel Strategy
      • Viking Group Inc.
      • Reliable Automatic Sprinkler Co.
      • Globe Fire Sprinkler Corp.
      • Victaulic Company
      • Minimax GmbH
      • Siemens AG (Building Technologies)
      • Honeywell International Inc.
      • APi Group Corporation
      • Hochiki Corporation
  20. Assumptions & Acronyms Used
  21. Research Methodology

List of Tables

  • Table 1: Global Market Value (USD Million) Forecast by Region, 2020 to 2035
  • Table 2: Global Market Value (USD Million) Forecast by System Type , 2020 to 2035
  • Table 3: Global Market Value (USD Million) Forecast by Technology, 2020 to 2035
  • Table 4: Global Market Value (USD Million) Forecast by Application, 2020 to 2035
  • Table 5: North America Market Value (USD Million) Forecast by Country, 2020 to 2035
  • Table 6: North America Market Value (USD Million) Forecast by System Type , 2020 to 2035
  • Table 7: North America Market Value (USD Million) Forecast by Technology, 2020 to 2035
  • Table 8: North America Market Value (USD Million) Forecast by Application, 2020 to 2035
  • Table 9: Latin America Market Value (USD Million) Forecast by Country, 2020 to 2035
  • Table 10: Latin America Market Value (USD Million) Forecast by System Type , 2020 to 2035
  • Table 11: Latin America Market Value (USD Million) Forecast by Technology, 2020 to 2035
  • Table 12: Latin America Market Value (USD Million) Forecast by Application, 2020 to 2035
  • Table 13: Western Europe Market Value (USD Million) Forecast by Country, 2020 to 2035
  • Table 14: Western Europe Market Value (USD Million) Forecast by System Type , 2020 to 2035
  • Table 15: Western Europe Market Value (USD Million) Forecast by Technology, 2020 to 2035
  • Table 16: Western Europe Market Value (USD Million) Forecast by Application, 2020 to 2035
  • Table 17: Eastern Europe Market Value (USD Million) Forecast by Country, 2020 to 2035
  • Table 18: Eastern Europe Market Value (USD Million) Forecast by System Type , 2020 to 2035
  • Table 19: Eastern Europe Market Value (USD Million) Forecast by Technology, 2020 to 2035
  • Table 20: Eastern Europe Market Value (USD Million) Forecast by Application, 2020 to 2035
  • Table 21: East Asia Market Value (USD Million) Forecast by Country, 2020 to 2035
  • Table 22: East Asia Market Value (USD Million) Forecast by System Type , 2020 to 2035
  • Table 23: East Asia Market Value (USD Million) Forecast by Technology, 2020 to 2035
  • Table 24: East Asia Market Value (USD Million) Forecast by Application, 2020 to 2035
  • Table 25: South Asia and Pacific Market Value (USD Million) Forecast by Country, 2020 to 2035
  • Table 26: South Asia and Pacific Market Value (USD Million) Forecast by System Type , 2020 to 2035
  • Table 27: South Asia and Pacific Market Value (USD Million) Forecast by Technology, 2020 to 2035
  • Table 28: South Asia and Pacific Market Value (USD Million) Forecast by Application, 2020 to 2035
  • Table 29: Middle East & Africa Market Value (USD Million) Forecast by Country, 2020 to 2035
  • Table 30: Middle East & Africa Market Value (USD Million) Forecast by System Type , 2020 to 2035
  • Table 31: Middle East & Africa Market Value (USD Million) Forecast by Technology, 2020 to 2035
  • Table 32: Middle East & Africa Market Value (USD Million) Forecast by Application, 2020 to 2035

List of Figures

  • Figure 1: Global Market Pricing Analysis
  • Figure 2: Global Market Value (USD Million) Forecast 2020-2035
  • Figure 3: Global Market Value Share and BPS Analysis by System Type , 2025 and 2035
  • Figure 4: Global Market Y to o to Y Growth Comparison by System Type , 2025-2035
  • Figure 5: Global Market Attractiveness Analysis by System Type
  • Figure 6: Global Market Value Share and BPS Analysis by Technology, 2025 and 2035
  • Figure 7: Global Market Y to o to Y Growth Comparison by Technology, 2025-2035
  • Figure 8: Global Market Attractiveness Analysis by Technology
  • Figure 9: Global Market Value Share and BPS Analysis by Application, 2025 and 2035
  • Figure 10: Global Market Y to o to Y Growth Comparison by Application, 2025-2035
  • Figure 11: Global Market Attractiveness Analysis by Application
  • Figure 12: Global Market Value (USD Million) Share and BPS Analysis by Region, 2025 and 2035
  • Figure 13: Global Market Y to o to Y Growth Comparison by Region, 2025-2035
  • Figure 14: Global Market Attractiveness Analysis by Region
  • Figure 15: North America Market Incremental Dollar Opportunity, 2025-2035
  • Figure 16: Latin America Market Incremental Dollar Opportunity, 2025-2035
  • Figure 17: Western Europe Market Incremental Dollar Opportunity, 2025-2035
  • Figure 18: Eastern Europe Market Incremental Dollar Opportunity, 2025-2035
  • Figure 19: East Asia Market Incremental Dollar Opportunity, 2025-2035
  • Figure 20: South Asia and Pacific Market Incremental Dollar Opportunity, 2025-2035
  • Figure 21: Middle East & Africa Market Incremental Dollar Opportunity, 2025-2035
  • Figure 22: North America Market Value Share and BPS Analysis by Country, 2025 and 2035
  • Figure 23: North America Market Value Share and BPS Analysis by System Type , 2025 and 2035
  • Figure 24: North America Market Y to o to Y Growth Comparison by System Type , 2025-2035
  • Figure 25: North America Market Attractiveness Analysis by System Type
  • Figure 26: North America Market Value Share and BPS Analysis by Technology, 2025 and 2035
  • Figure 27: North America Market Y to o to Y Growth Comparison by Technology, 2025-2035
  • Figure 28: North America Market Attractiveness Analysis by Technology
  • Figure 29: North America Market Value Share and BPS Analysis by Application, 2025 and 2035
  • Figure 30: North America Market Y to o to Y Growth Comparison by Application, 2025-2035
  • Figure 31: North America Market Attractiveness Analysis by Application
  • Figure 32: Latin America Market Value Share and BPS Analysis by Country, 2025 and 2035
  • Figure 33: Latin America Market Value Share and BPS Analysis by System Type , 2025 and 2035
  • Figure 34: Latin America Market Y to o to Y Growth Comparison by System Type , 2025-2035
  • Figure 35: Latin America Market Attractiveness Analysis by System Type
  • Figure 36: Latin America Market Value Share and BPS Analysis by Technology, 2025 and 2035
  • Figure 37: Latin America Market Y to o to Y Growth Comparison by Technology, 2025-2035
  • Figure 38: Latin America Market Attractiveness Analysis by Technology
  • Figure 39: Latin America Market Value Share and BPS Analysis by Application, 2025 and 2035
  • Figure 40: Latin America Market Y to o to Y Growth Comparison by Application, 2025-2035
  • Figure 41: Latin America Market Attractiveness Analysis by Application
  • Figure 42: Western Europe Market Value Share and BPS Analysis by Country, 2025 and 2035
  • Figure 43: Western Europe Market Value Share and BPS Analysis by System Type , 2025 and 2035
  • Figure 44: Western Europe Market Y to o to Y Growth Comparison by System Type , 2025-2035
  • Figure 45: Western Europe Market Attractiveness Analysis by System Type
  • Figure 46: Western Europe Market Value Share and BPS Analysis by Technology, 2025 and 2035
  • Figure 47: Western Europe Market Y to o to Y Growth Comparison by Technology, 2025-2035
  • Figure 48: Western Europe Market Attractiveness Analysis by Technology
  • Figure 49: Western Europe Market Value Share and BPS Analysis by Application, 2025 and 2035
  • Figure 50: Western Europe Market Y to o to Y Growth Comparison by Application, 2025-2035
  • Figure 51: Western Europe Market Attractiveness Analysis by Application
  • Figure 52: Eastern Europe Market Value Share and BPS Analysis by Country, 2025 and 2035
  • Figure 53: Eastern Europe Market Value Share and BPS Analysis by System Type , 2025 and 2035
  • Figure 54: Eastern Europe Market Y to o to Y Growth Comparison by System Type , 2025-2035
  • Figure 55: Eastern Europe Market Attractiveness Analysis by System Type
  • Figure 56: Eastern Europe Market Value Share and BPS Analysis by Technology, 2025 and 2035
  • Figure 57: Eastern Europe Market Y to o to Y Growth Comparison by Technology, 2025-2035
  • Figure 58: Eastern Europe Market Attractiveness Analysis by Technology
  • Figure 59: Eastern Europe Market Value Share and BPS Analysis by Application, 2025 and 2035
  • Figure 60: Eastern Europe Market Y to o to Y Growth Comparison by Application, 2025-2035
  • Figure 61: Eastern Europe Market Attractiveness Analysis by Application
  • Figure 62: East Asia Market Value Share and BPS Analysis by Country, 2025 and 2035
  • Figure 63: East Asia Market Value Share and BPS Analysis by System Type , 2025 and 2035
  • Figure 64: East Asia Market Y to o to Y Growth Comparison by System Type , 2025-2035
  • Figure 65: East Asia Market Attractiveness Analysis by System Type
  • Figure 66: East Asia Market Value Share and BPS Analysis by Technology, 2025 and 2035
  • Figure 67: East Asia Market Y to o to Y Growth Comparison by Technology, 2025-2035
  • Figure 68: East Asia Market Attractiveness Analysis by Technology
  • Figure 69: East Asia Market Value Share and BPS Analysis by Application, 2025 and 2035
  • Figure 70: East Asia Market Y to o to Y Growth Comparison by Application, 2025-2035
  • Figure 71: East Asia Market Attractiveness Analysis by Application
  • Figure 72: South Asia and Pacific Market Value Share and BPS Analysis by Country, 2025 and 2035
  • Figure 73: South Asia and Pacific Market Value Share and BPS Analysis by System Type , 2025 and 2035
  • Figure 74: South Asia and Pacific Market Y to o to Y Growth Comparison by System Type , 2025-2035
  • Figure 75: South Asia and Pacific Market Attractiveness Analysis by System Type
  • Figure 76: South Asia and Pacific Market Value Share and BPS Analysis by Technology, 2025 and 2035
  • Figure 77: South Asia and Pacific Market Y to o to Y Growth Comparison by Technology, 2025-2035
  • Figure 78: South Asia and Pacific Market Attractiveness Analysis by Technology
  • Figure 79: South Asia and Pacific Market Value Share and BPS Analysis by Application, 2025 and 2035
  • Figure 80: South Asia and Pacific Market Y to o to Y Growth Comparison by Application, 2025-2035
  • Figure 81: South Asia and Pacific Market Attractiveness Analysis by Application
  • Figure 82: Middle East & Africa Market Value Share and BPS Analysis by Country, 2025 and 2035
  • Figure 83: Middle East & Africa Market Value Share and BPS Analysis by System Type , 2025 and 2035
  • Figure 84: Middle East & Africa Market Y to o to Y Growth Comparison by System Type , 2025-2035
  • Figure 85: Middle East & Africa Market Attractiveness Analysis by System Type
  • Figure 86: Middle East & Africa Market Value Share and BPS Analysis by Technology, 2025 and 2035
  • Figure 87: Middle East & Africa Market Y to o to Y Growth Comparison by Technology, 2025-2035
  • Figure 88: Middle East & Africa Market Attractiveness Analysis by Technology
  • Figure 89: Middle East & Africa Market Value Share and BPS Analysis by Application, 2025 and 2035
  • Figure 90: Middle East & Africa Market Y to o to Y Growth Comparison by Application, 2025-2035
  • Figure 91: Middle East & Africa Market Attractiveness Analysis by Application
  • Figure 92: Global Market - Tier Structure Analysis
  • Figure 93: Global Market - Company Share Analysis
Dashboard
Dashboard
Dashboard
Dashboard
Dashboard
Dashboard

Full Research Suite comprises of:

Market outlook & trends analysis

Market outlook & trends analysis

Interviews & case studies

Interviews & case studies

Strategic recommendations

Strategic recommendations

Vendor profiles & capabilities analysis

Vendor profiles & capabilities analysis

5-year forecasts

5-year forecasts

8 regions and 60+ country-level data splits

8 regions and 60+ country-level data splits

Market segment data splits

Market segment data splits

12 months of continuous data updates

12 months of continuous data updates

DELIVERED AS:

PDF EXCEL ONLINE

Full Research Suite


$5000

$7500

$10000

Buy Report Now
Similar Industry Reports

Similar Industry Reports

Firefighter Tapes Market

Firefighter Tapes Market Size and Share Forecast Outlook 2025 to 2035

Fire Pump Test Meter Market

Fire Pump Test Meter Market Size and Share Forecast Outlook 2025 to 2035

Fire Protection Materials Market

Fire Protection Materials Market Size and Share Forecast Outlook 2025 to 2035

Fire Extinguisher Market

Fire Extinguisher Market Size and Share Forecast Outlook 2025 to 2035

Fire Stopping Material Market

Fire Stopping Material Market Size and Share Forecast Outlook 2025 to 2035

Fireproof Insulation Market

Fireproof Insulation Market Size and Share Forecast Outlook 2025 to 2035

Fire Tube Chemical Boiler Market

Fire Tube Chemical Boiler Market Size and Share Forecast Outlook 2025 to 2035

Firefighting Foam Market

Firefighting Foam Market Size and Share Forecast Outlook 2025 to 2035

Fire Resistant Cable Market

Fire Resistant Cable Market Size and Share Forecast Outlook 2025 to 2035

Fire Stopping Materials Market

Fire Stopping Materials Market Size and Share Forecast Outlook 2025 to 2035

Firefighting Drone Market

Firefighting Drone Market Size and Share Forecast Outlook 2025 to 2035

Fire Resistant Fabrics Market

Fire Resistant Fabrics Market Size and Share Forecast Outlook 2025 to 2035

Fire Door Market
Fire Door Market

Fire Door Market Size and Share Forecast Outlook 2025 to 2035

Fireclay Tiles Market

Fireclay Tiles Market Size and Share Forecast Outlook 2025 to 2035

Firearms Market
Firearms Market

Firearms Market Size and Share Forecast Outlook 2025 to 2035

Fire-resistant Paint Market

Fire-resistant Paint Market Size and Share Forecast Outlook 2025 to 2035

Fire Collar Market
Fire Collar Market

Fire Collar Market Size and Share Forecast Outlook 2025 to 2035

Fire Protective Materials Market

Fire Protective Materials Market Size and Share Forecast Outlook 2025 to 2035

Fire And Explosion Proof Lights Market

Fire And Explosion Proof Lights Market Size and Share Forecast Outlook 2025 to 2035

Fire Retardant Coatings Market

Fire Retardant Coatings Market Size and Share Forecast Outlook 2025 to 2035

Future Market Insights

Fire Sprinkler System Market

Chat With MaRIA

Chat With

MaRIA

Hi There, I am MaRIA, Your Market Research Intelligence Assistant. How may I help you?