The Fire Resistant Fabrics Market is estimated to be valued at USD 3.7 billion in 2025 and is projected to reach USD 6.9 billion by 2035, registering a compound annual growth rate (CAGR) of 6.3% over the forecast period.
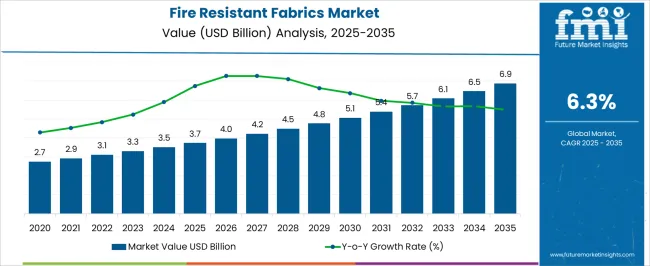
| Metric | Value |
|---|---|
| Fire Resistant Fabrics Market Estimated Value in (2025 E) | USD 3.7 billion |
| Fire Resistant Fabrics Market Forecast Value in (2035 F) | USD 6.9 billion |
| Forecast CAGR (2025 to 2035) | 6.3% |
The fire resistant fabrics market is witnessing robust growth driven by increasing safety regulations, industrial risk management, and heightened awareness regarding protective clothing in hazardous environments. Rising adoption across manufacturing, oil and gas, construction, and defense sectors is reinforcing the demand for fabrics that combine durability with thermal protection.
Advancements in textile engineering have enabled the development of fabrics that not only resist ignition but also provide comfort, breathability, and moisture management, supporting widespread industrial use. The integration of innovative chemical treatments and advanced fiber blends is enhancing fabric performance while meeting stringent compliance requirements.
Global emphasis on occupational safety, combined with rising worker protection initiatives and corporate responsibility standards, is shaping future growth prospects. The outlook remains strong as industries continue prioritizing workforce safety and regulatory compliance while adopting advanced protective textiles.
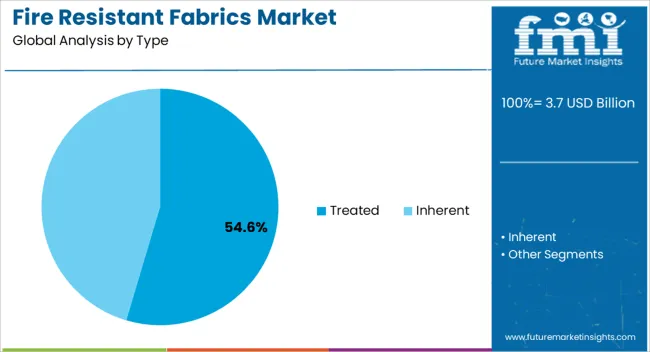
The treated type segment is expected to represent 54.60% of the total market revenue by 2025 within the type category, making it the leading segment. Its dominance is attributed to cost efficiency, wide availability, and the ability to impart fire resistance to conventional fabrics through chemical finishing.
Treated fabrics are extensively adopted in industrial uniforms, protective gear, and apparel due to their balance of performance and affordability. Continuous improvements in treatment processes have enhanced durability and wash resistance, ensuring long term effectiveness.
The scalability of production and ease of integration across diverse applications have further strengthened the position of treated fabrics in the market.
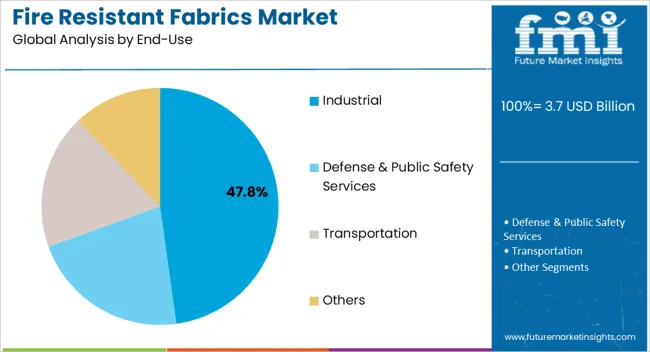
The industrial end use segment is expected to contribute 47.80% of total revenue by 2025, making it the leading segment under end use. Growth in this segment is fueled by stringent workplace safety regulations, increased accident prevention initiatives, and the rising need for thermal and fire protection in high risk industrial operations.
Industries such as oil and gas, manufacturing, and chemicals have intensified investment in protective fabrics to safeguard personnel and infrastructure.
The long service life, reliability, and compliance assurance of fire resistant fabrics have positioned them as essential components in industrial safety programs, ensuring this segment’s continued leadership.
| Attribute | Details |
|---|---|
| Historical CAGR (2020 to 2025) | 8.0% |
| Forecasted CAGR (2025 to 2035) | 6.3% |
The rapid growth of industries such as oil and gas, chemicals, and manufacturing has created a higher demand for fire-resistant fabrics. These industries often involve hazardous processes and materials, making fire-resistant fabrics crucial for worker safety.
Increasing awareness of the importance of workplace safety in organizations and individuals led to the adoption of fire-resistant fabrics in industries where workers are exposed to fire and heat-related risks.
The increasing research and development efforts by leading players have led to the development of advanced fire-resistant fabrics that offer improved protection, comfort, and durability. These technological advancements have expanded the range of applications for fire-resistant fabrics. The fire-resistant fabrics market is projected to show a noteworthy growth of USD 6.9 billion by the end of the forecast period of 2035.
Increasing Application in Defense and Public Safety Services to Drive the Growth of the Fire Resistant Fabrics Market
Fire-resistant fabrics play a critical role in defense and public safety applications by providing protection to personnel involved in various operations and emergency response scenarios.
Fire-resistant fabrics used in the defense industry are developed with properties such as flame resistance, heat insulation, durability, and comfort to ensure the safety and performance of personnel in challenging and hazardous situations. These fabrics provide protection against heat, flames, and arc flashes, minimizing the risk of injury and burns. As a result, they are highly utilized in the oil & gas industry, where the growing safety regulation standards further drive the demand for fire resistant fabrics.
The Growing Technological Advances to Boost the Growth of the Fire-Resistant Fabrics Market
Continuous advancements in fabric technologies have improved the performance and durability of fire-resistant fabrics. Innovations in flame retardant additives, weaving techniques, and fabric blends have resulted in fabrics that offer enhanced fire resistance while maintaining comfort and durability. Technological advancements in the field drive market growth by expanding the applications of fire-resistant fabrics.
Manufacturers of fire-resistant fabrics continue to invest in research and development to enhance the performance of their products. Innovations include the development of fabrics with improved flame resistance, heat insulation properties, and durability. For instance, advancements in aramid fibers, such as Nomex® and Kevlar®, have led to the production of fabrics that offer superior fire resistance and strength.
High Cost of Fire-Resistant Fabrics to Impede the Market Growth
Although the fire-resistant fabrics market has numerous end-user, there are some obstacles that are likely to pose a challenge to market growth during the forecast period. The fluctuating prices of raw materials and high costs associated with fire-resistant fabrics are expected to impede market growth.
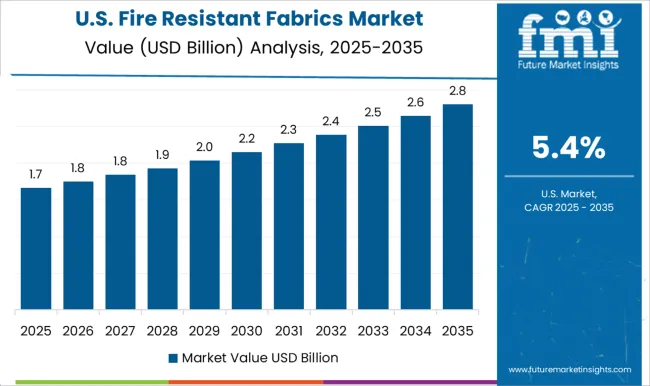
Growing Innovations in Manufacturing Techniques to Boost the Growth of the Fire Resistant Fabrics Market in the United States
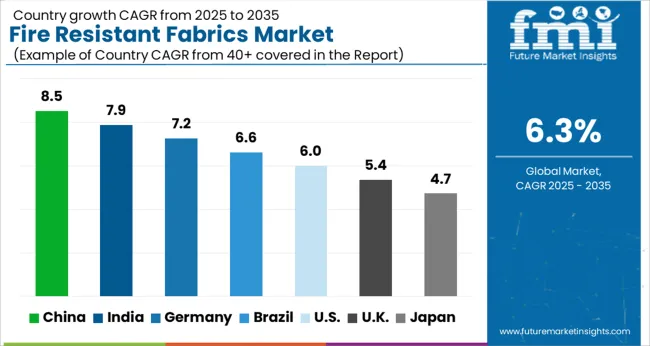
The global fire-resistant fabrics market is expected to be dominated by North America. The US market is anticipated to expand at a CAGR of 6.2% and is expected to accumulate a market value of USD 1.1 billion over the forecast period. The increasing focus on worker safety and stringent safety regulations in the region are expected to propel the market demand.
The increasing technological advancements and innovation in various sectors and the development of advanced fire-resistant fabric technologies. Manufacturers in the region are investing in research and development to improve the performance, comfort, and durability of fire-resistant fabrics, catering to the specific needs of industries in North America
Owing to the sustainability concerns in the region manufacturers are focusing on developing fabrics that use recycled fibers, bio-based materials, and environmentally friendly manufacturing processes.
Increasing Application in Oil & Gas in the Region to Boost the Growth of the Market in the United Kingdom
Fire resistant fabrics sales in the United Kingdom are expected to keep rising with a CAGR of 6.0% and are expected to gain a market value of USD 217.4 million by the end of the forecast period. The growing Oil and Gas Industry in the region is a major consumer of fire-resistant fabrics.
High safety standards and regulations in diverse industries such as automotive, oil and gas, construction, and manufacturing led to the adoption of fire-resistant fabrics for worker protection.
European Union (EU) has implemented regulations such as the Personal Protective Equipment (PPE) Directive and the REACH regulation, which govern the use and production of fire-resistant fabrics. Compliance with these regulations drives the demand for fire-resistant fabrics in Europe
Rapid Industrialization to Drive the Growth of the Market in China
China’s fire-resistant fabrics market is expected to rise at 6.2% CAGR between 2025 to 2035. The market is expected to gain a market value of USD 1.4 billion by the end of the forecast period. China accounts for the highest market share in the fire-resistant fabrics market.
China's energy sector, including oil and gas, coal, and power generation, is expanding rapidly. Fire-resistant fabrics are extensively used in these sectors to protect workers and facilities. Additionally, the transportation sector, including railways and automotive, demands fire-resistant fabrics for applications such as seating, interiors, and protective clothing.
Treated Segment to Gain Significant Traction During the Forecast Period
Based on type, the fire-resistant fabrics market is segmented into treated & inherent, segments. The treated segment is expected to dominate the market in the forecast period. The segment is projected to exhibit a CAGR of 6.2% during the forecast period.
Treated fire-resistant fabrics are typically treated with flame-retardant chemicals, which are substances that inhibit or delay the ignition and spread of flames. Common flame retardant chemicals used in the treatment process include phosphorous-based compounds, halogen-based compounds, and nitrogen-based compounds.
Apparel Segment Generates High Revenue
Based on the application, the market is segmented into the apparel & non-apparel segments. Among all these apparel segments remains the application category is expected to expand with a CAGR of 6.0% throughout the forecast period.
Fire-resistant fabrics are widely used in the production of protective apparel to ensure the safety of individuals working in industries where exposure to fire, heat, and flames is a risk. These garments are widely used in industries where workers are exposed to potential fire-related risks, such as firefighting, oil and gas, military, and industrial sectors.
New players in the fire-resistant fabrics market PyroTex, Pvilion, and Basofi fibers among others are adopting various marketing strategies such as new product launches, geographical expansion, mergers and acquisitions, partnerships, and collaboration to identify the interest of potential buyers and create a larger customer base.
For instance:
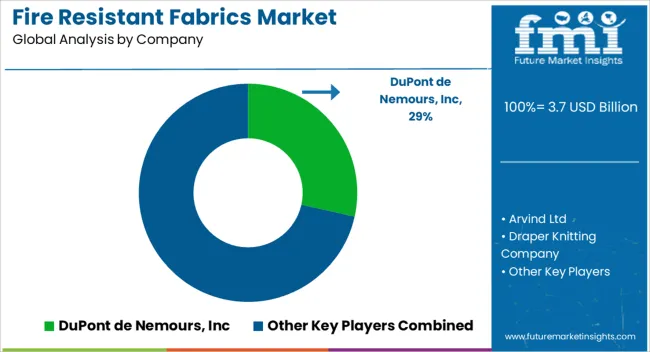
Prominent players in the fire-resistant fabrics market are DuPont de Nemours, Inc.; Arvind Ltd.; Draper Knitting Company; BGF Industries, Inc.; Agru America, Inc.; among others.
The key players in fire-resistant fabrics are focusing on improved productivity and quality of their products in order to gain more customer base. Key players are working on research & development activities for the effective composition of the material that is to be used for manufacturing.
Other expansion strategies of key players include extensive research & development activities, collaborations, and mergers & acquisitions. Some notable developments are as follows:
| Report Attribute | Details |
|---|---|
| Growth Rate | CAGR of 6.3% from 2025 to2035 |
| Market Value in 2025 | USD 3.7 billion |
| Market Value in 2035 | USD 6.9 billion |
| Base Year for Estimation | 2025 |
| Historical Data | 2020 to 2025 |
| Forecast Period | 2025 to 2035 |
| Quantitative Units | Revenue in USD Billion and CAGR from 2025 to 2035 |
| Report Coverage | Revenue Forecast, Company Ranking, Competitive Landscape, Growth Factors, Trends, and Pricing Analysis |
| Segments Covered | Type, Application, End-use, Region |
| Regions Covered | North America; Latin America; Europe; Asia Pacific; Middle East and Africa |
| Key Countries Profiled | United States, Canada, Brazil, Mexico, Germany, United Kingdom, France, Spain, Italy, China, Japan, South Korea, Singapore, Thailand, Indonesia, Australia, New Zealand, GCC, South Africa, Israel |
| Key Companies Profiled | DuPont de Nemours Inc.; Arvind Ltd.; Draper Knitting Company; BGF Industries, Inc.; Agru America, Inc.; |
The global fire resistant fabrics market is estimated to be valued at USD 3.7 billion in 2025.
The market size for the fire resistant fabrics market is projected to reach USD 6.9 billion by 2035.
The fire resistant fabrics market is expected to grow at a 6.3% CAGR between 2025 and 2035.
The key product types in fire resistant fabrics market are treated and inherent.
In terms of application, apparel segment to command 62.3% share in the fire resistant fabrics market in 2025.


Our Research Products

The "Full Research Suite" delivers actionable market intel, deep dives on markets or technologies, so clients act faster, cut risk, and unlock growth.

The Leaderboard benchmarks and ranks top vendors, classifying them as Established Leaders, Leading Challengers, or Disruptors & Challengers.

Locates where complements amplify value and substitutes erode it, forecasting net impact by horizon

We deliver granular, decision-grade intel: market sizing, 5-year forecasts, pricing, adoption, usage, revenue, and operational KPIs—plus competitor tracking, regulation, and value chains—across 60 countries broadly.

Spot the shifts before they hit your P&L. We track inflection points, adoption curves, pricing moves, and ecosystem plays to show where demand is heading, why it is changing, and what to do next across high-growth markets and disruptive tech

Real-time reads of user behavior. We track shifting priorities, perceptions of today’s and next-gen services, and provider experience, then pace how fast tech moves from trial to adoption, blending buyer, consumer, and channel inputs with social signals (#WhySwitch, #UX).

Partner with our analyst team to build a custom report designed around your business priorities. From analysing market trends to assessing competitors or crafting bespoke datasets, we tailor insights to your needs.
Supplier Intelligence
Discovery & Profiling
Capacity & Footprint
Performance & Risk
Compliance & Governance
Commercial Readiness
Who Supplies Whom
Scorecards & Shortlists
Playbooks & Docs
Category Intelligence
Definition & Scope
Demand & Use Cases
Cost Drivers
Market Structure
Supply Chain Map
Trade & Policy
Operating Norms
Deliverables
Buyer Intelligence
Account Basics
Spend & Scope
Procurement Model
Vendor Requirements
Terms & Policies
Entry Strategy
Pain Points & Triggers
Outputs
Pricing Analysis
Benchmarks
Trends
Should-Cost
Indexation
Landed Cost
Commercial Terms
Deliverables
Brand Analysis
Positioning & Value Prop
Share & Presence
Customer Evidence
Go-to-Market
Digital & Reputation
Compliance & Trust
KPIs & Gaps
Outputs
Full Research Suite comprises of:
Market outlook & trends analysis
Interviews & case studies
Strategic recommendations
Vendor profiles & capabilities analysis
5-year forecasts
8 regions and 60+ country-level data splits
Market segment data splits
12 months of continuous data updates
DELIVERED AS:
PDF EXCEL ONLINE
Fire Resistant Apron Market Size and Share Forecast Outlook 2025 to 2035
Fire Resistant Cable Market Size and Share Forecast Outlook 2025 to 2035
Fire-resistant Paint Market Size and Share Forecast Outlook 2025 to 2035
Fire Resistant Hydraulic Fluid Market Growth – Trends & Forecast 2024-2034
Fire Resistant Fluids Market
Fire Retardant Fabrics Market - Growth & Demand 2025 to 2035
Flame Resistant Fabrics Market Size and Share Forecast Outlook 2025 to 2035
Chemical Resistant Fabrics Market Size and Share Forecast Outlook 2025 to 2035
Firefighter Tapes Market Size and Share Forecast Outlook 2025 to 2035
Fire Pump Test Meter Market Size and Share Forecast Outlook 2025 to 2035
Fire Sprinkler System Market Size and Share Forecast Outlook 2025 to 2035
Fire Protection Materials Market Size and Share Forecast Outlook 2025 to 2035
Fire Extinguisher Market Size and Share Forecast Outlook 2025 to 2035
Fire Stopping Material Market Size and Share Forecast Outlook 2025 to 2035
Fireproof Insulation Market Size and Share Forecast Outlook 2025 to 2035
Fire Tube Chemical Boiler Market Size and Share Forecast Outlook 2025 to 2035
Firefighting Foam Market Size and Share Forecast Outlook 2025 to 2035
Fire Suppression System Market Size and Share Forecast Outlook 2025 to 2035
Fire Protection System Pipes Market Size and Share Forecast Outlook 2025 to 2035
Fire Stopping Materials Market Size and Share Forecast Outlook 2025 to 2035

Thank you!
You will receive an email from our Business Development Manager. Please be sure to check your SPAM/JUNK folder too.
Chat With
MaRIA