Flame Retardant Chemicals Market Outlook (2022 to 2032)

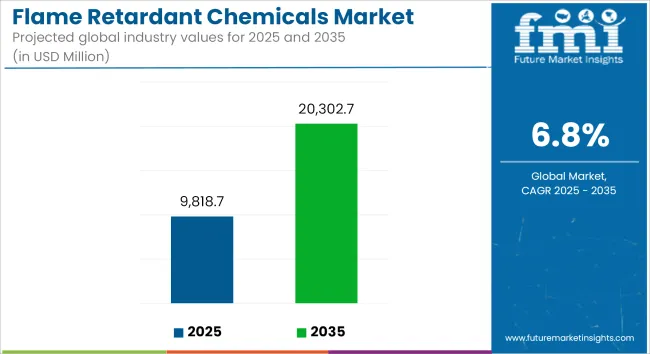
The global flame retardant chemicals market size is anticipated to be worth US$ 8,560 Million in 2022. During the projection period of 2022 to 2032, the market is predicted to grow at a CAGR of 7.1%, with a valuation of US$ 16,990 Million by 2032. Key factors propelling the market growth include:

  • Flame suppressants put out fires by interacting with the gaseous phase of the fire cycle and putting an end to chemical chain reactions.
  • The market is growing primarily as a result of expanding end-use industries and stricter fire safety standards.
  • The demand for flame retardants is rising as more industries seek to eliminate fire-related risks.
  • Explosions and fire-related catastrophes are more likely now that there are more residential and commercial buildings. Due to this, several nations in North America and Europe have imposed stringent fire safety laws and procedures.
  • Strict fire safety regulations are likely to result in a rise in the demand for flame retardants across a variety of applications.

Due to the rising consumer demand for houses, gadgets, and cars, organizations like the International Code Council and the National Fire Protection Association (NFPA) have developed fire safety laws. To boost halogen-free flame retardants (HFFRs) and smoke suppressants, the EU introduced the green agreement in October 2020, followed by the chemical strategy for sustainability.

Attributes Details
Flame Retardant Chemicals Market Value (2022) US$ 8,560 Million
Flame Retardant Chemicals Market Forecast Value (2032) US$ 16,990 Million
Flame Retardant Chemicals Market CAGR (2022 to 2032) 7.1%

Don't pay for what you don't need

Customize your report by selecting specific countries or regions and save 30%!

Latest Trends Followed by Flame Retardant Chemicals Manufacturers

Manufacturers are required to abide by certain strict fire safety regulations in end-use sectors including building & construction, automotive, and electronics. Additionally, the market for flame retardants is being further stimulated by the expanding usage of plastic in every industry due to its advantageous properties. Environmental and health issues that limit the use of traditional flame retardants like brominated and chlorinated flame retardants are the main factors limiting the market growth. This factor has increased demand for more environmentally friendly flame retardants, such as nitrogen and phosphorous. Rapid economic growth in nations like China, Mexico, and India is likely to help fuel the market throughout the projection period.

Development of More Potent Synergist Chemicals is a Lucrative Growth Opportunity for Players

Compounds including bromine, nitrogen, phosphorus, and zinc are added to the polymer blends in greater quantities to improve the effectiveness of flame retardants. Mineral fillers with large loadings tend to reduce the characteristics of flame retardants when applied to them. Synergist compounds with polymer blends are developed as a solution to this problem, helping to improve the effectiveness of flame retardants. It is discovered that the impact is more effective when such mixes are combined in a polymer matrix than when chemicals operate alone. Synergist blends to increase the retardant qualities while halogenated flame retardants are reduced in weight, toxicity, and quantity.

Nikhil Kaitwade
Nikhil Kaitwade

Principal Consultant

Talk to Analyst

Find your sweet spots for generating winning opportunities in this market.

Challenges for Players in the Flame Retardant Chemicals Industry

A major challenge for manufacturers includes changing the characteristics of finished products due to high loading levels of flame retardants derived from minerals. The high loading levels connected with flame retardants based on minerals are one of their main downsides. Mineral fillers that are ecologically safe and endothermically decomposable include aluminum, magnesium hydroxide, and magnesium carbonate.

To guarantee flame retardancy, flame retardants employed as fillers are placed heavily into the polymer matrix. When utilized as flame retardants, these minerals need greater loadings of up to 65%. However, the final product's mechanical qualities (thermal stability) are decreased and its density is increased due to the excessive loading of mineral fillers. The market expansion of flame retardants may be constrained by this decreased feature of these chemicals.

How is the Flame Retardant Chemicals Market Segmented?

Fire-resistant chemicals are projected to be used more frequently because they play an important role in decreasing the general danger of fire-related use of highly combustible feedstock in goods such as textiles, apparel, composites, and plastics.

The flame retardant chemicals market can be segmented based on their application in the end-user industries such as automotive, construction, textiles, electronics and electrical industry, and others.

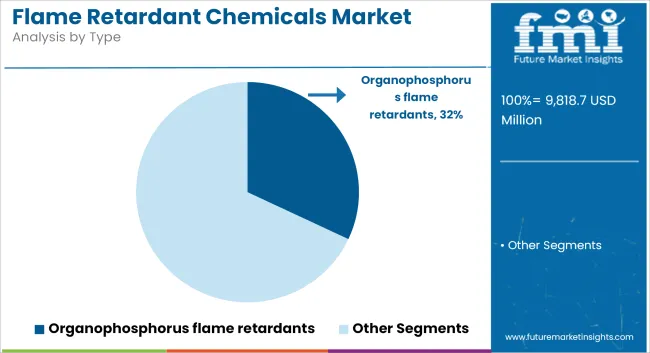
On the other hand, the flame retardant chemicals market, based on the type of chemicals, is segmented as chlorinated flame retardant, boric acid flame retardant, brominated fire retardant, organophosphorus based flame retardant, ammonium phosphate fire retardant, nitrogen flame retardant, antimony oxide, Aluminium hydroxide fire retardant, and other flame retardants.

Get the data you need at a Fraction of the cost

Personalize your report by choosing insights you need
and save 40%!

Which is the Leading Region in the Flame Retardant Chemicals Market?

Asia Pacific is a major electrical and electronics center, with the biggest flame retardant market share. The presence of significant electronics industries, as well as increased construction activity, will drive the market in this region.

Based on the regions of the world, the Flame Retardant Chemicals market can be segmented into Asia-Pacific region, North America, Western Europe, Eastern Europe, Japan and the Middle East, and Africa.

The flame retardant chemicals market is expected to witness moderate single-digit growth in the next five years.

Among the regional segments, Asia-Pacific accounts for the largest share of the global flame retardant chemicals market with China accounting for a large chunk of demand, Asia-Pacific is followed by North America.

The growth of end-user industries especially in the Asia-Pacific region has led to significant growth in the global flame retardant chemicals market.

What are the Factors Impacting the Growth of the Flame Retardant Chemicals Market?

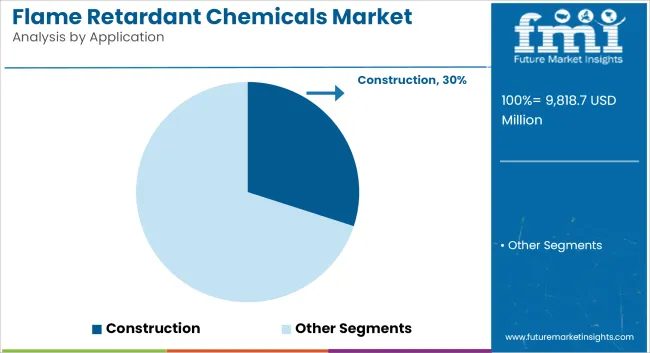
Due to increased construction activity around the world, the building and construction segment is likely to dominate the flame retardant chemicals market and rise during the forecast period.

The growth of the construction industry which employs flame retardants in insulation materials, paints and coatings, and other materials, the growth of the automotive and electronics industry, and other emerging application segments are expected to drive the growth of the flame retardant chemicals market.

The regulations pertaining to safety standards as regards fire safety in the end-user industries have led to a significant increase in demand over the past few years in the global flame retardant chemicals market.

The growth of the flame retardant chemicals market is however dependent on the price of feedstock or the raw materials required for producing these chemicals.

Some of the flame retardant chemicals are harmful to the environment and have led to a reduction in their use worldwide this has also led to the development of eco-friendly flame retardant chemicals which are expected to gain a foothold in the global flame retardant chemicals market and in turn drive the growth of the flame retardant chemicals market.

The detrimental effects of halogenated flame retardants on persons and the environment have greatly slowed the expansion of halogenated flame retardants such as brominated, chlorinated, and others. Certain chemicals, such as hexabromocyclododecane (HBCD), are prohibited in the European Union, Japan, and Canada.

This has significantly fuelled the demand for safer and environmentally friendly flame retardants, such as phosphorous, bromine, and chlorine-based non-halogenated flame retardants. As it supports environmental sustainability, the shifting trend toward the replacement of halogenated flame retardants has primarily pushed innovation for new halogen-free flame retardants.

The majority of the demand is predicted to come from applications such as polyolefins, epoxy flame retardant, and polyvinyl chloride (PVC).

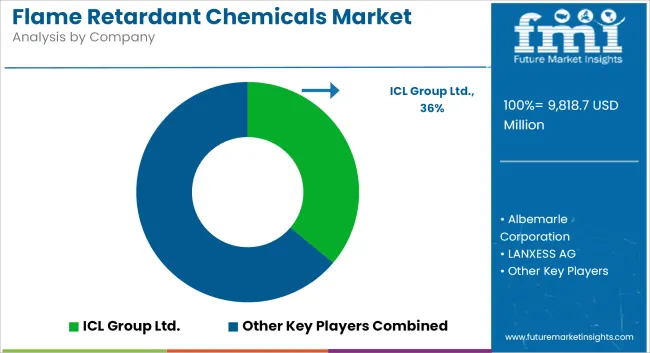
The major players in the flame retardant chemicals market are Clariant, BASF, Chemtura, AkzoNobel, Ciba specialty chemicals, Lanxess AG, and Bayer Material Science among others.

These key players are incrementally shifting their focus towards halogen-free flame retardants and non-toxic flame retardants.

Scope Of Report

Attributes Details
Forecast Period 2022 to 2032
Historical Data Available For 2014 to 2020
Market Analysis US$ Million for Value
By Type Chlorinated flame retardants, Brominated flame retardants, Organophosphorus flame retardants, Nitrogen flame retardants, Antimony oxide, Aluminum hydroxide
By Application Automotive, Construction, Textiles, Electronics, Electrical industry
By Region North America; Latin America; Asia Pacific; Japan; Western Europe; Eastern Europe; Middle East & Africa
Key Players Clariant; BASF; Chemtura; AkzoNobel; Ciba specialty chemicals; Lanxess AG; Bayer Material Science

Key Segments

By Type:

  • Chlorinated flame retardants
  • Brominated flame retardants
  • Organophosphorus flame retardants
  • Nitrogen flame retardants
  • Antimony oxide
  • Aluminum hydroxide

By Application:

  • Automotive
  • Construction
  • Textiles
  • Electronics
  • Electrical industry

By Region:

  • North America
  • Latin America
  • Asia Pacific
  • Japan
  • Western Europe
  • Eastern Europe
  • Middle East & Africa

Frequently Asked Questions

What is the Growth Outlook for the Flame Retardant Chemicals Market?

The flame retardant chemicals market is projected to reach a CAGR of 7.1% during the forecast period.

What was the Size of the Flame Retardant Chemicals Market in 2020?

The flame retardant chemicals market held a valuation of US$ 7.46 Billion in 2020.

Which is the fastest growing region in the Flame Retardant Chemicals market?

Asia Pacific accounted for more than 55% of the global market's revenue, and it is expected to grow at the quickest CAGR during the forecast period.

Which segment has the highest potential in the Flame Retardant Chemicals market?

The rising use of polyolefins as plastics in a wide variety of applications led to this segment's dominance of the market in 2020, when it accounted for 26.13 percent of total market revenue.

What is a key driver of the Flame Retardant Chemicals market?

Rising end-use industries and stricter fire safety standards are driving the market forward.

Table of Content
1. Executive Summary | Flame Retardant Chemicals Market
    1.1. Global Market Outlook
    1.2. Demand-side Trends
    1.3. Supply-side Trends
    1.4. Technology Roadmap Analysis
    1.5. Analysis and Recommendations
2. Market Overview
    2.1. Market Coverage / Taxonomy
    2.2. Market Definition / Scope / Limitations
3. Market Background
    3.1. Market Dynamics
        3.1.1. Drivers
        3.1.2. Restraints
        3.1.3. Opportunity
        3.1.4. Trends
    3.2. Scenario Forecast
        3.2.1. Demand in Optimistic Scenario
        3.2.2. Demand in Likely Scenario
        3.2.3. Demand in Conservative Scenario
    3.3. Opportunity Map Analysis
    3.4. Product Life Cycle Analysis
    3.5. Supply Chain Analysis
        3.5.1. Supply Side Participants and Their Roles
            3.5.1.1. Producers
            3.5.1.2. Mid-Level Participants (Traders/ Agents/ Brokers)
            3.5.1.3. Wholesalers and Distributors
        3.5.2. Value Added and Value Created at Node in the Supply Chain
        3.5.3. List of Raw Material Suppliers
        3.5.4. List of Existing and Potential Buyers
    3.6. Investment Feasibility Matrix
    3.7. Value Chain Analysis
        3.7.1. Profit Margin Analysis
        3.7.2. Wholesalers and Distributors
        3.7.3. Retailers
    3.8. PESTLE and Porter's Analysis
    3.9. Regulatory Landscape
        3.9.1. By Key Regions
        3.9.2. By Key Countries
    3.10. Regional Parent Market Outlook
    3.11. Production and Consumption Statistics
    3.12. Import and Export Statistics
4. Global Market Analysis 2017 to 2021 and Forecast, 2022 to 2032
    4.1. Historical Market Size Value (US$ Million) & Volume (Tons) Analysis, 2017 to 2021
    4.2. Current and Future Market Size Value (US$ Million) & Volume (Tons) Projections, 2022 to 2032
        4.2.1. Y-o-Y Growth Trend Analysis
        4.2.2. Absolute $ Opportunity Analysis
5. Global Market Analysis 2017 to 2021 and Forecast 2022 to 2032, By Product Type
    5.1. Introduction / Key Findings
    5.2. Historical Market Size Value (US$ Million) & Volume (Tons) Analysis By Product Type, 2017 to 2021
    5.3. Current and Future Market Size Value (US$ Million) & Volume (Tons) Analysis and Forecast By Product Type, 2022 to 2032
        5.3.1. Alumina Trihydrate
        5.3.2. Antimony Oxide
        5.3.3. Bromine Based Compounds
        5.3.4. Chlorinated Compounds
        5.3.5. Boron-Based Compounds
        5.3.6. Organophosphorus
        5.3.7. Others
    5.4. Y-o-Y Growth Trend Analysis By Product Type, 2017 to 2021
    5.5. Absolute $ Opportunity Analysis By Product Type, 2022 to 2032 Deep-dive segmentation will be available in the sample on request
6. Global Market Analysis 2017 to 2021 and Forecast 2022 to 2032, By End-Use
    6.1. Introduction / Key Findings
    6.2. Historical Market Size Value (US$ Million) & Volume (Tons) Analysis By End-Use, 2017 to 2021
    6.3. Current and Future Market Size Value (US$ Million) & Volume (Tons) Analysis and Forecast By End-Use, 2022 to 2032
        6.3.1. Building & Construction
        6.3.2. Electronics
        6.3.3. Electricals
        6.3.4. Automotive
    6.4. Y-o-Y Growth Trend Analysis By End-Use, 2017 to 2021
    6.5. Absolute $ Opportunity Analysis By End-Use, 2022 to 2032 Deep-dive segmentation will be available in the sample on request
7. Global Market Analysis 2017 to 2021 and Forecast 2022 to 2032, By Region
    7.1. Introduction
    7.2. Historical Market Size Value (US$ Million) & Volume (Tons) Analysis By Region, 2017 to 2021
    7.3. Current Market Size Value (US$ Million) & Volume (Tons) Analysis and Forecast By Region, 2022 to 2032
        7.3.1. North America
        7.3.2. Latin America
        7.3.3. Europe
        7.3.4. East Asia
        7.3.5. South Asia & Pacific
        7.3.6. Middle East and Africa
    7.4. Market Attractiveness Analysis By Region
8. North America Market Analysis 2017 to 2021 and Forecast 2022 to 2032, By Country
    8.1. Historical Market Size Value (US$ Million) & Volume (Tons) Trend Analysis By Market Taxonomy, 2017 to 2021
    8.2. Market Size Value (US$ Million) & Volume (Tons) Forecast By Market Taxonomy, 2022 to 2032
        8.2.1. By Country
            8.2.1.1. USA
            8.2.1.2. Canada
        8.2.2. By Product Type
        8.2.3. By End-Use
    8.3. Market Attractiveness Analysis
        8.3.1. By Country
        8.3.2. By Product Type
        8.3.3. By End-Use
    8.4. Key Takeaways
9. Latin America Market Analysis 2017 to 2021 and Forecast 2022 to 2032, By Country
    9.1. Historical Market Size Value (US$ Million) & Volume (Tons) Trend Analysis By Market Taxonomy, 2017 to 2021
    9.2. Market Size Value (US$ Million) & Volume (Tons) Forecast By Market Taxonomy, 2022 to 2032
        9.2.1. By Country
            9.2.1.1. Brazil
            9.2.1.2. Mexico
            9.2.1.3. Rest of Latin America
        9.2.2. By Product Type
        9.2.3. By End-Use
    9.3. Market Attractiveness Analysis
        9.3.1. By Country
        9.3.2. By Product Type
        9.3.3. By End-Use
    9.4. Key Takeaways
10. Europe Market Analysis 2017 to 2021 and Forecast 2022 to 2032, By Country
    10.1. Historical Market Size Value (US$ Million) & Volume (Tons) Trend Analysis By Market Taxonomy, 2017 to 2021
    10.2. Market Size Value (US$ Million) & Volume (Tons) Forecast By Market Taxonomy, 2022 to 2032
        10.2.1. By Country
            10.2.1.1. Germany
            10.2.1.2. United Kingdom
            10.2.1.3. France
            10.2.1.4. Spain
            10.2.1.5. Italy
            10.2.1.6. Rest of Europe
        10.2.2. By Product Type
        10.2.3. By End-Use
    10.3. Market Attractiveness Analysis
        10.3.1. By Country
        10.3.2. By Product Type
        10.3.3. By End-Use
    10.4. Key Takeaways
11. East Asia Market Analysis 2017 to 2021 and Forecast 2022 to 2032, By Country
    11.1. Historical Market Size Value (US$ Million) & Volume (Tons) Trend Analysis By Market Taxonomy, 2017 to 2021
    11.2. Market Size Value (US$ Million) & Volume (Tons) Forecast By Market Taxonomy, 2022 to 2032
        11.2.1. By Country
            11.2.1.1. China
            11.2.1.2. Japan
            11.2.1.3. South Korea
        11.2.2. By Product Type
        11.2.3. By End-Use
    11.3. Market Attractiveness Analysis
        11.3.1. By Country
        11.3.2. By Product Type
        11.3.3. By End-Use
    11.4. Key Takeaways
12. South Asia & Pacific Market Analysis 2017 to 2021 and Forecast 2022 to 2032, By Country
    12.1. Historical Market Size Value (US$ Million) & Volume (Tons) Trend Analysis By Market Taxonomy, 2017 to 2021
    12.2. Market Size Value (US$ Million) & Volume (Tons) Forecast By Market Taxonomy, 2022 to 2032
        12.2.1. By Country
            12.2.1.1. India
            12.2.1.2. Thailand
            12.2.1.3. Indonesia
            12.2.1.4. Malaysia
            12.2.1.5. Singapore
            12.2.1.6. Australia
            12.2.1.7. New Zealand
            12.2.1.8. Rest of South Asia & Pacific
        12.2.2. By Product Type
        12.2.3. By End-Use
    12.3. Market Attractiveness Analysis
        12.3.1. By Country
        12.3.2. By Product Type
        12.3.3. By End-Use
    12.4. Key Takeaways
13. Middle East and Africa Market Analysis 2017 to 2021 and Forecast 2022 to 2032, By Country
    13.1. Historical Market Size Value (US$ Million) & Volume (Tons) Trend Analysis By Market Taxonomy, 2017 to 2021
    13.2. Market Size Value (US$ Million) & Volume (Tons) Forecast By Market Taxonomy, 2022 to 2032
        13.2.1. By Country
            13.2.1.1. GCC Countries
            13.2.1.2. South Africa
            13.2.1.3. Israel
            13.2.1.4. Rest of Middle East and Africa
        13.2.2. By Product Type
        13.2.3. By End-Use
    13.3. Market Attractiveness Analysis
        13.3.1. By Country
        13.3.2. By Product Type
        13.3.3. By End-Use
    13.4. Key Takeaways
14. Key Countries Market Analysis
    14.1. USA
        14.1.1. Pricing Analysis
        14.1.2. Market Share Analysis, 2021
            14.1.2.1. By Product Type
            14.1.2.2. By End-Use
    14.2. Canada
        14.2.1. Pricing Analysis
        14.2.2. Market Share Analysis, 2021
            14.2.2.1. By Product Type
            14.2.2.2. By End-Use
    14.3. Brazil
        14.3.1. Pricing Analysis
        14.3.2. Market Share Analysis, 2021
            14.3.2.1. By Product Type
            14.3.2.2. By End-Use
    14.4. Mexico
        14.4.1. Pricing Analysis
        14.4.2. Market Share Analysis, 2021
            14.4.2.1. By Product Type
            14.4.2.2. By End-Use
    14.5. Germany
        14.5.1. Pricing Analysis
        14.5.2. Market Share Analysis, 2021
            14.5.2.1. By Product Type
            14.5.2.2. By End-Use
    14.6. United Kingdom
        14.6.1. Pricing Analysis
        14.6.2. Market Share Analysis, 2021
            14.6.2.1. By Product Type
            14.6.2.2. By End-Use
    14.7. France
        14.7.1. Pricing Analysis
        14.7.2. Market Share Analysis, 2021
            14.7.2.1. By Product Type
            14.7.2.2. By End-Use
    14.8. Spain
        14.8.1. Pricing Analysis
        14.8.2. Market Share Analysis, 2021
            14.8.2.1. By Product Type
            14.8.2.2. By End-Use
    14.9. Italy
        14.9.1. Pricing Analysis
        14.9.2. Market Share Analysis, 2021
            14.9.2.1. By Product Type
            14.9.2.2. By End-Use
    14.10. China
        14.10.1. Pricing Analysis
        14.10.2. Market Share Analysis, 2021
            14.10.2.1. By Product Type
            14.10.2.2. By End-Use
    14.11. Japan
        14.11.1. Pricing Analysis
        14.11.2. Market Share Analysis, 2021
            14.11.2.1. By Product Type
            14.11.2.2. By End-Use
    14.12. South Korea
        14.12.1. Pricing Analysis
        14.12.2. Market Share Analysis, 2021
            14.12.2.1. By Product Type
            14.12.2.2. By End-Use
    14.13. India
        14.13.1. Pricing Analysis
        14.13.2. Market Share Analysis, 2021
            14.13.2.1. By Product Type
            14.13.2.2. By End-Use
    14.14. Thailand
        14.14.1. Pricing Analysis
        14.14.2. Market Share Analysis, 2021
            14.14.2.1. By Product Type
            14.14.2.2. By End-Use
    14.15. Indonesia
        14.15.1. Pricing Analysis
        14.15.2. Market Share Analysis, 2021
            14.15.2.1. By Product Type
            14.15.2.2. By End-Use
    14.16. Malaysia
        14.16.1. Pricing Analysis
        14.16.2. Market Share Analysis, 2021
            14.16.2.1. By Product Type
            14.16.2.2. By End-Use
    14.17. Singapore
        14.17.1. Pricing Analysis
        14.17.2. Market Share Analysis, 2021
            14.17.2.1. By Product Type
            14.17.2.2. By End-Use
    14.18. Australia
        14.18.1. Pricing Analysis
        14.18.2. Market Share Analysis, 2021
            14.18.2.1. By Product Type
            14.18.2.2. By End-Use
    14.19. New Zealand
        14.19.1. Pricing Analysis
        14.19.2. Market Share Analysis, 2021
            14.19.2.1. By Product Type
            14.19.2.2. By End-Use
    14.20. GCC Countries
        14.20.1. Pricing Analysis
        14.20.2. Market Share Analysis, 2021
            14.20.2.1. By Product Type
            14.20.2.2. By End-Use
    14.21. South Africa
        14.21.1. Pricing Analysis
        14.21.2. Market Share Analysis, 2021
            14.21.2.1. By Product Type
            14.21.2.2. By End-Use
    14.22. Israel
        14.22.1. Pricing Analysis
        14.22.2. Market Share Analysis, 2021
            14.22.2.1. By Product Type
            14.22.2.2. By End-Use
15. Market Structure Analysis
    15.1. Competition Dashboard
    15.2. Competition Benchmarking
    15.3. Market Share Analysis of Top Players
        15.3.1. By Regional
        15.3.2. By Product Type
        15.3.3. By End-Use
16. Competition Analysis
    16.1. Competition Deep Dive
        16.1.1. AkzoNobel N.V.
            16.1.1.1. Overview
            16.1.1.2. Product Portfolio
            16.1.1.3. Profitability by Market Segments
            16.1.1.4. Sales Footprint
            16.1.1.5. Strategy Overview
                16.1.1.5.1. Marketing Strategy
                16.1.1.5.2. Product Strategy
                16.1.1.5.3. Channel Strategy
        16.1.2. Albemarle Corporation
            16.1.2.1. Overview
            16.1.2.2. Product Portfolio
            16.1.2.3. Profitability by Market Segments
            16.1.2.4. Sales Footprint
            16.1.2.5. Strategy Overview
                16.1.2.5.1. Marketing Strategy
                16.1.2.5.2. Product Strategy
                16.1.2.5.3. Channel Strategy
        16.1.3. BASF SE
            16.1.3.1. Overview
            16.1.3.2. Product Portfolio
            16.1.3.3. Profitability by Market Segments
            16.1.3.4. Sales Footprint
            16.1.3.5. Strategy Overview
                16.1.3.5.1. Marketing Strategy
                16.1.3.5.2. Product Strategy
                16.1.3.5.3. Channel Strategy
        16.1.4. Chemtura Corporation
            16.1.4.1. Overview
            16.1.4.2. Product Portfolio
            16.1.4.3. Profitability by Market Segments
            16.1.4.4. Sales Footprint
            16.1.4.5. Strategy Overview
                16.1.4.5.1. Marketing Strategy
                16.1.4.5.2. Product Strategy
                16.1.4.5.3. Channel Strategy
        16.1.5. Borealis GmbH
            16.1.5.1. Overview
            16.1.5.2. Product Portfolio
            16.1.5.3. Profitability by Market Segments
            16.1.5.4. Sales Footprint
            16.1.5.5. Strategy Overview
                16.1.5.5.1. Marketing Strategy
                16.1.5.5.2. Product Strategy
                16.1.5.5.3. Channel Strategy
        16.1.6. Clariant International Limited
            16.1.6.1. Overview
            16.1.6.2. Product Portfolio
            16.1.6.3. Profitability by Market Segments
            16.1.6.4. Sales Footprint
            16.1.6.5. Strategy Overview
                16.1.6.5.1. Marketing Strategy
                16.1.6.5.2. Product Strategy
                16.1.6.5.3. Channel Strategy
        16.1.7. Israel Chemicals Limited
            16.1.7.1. Overview
            16.1.7.2. Product Portfolio
            16.1.7.3. Profitability by Market Segments
            16.1.7.4. Sales Footprint
            16.1.7.5. Strategy Overview
                16.1.7.5.1. Marketing Strategy
                16.1.7.5.2. Product Strategy
                16.1.7.5.3. Channel Strategy
        16.1.8. Huber (JM) Corporation
            16.1.8.1. Overview
            16.1.8.2. Product Portfolio
            16.1.8.3. Profitability by Market Segments
            16.1.8.4. Sales Footprint
            16.1.8.5. Strategy Overview
                16.1.8.5.1. Marketing Strategy
                16.1.8.5.2. Product Strategy
                16.1.8.5.3. Channel Strategy
        16.1.9. Showa Denko KK
            16.1.9.1. Overview
            16.1.9.2. Product Portfolio
            16.1.9.3. Profitability by Market Segments
            16.1.9.4. Sales Footprint
            16.1.9.5. Strategy Overview
                16.1.9.5.1. Marketing Strategy
                16.1.9.5.2. Product Strategy
                16.1.9.5.3. Channel Strategy
        16.1.10. Almatis GmbH
            16.1.10.1. Overview
            16.1.10.2. Product Portfolio
            16.1.10.3. Profitability by Market Segments
            16.1.10.4. Sales Footprint
            16.1.10.5. Strategy Overview
                16.1.10.5.1. Marketing Strategy
                16.1.10.5.2. Product Strategy
                16.1.10.5.3. Channel Strategy
17. Assumptions & Acronyms Used
18. Research Methodology
Recommendations

Chemicals & Materials

Non-Halogenated Flame Retardants Market

October 2022

REP-GB-1165

235 pages

Chemicals & Materials

Flame Retardant Masterbatch Market

November 2024

REP-GB-10228

Upcoming

Explore Chemicals & Materials Insights

View Reports
Future Market Insights

Flame Retardant Chemicals Market

Schedule a Call