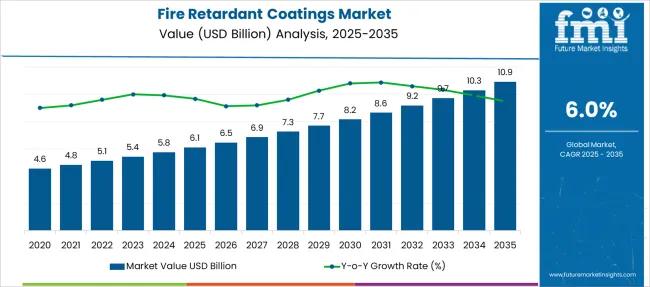
The fire retardant coatings market is likely to register a CAGR of 6% during the forecast period, and is anticipated to reach a market share of USD 9.17 Billion in 2032, from USD 4.83 Billion in 2021.
Due to the obvious rising infrastructure of the industrial and commercial sectors, as well as linked electric supplies and operations, such as fireplaces, where the risk of accidents is higher, there is a significant demand for fire retardant coatings.
Attributes | Details |
---|---|
Fire Retardant Coatings Market CAGR | 6% |
Fire Retardant Coatings Market Size (2021) | USD 4.83 billion |
Fire Retardant Coatings Market Size (2032) | USD 9.17 billion |
As consumers' need for fire protection is growing, demand for fire retardant coatings is mostly utilized to meet this requirement. Fire retardant coatings, which are easy to apply and help to stop the spread of fire on flammable and non-flammable objects, these features help in attractive sales of fire retardant coatings.
The demand for fire retardant coatings is appealing, as they function by suppressing the creation of gases created during the combustion process. Furthermore, fire retardant coatings had a low maintenance cost, which is one of the advantages factor for sales of fire retardant coatings in obtaining acceptance in a variety of end-use sectors.
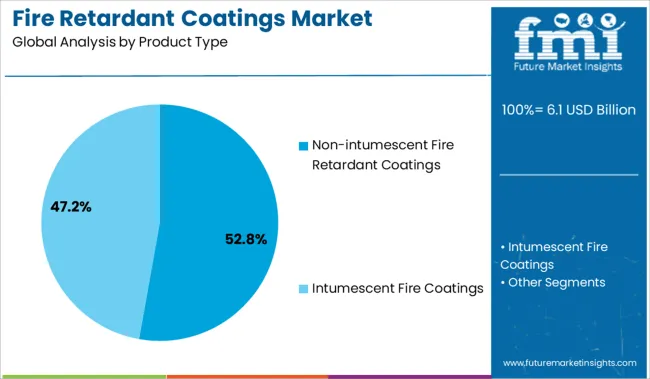
Various types of fire retardant coatings have been developed, depending on the base composition and substrate type, to fulfill the demand for fire retardant coatings. Further, by product type, the fire retardant coatings market has two types including non-intumescent and intumescent fire retardant coatings.
The fire retardant coatings find a wide range of applications in industrial, residential, and commercial sectors, expanding the sales of fire retardant coatings in all these sectors. Government agencies from various nations have set rules and regulations to prevent fire accidents around the world, making the adoption of fire retardant coatings a priority.
For example, the National Fire Protection Agency (NFPA) recently updated the rule NFPA 703, which governs the application of fire resistant coatings to building components. This has a positive impact on fire retardant coatings market share.
Due to the rising infrastructure of the industrial and commercial sectors, as well as connected electric supply and processes, such as fire places, where the risk of an accident is higher, the demand for fire retardant coatings has increased in recent years.
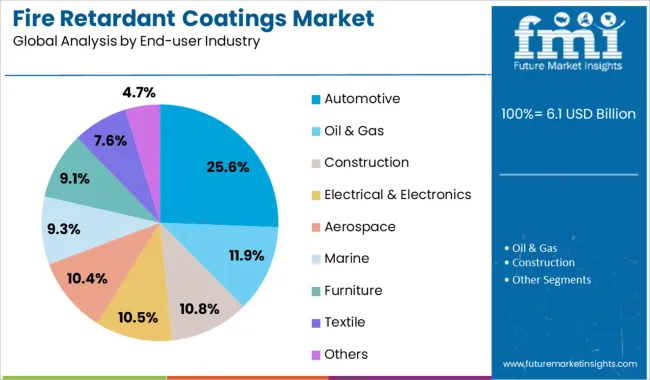
From the previous several years, the equipment utilized in manufacturing facilities such as the automobile, construction, and oil and gas industries has been prone to fire. In addition to statutory HSE (health, safety, and environmental management) standards, the sales of fire retardant coatings is quickly increasing across a wide range of end-use industries, allowing end users to profit from insurance claims in the case of a severe fire.
In addition, the demand for fire retardant coatings is becoming increasingly apparent in electronic and electrical items, whose internal circuitry is exposed to a high rate of heat. As a result, fire retardant coatings market outlook shows the profitable growth during a forecast period.
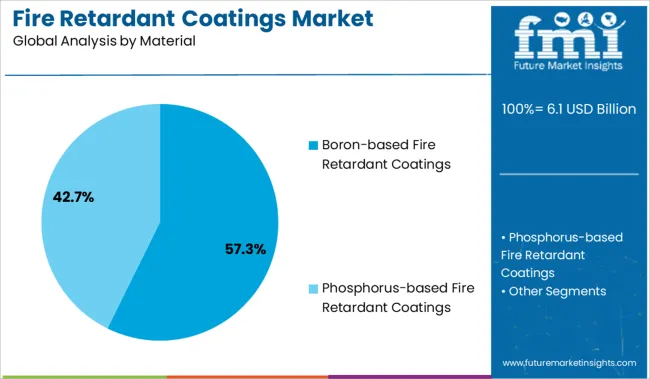
Fire retardant coatings market expands under the impact of heat to form a multicellular charred layer that works as an insulating barrier. Furthermore, the global fire retardant coatings market share is likely to be hampered by high inflation in raw material prices for fire retardant coatings.
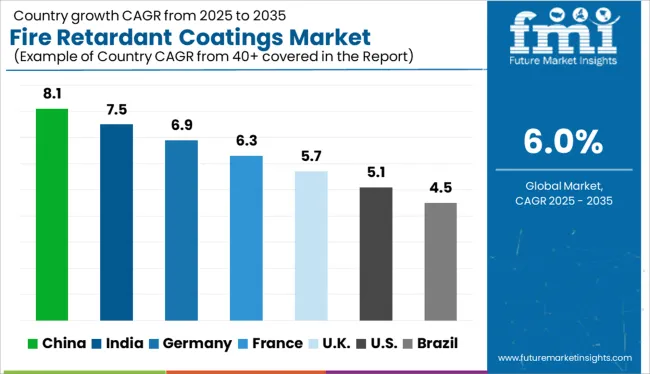
The global fire retardant coatings market can be divided into seven distinct regions. In developed economies, rapid industrialization and modernization will continue to drive the sales of fire retardant coatings expansion.
Due to rising industrial infrastructure and concern for safeguarding property and safeguards throughout the globe, areas such as Asia Pacific, Latin America, and MEA are expected to drive demand for fire retardant coatings during the projected period.
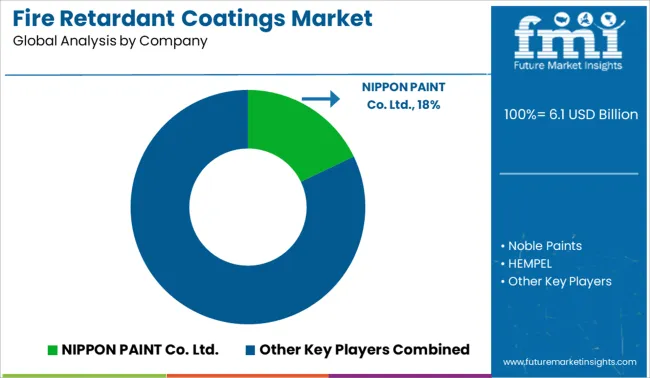
Few global fire retardant coatings market key players are NIPPON PAINT Co. Ltd.S, Noble Paints, Akzo Nobel, PPG Industries, HEMPEL, Carboline, Kansai Paints, Jotun, Promat International, Nullifire, GCC Applied Technologies, and Isolatek International.
These players are employing various strategies, such as mergers & acquisitions, partnerships, collaborations, etc., in order to consolidate their market position and augment the sales of fire retardant coatings.
Report Attribute | Details |
---|---|
Growth Rate | CAGR of 6% from 2022 to 2032 |
Base Year for Estimation | 2021 |
Historical Data | 2014 to 2020 |
Forecast Period | 2022 to 2032 |
Quantitative Units | Revenue in USD Billion, Volume in Kilotons and CAGR from 2022 to 2032 |
Report Coverage | Revenue Forecast, Volume Forecast, Company Ranking, Competitive Landscape, Growth Factors, Trends and Pricing Analysis |
Segments Covered | Application, Product Type, Material, End Use Industry, Region |
Regions Covered | North America; Latin America; Europe; South Asia; East Asia; Oceania; Middle East and Africa |
Key Countries Profiled | USA, Canada, Brazil, Argentina, Germany, UK, France, Spain, Italy, Nordics, BENELUX, Australia & New Zealand, China, India, ASEAN, GCC, South Africa |
Key Companies Profiled | NIPPON PAINT Co. Ltd.; Noble Paints, Akzo Nobel; PPG Industries; HEMPEL, Carboline; Kansai Paints; Jotun.; Promat International; Nullifire; GCC Applied Technologies; Isolatek International. |
Table 1: Global Market Value (US$ Mn) Forecast by Region, 2017-2032
Table 2: Global Market Volume (Litres) Forecast by Region, 2017-2032
Table 3: Global Market Value (US$ Mn) Forecast by Product Type, 2017-2032
Table 4: Global Market Volume (Litres) Forecast by Product Type, 2017-2032
Table 5: Global Market Value (US$ Mn) Forecast by Material, 2017-2032
Table 6: Global Market Volume (Litres) Forecast by Material, 2017-2032
Table 7: Global Market Value (US$ Mn) Forecast by End-user Industry, 2017-2032
Table 8: Global Market Volume (Litres) Forecast by End-user Industry, 2017-2032
Table 9: North America Market Value (US$ Mn) Forecast by Country, 2017-2032
Table 10: North America Market Volume (Litres) Forecast by Country, 2017-2032
Table 11: North America Market Value (US$ Mn) Forecast by Product Type, 2017-2032
Table 12: North America Market Volume (Litres) Forecast by Product Type, 2017-2032
Table 13: North America Market Value (US$ Mn) Forecast by Material, 2017-2032
Table 14: North America Market Volume (Litres) Forecast by Material, 2017-2032
Table 15: North America Market Value (US$ Mn) Forecast by End-user Industry, 2017-2032
Table 16: North America Market Volume (Litres) Forecast by End-user Industry, 2017-2032
Table 17: Latin America Market Value (US$ Mn) Forecast by Country, 2017-2032
Table 18: Latin America Market Volume (Litres) Forecast by Country, 2017-2032
Table 19: Latin America Market Value (US$ Mn) Forecast by Product Type, 2017-2032
Table 20: Latin America Market Volume (Litres) Forecast by Product Type, 2017-2032
Table 21: Latin America Market Value (US$ Mn) Forecast by Material, 2017-2032
Table 22: Latin America Market Volume (Litres) Forecast by Material, 2017-2032
Table 23: Latin America Market Value (US$ Mn) Forecast by End-user Industry, 2017-2032
Table 24: Latin America Market Volume (Litres) Forecast by End-user Industry, 2017-2032
Table 25: Europe Market Value (US$ Mn) Forecast by Country, 2017-2032
Table 26: Europe Market Volume (Litres) Forecast by Country, 2017-2032
Table 27: Europe Market Value (US$ Mn) Forecast by Product Type, 2017-2032
Table 28: Europe Market Volume (Litres) Forecast by Product Type, 2017-2032
Table 29: Europe Market Value (US$ Mn) Forecast by Material, 2017-2032
Table 30: Europe Market Volume (Litres) Forecast by Material, 2017-2032
Table 31: Europe Market Value (US$ Mn) Forecast by End-user Industry, 2017-2032
Table 32: Europe Market Volume (Litres) Forecast by End-user Industry, 2017-2032
Table 33: East Asia Market Value (US$ Mn) Forecast by Country, 2017-2032
Table 34: East Asia Market Volume (Litres) Forecast by Country, 2017-2032
Table 35: East Asia Market Value (US$ Mn) Forecast by Product Type, 2017-2032
Table 36: East Asia Market Volume (Litres) Forecast by Product Type, 2017-2032
Table 37: East Asia Market Value (US$ Mn) Forecast by Material, 2017-2032
Table 38: East Asia Market Volume (Litres) Forecast by Material, 2017-2032
Table 39: East Asia Market Value (US$ Mn) Forecast by End-user Industry, 2017-2032
Table 40: East Asia Market Volume (Litres) Forecast by End-user Industry, 2017-2032
Table 41: South Asia & Pacific Market Value (US$ Mn) Forecast by Country, 2017-2032
Table 42: South Asia & Pacific Market Volume (Litres) Forecast by Country, 2017-2032
Table 43: South Asia & Pacific Market Value (US$ Mn) Forecast by Product Type, 2017-2032
Table 44: South Asia & Pacific Market Volume (Litres) Forecast by Product Type, 2017-2032
Table 45: South Asia & Pacific Market Value (US$ Mn) Forecast by Material, 2017-2032
Table 46: South Asia & Pacific Market Volume (Litres) Forecast by Material, 2017-2032
Table 47: South Asia & Pacific Market Value (US$ Mn) Forecast by End-user Industry, 2017-2032
Table 48: South Asia & Pacific Market Volume (Litres) Forecast by End-user Industry, 2017-2032
Table 49: MEA Market Value (US$ Mn) Forecast by Country, 2017-2032
Table 50: MEA Market Volume (Litres) Forecast by Country, 2017-2032
Table 51: MEA Market Value (US$ Mn) Forecast by Product Type, 2017-2032
Table 52: MEA Market Volume (Litres) Forecast by Product Type, 2017-2032
Table 53: MEA Market Value (US$ Mn) Forecast by Material, 2017-2032
Table 54: MEA Market Volume (Litres) Forecast by Material, 2017-2032
Table 55: MEA Market Value (US$ Mn) Forecast by End-user Industry, 2017-2032
Table 56: MEA Market Volume (Litres) Forecast by End-user Industry, 2017-2032
Figure 1: Global Market Value (US$ Mn) by Product Type, 2022-2032
Figure 2: Global Market Value (US$ Mn) by Material, 2022-2032
Figure 3: Global Market Value (US$ Mn) by End-user Industry, 2022-2032
Figure 4: Global Market Value (US$ Mn) by Region, 2022-2032
Figure 5: Global Market Value (US$ Mn) Analysis by Region, 2017-2032
Figure 6: Global Market Volume (Litres) Analysis by Region, 2017-2032
Figure 7: Global Market Value Share (%) and BPS Analysis by Region, 2022-2032
Figure 8: Global Market Y-o-Y Growth (%) Projections by Region, 2022-2032
Figure 9: Global Market Value (US$ Mn) Analysis by Product Type, 2017-2032
Figure 10: Global Market Volume (Litres) Analysis by Product Type, 2017-2032
Figure 11: Global Market Value Share (%) and BPS Analysis by Product Type, 2022-2032
Figure 12: Global Market Y-o-Y Growth (%) Projections by Product Type, 2022-2032
Figure 13: Global Market Value (US$ Mn) Analysis by Material, 2017-2032
Figure 14: Global Market Volume (Litres) Analysis by Material, 2017-2032
Figure 15: Global Market Value Share (%) and BPS Analysis by Material, 2022-2032
Figure 16: Global Market Y-o-Y Growth (%) Projections by Material, 2022-2032
Figure 17: Global Market Value (US$ Mn) Analysis by End-user Industry, 2017-2032
Figure 18: Global Market Volume (Litres) Analysis by End-user Industry, 2017-2032
Figure 19: Global Market Value Share (%) and BPS Analysis by End-user Industry, 2022-2032
Figure 20: Global Market Y-o-Y Growth (%) Projections by End-user Industry, 2022-2032
Figure 21: Global Market Attractiveness by Product Type, 2022-2032
Figure 22: Global Market Attractiveness by Material, 2022-2032
Figure 23: Global Market Attractiveness by End-user Industry, 2022-2032
Figure 24: Global Market Attractiveness by Region, 2022-2032
Figure 25: North America Market Value (US$ Mn) by Product Type, 2022-2032
Figure 26: North America Market Value (US$ Mn) by Material, 2022-2032
Figure 27: North America Market Value (US$ Mn) by End-user Industry, 2022-2032
Figure 28: North America Market Value (US$ Mn) by Country, 2022-2032
Figure 29: North America Market Value (US$ Mn) Analysis by Country, 2017-2032
Figure 30: North America Market Volume (Litres) Analysis by Country, 2017-2032
Figure 31: North America Market Value Share (%) and BPS Analysis by Country, 2022-2032
Figure 32: North America Market Y-o-Y Growth (%) Projections by Country, 2022-2032
Figure 33: North America Market Value (US$ Mn) Analysis by Product Type, 2017-2032
Figure 34: North America Market Volume (Litres) Analysis by Product Type, 2017-2032
Figure 35: North America Market Value Share (%) and BPS Analysis by Product Type, 2022-2032
Figure 36: North America Market Y-o-Y Growth (%) Projections by Product Type, 2022-2032
Figure 37: North America Market Value (US$ Mn) Analysis by Material, 2017-2032
Figure 38: North America Market Volume (Litres) Analysis by Material, 2017-2032
Figure 39: North America Market Value Share (%) and BPS Analysis by Material, 2022-2032
Figure 40: North America Market Y-o-Y Growth (%) Projections by Material, 2022-2032
Figure 41: North America Market Value (US$ Mn) Analysis by End-user Industry, 2017-2032
Figure 42: North America Market Volume (Litres) Analysis by End-user Industry, 2017-2032
Figure 43: North America Market Value Share (%) and BPS Analysis by End-user Industry, 2022-2032
Figure 44: North America Market Y-o-Y Growth (%) Projections by End-user Industry, 2022-2032
Figure 45: North America Market Attractiveness by Product Type, 2022-2032
Figure 46: North America Market Attractiveness by Material, 2022-2032
Figure 47: North America Market Attractiveness by End-user Industry, 2022-2032
Figure 48: North America Market Attractiveness by Country, 2022-2032
Figure 49: Latin America Market Value (US$ Mn) by Product Type, 2022-2032
Figure 50: Latin America Market Value (US$ Mn) by Material, 2022-2032
Figure 51: Latin America Market Value (US$ Mn) by End-user Industry, 2022-2032
Figure 52: Latin America Market Value (US$ Mn) by Country, 2022-2032
Figure 53: Latin America Market Value (US$ Mn) Analysis by Country, 2017-2032
Figure 54: Latin America Market Volume (Litres) Analysis by Country, 2017-2032
Figure 55: Latin America Market Value Share (%) and BPS Analysis by Country, 2022-2032
Figure 56: Latin America Market Y-o-Y Growth (%) Projections by Country, 2022-2032
Figure 57: Latin America Market Value (US$ Mn) Analysis by Product Type, 2017-2032
Figure 58: Latin America Market Volume (Litres) Analysis by Product Type, 2017-2032
Figure 59: Latin America Market Value Share (%) and BPS Analysis by Product Type, 2022-2032
Figure 60: Latin America Market Y-o-Y Growth (%) Projections by Product Type, 2022-2032
Figure 61: Latin America Market Value (US$ Mn) Analysis by Material, 2017-2032
Figure 62: Latin America Market Volume (Litres) Analysis by Material, 2017-2032
Figure 63: Latin America Market Value Share (%) and BPS Analysis by Material, 2022-2032
Figure 64: Latin America Market Y-o-Y Growth (%) Projections by Material, 2022-2032
Figure 65: Latin America Market Value (US$ Mn) Analysis by End-user Industry, 2017-2032
Figure 66: Latin America Market Volume (Litres) Analysis by End-user Industry, 2017-2032
Figure 67: Latin America Market Value Share (%) and BPS Analysis by End-user Industry, 2022-2032
Figure 68: Latin America Market Y-o-Y Growth (%) Projections by End-user Industry, 2022-2032
Figure 69: Latin America Market Attractiveness by Product Type, 2022-2032
Figure 70: Latin America Market Attractiveness by Material, 2022-2032
Figure 71: Latin America Market Attractiveness by End-user Industry, 2022-2032
Figure 72: Latin America Market Attractiveness by Country, 2022-2032
Figure 73: Europe Market Value (US$ Mn) by Product Type, 2022-2032
Figure 74: Europe Market Value (US$ Mn) by Material, 2022-2032
Figure 75: Europe Market Value (US$ Mn) by End-user Industry, 2022-2032
Figure 76: Europe Market Value (US$ Mn) by Country, 2022-2032
Figure 77: Europe Market Value (US$ Mn) Analysis by Country, 2017-2032
Figure 78: Europe Market Volume (Litres) Analysis by Country, 2017-2032
Figure 79: Europe Market Value Share (%) and BPS Analysis by Country, 2022-2032
Figure 80: Europe Market Y-o-Y Growth (%) Projections by Country, 2022-2032
Figure 81: Europe Market Value (US$ Mn) Analysis by Product Type, 2017-2032
Figure 82: Europe Market Volume (Litres) Analysis by Product Type, 2017-2032
Figure 83: Europe Market Value Share (%) and BPS Analysis by Product Type, 2022-2032
Figure 84: Europe Market Y-o-Y Growth (%) Projections by Product Type, 2022-2032
Figure 85: Europe Market Value (US$ Mn) Analysis by Material, 2017-2032
Figure 86: Europe Market Volume (Litres) Analysis by Material, 2017-2032
Figure 87: Europe Market Value Share (%) and BPS Analysis by Material, 2022-2032
Figure 88: Europe Market Y-o-Y Growth (%) Projections by Material, 2022-2032
Figure 89: Europe Market Value (US$ Mn) Analysis by End-user Industry, 2017-2032
Figure 90: Europe Market Volume (Litres) Analysis by End-user Industry, 2017-2032
Figure 91: Europe Market Value Share (%) and BPS Analysis by End-user Industry, 2022-2032
Figure 92: Europe Market Y-o-Y Growth (%) Projections by End-user Industry, 2022-2032
Figure 93: Europe Market Attractiveness by Product Type, 2022-2032
Figure 94: Europe Market Attractiveness by Material, 2022-2032
Figure 95: Europe Market Attractiveness by End-user Industry, 2022-2032
Figure 96: Europe Market Attractiveness by Country, 2022-2032
Figure 97: East Asia Market Value (US$ Mn) by Product Type, 2022-2032
Figure 98: East Asia Market Value (US$ Mn) by Material, 2022-2032
Figure 99: East Asia Market Value (US$ Mn) by End-user Industry, 2022-2032
Figure 100: East Asia Market Value (US$ Mn) by Country, 2022-2032
Figure 101: East Asia Market Value (US$ Mn) Analysis by Country, 2017-2032
Figure 102: East Asia Market Volume (Litres) Analysis by Country, 2017-2032
Figure 103: East Asia Market Value Share (%) and BPS Analysis by Country, 2022-2032
Figure 104: East Asia Market Y-o-Y Growth (%) Projections by Country, 2022-2032
Figure 105: East Asia Market Value (US$ Mn) Analysis by Product Type, 2017-2032
Figure 106: East Asia Market Volume (Litres) Analysis by Product Type, 2017-2032
Figure 107: East Asia Market Value Share (%) and BPS Analysis by Product Type, 2022-2032
Figure 108: East Asia Market Y-o-Y Growth (%) Projections by Product Type, 2022-2032
Figure 109: East Asia Market Value (US$ Mn) Analysis by Material, 2017-2032
Figure 110: East Asia Market Volume (Litres) Analysis by Material, 2017-2032
Figure 111: East Asia Market Value Share (%) and BPS Analysis by Material, 2022-2032
Figure 112: East Asia Market Y-o-Y Growth (%) Projections by Material, 2022-2032
Figure 113: East Asia Market Value (US$ Mn) Analysis by End-user Industry, 2017-2032
Figure 114: East Asia Market Volume (Litres) Analysis by End-user Industry, 2017-2032
Figure 115: East Asia Market Value Share (%) and BPS Analysis by End-user Industry, 2022-2032
Figure 116: East Asia Market Y-o-Y Growth (%) Projections by End-user Industry, 2022-2032
Figure 117: East Asia Market Attractiveness by Product Type, 2022-2032
Figure 118: East Asia Market Attractiveness by Material, 2022-2032
Figure 119: East Asia Market Attractiveness by End-user Industry, 2022-2032
Figure 120: East Asia Market Attractiveness by Country, 2022-2032
Figure 121: South Asia & Pacific Market Value (US$ Mn) by Product Type, 2022-2032
Figure 122: South Asia & Pacific Market Value (US$ Mn) by Material, 2022-2032
Figure 123: South Asia & Pacific Market Value (US$ Mn) by End-user Industry, 2022-2032
Figure 124: South Asia & Pacific Market Value (US$ Mn) by Country, 2022-2032
Figure 125: South Asia & Pacific Market Value (US$ Mn) Analysis by Country, 2017-2032
Figure 126: South Asia & Pacific Market Volume (Litres) Analysis by Country, 2017-2032
Figure 127: South Asia & Pacific Market Value Share (%) and BPS Analysis by Country, 2022-2032
Figure 128: South Asia & Pacific Market Y-o-Y Growth (%) Projections by Country, 2022-2032
Figure 129: South Asia & Pacific Market Value (US$ Mn) Analysis by Product Type, 2017-2032
Figure 130: South Asia & Pacific Market Volume (Litres) Analysis by Product Type, 2017-2032
Figure 131: South Asia & Pacific Market Value Share (%) and BPS Analysis by Product Type, 2022-2032
Figure 132: South Asia & Pacific Market Y-o-Y Growth (%) Projections by Product Type, 2022-2032
Figure 133: South Asia & Pacific Market Value (US$ Mn) Analysis by Material, 2017-2032
Figure 134: South Asia & Pacific Market Volume (Litres) Analysis by Material, 2017-2032
Figure 135: South Asia & Pacific Market Value Share (%) and BPS Analysis by Material, 2022-2032
Figure 136: South Asia & Pacific Market Y-o-Y Growth (%) Projections by Material, 2022-2032
Figure 137: South Asia & Pacific Market Value (US$ Mn) Analysis by End-user Industry, 2017-2032
Figure 138: South Asia & Pacific Market Volume (Litres) Analysis by End-user Industry, 2017-2032
Figure 139: South Asia & Pacific Market Value Share (%) and BPS Analysis by End-user Industry, 2022-2032
Figure 140: South Asia & Pacific Market Y-o-Y Growth (%) Projections by End-user Industry, 2022-2032
Figure 141: South Asia & Pacific Market Attractiveness by Product Type, 2022-2032
Figure 142: South Asia & Pacific Market Attractiveness by Material, 2022-2032
Figure 143: South Asia & Pacific Market Attractiveness by End-user Industry, 2022-2032
Figure 144: South Asia & Pacific Market Attractiveness by Country, 2022-2032
Figure 145: MEA Market Value (US$ Mn) by Product Type, 2022-2032
Figure 146: MEA Market Value (US$ Mn) by Material, 2022-2032
Figure 147: MEA Market Value (US$ Mn) by End-user Industry, 2022-2032
Figure 148: MEA Market Value (US$ Mn) by Country, 2022-2032
Figure 149: MEA Market Value (US$ Mn) Analysis by Country, 2017-2032
Figure 150: MEA Market Volume (Litres) Analysis by Country, 2017-2032
Figure 151: MEA Market Value Share (%) and BPS Analysis by Country, 2022-2032
Figure 152: MEA Market Y-o-Y Growth (%) Projections by Country, 2022-2032
Figure 153: MEA Market Value (US$ Mn) Analysis by Product Type, 2017-2032
Figure 154: MEA Market Volume (Litres) Analysis by Product Type, 2017-2032
Figure 155: MEA Market Value Share (%) and BPS Analysis by Product Type, 2022-2032
Figure 156: MEA Market Y-o-Y Growth (%) Projections by Product Type, 2022-2032
Figure 157: MEA Market Value (US$ Mn) Analysis by Material, 2017-2032
Figure 158: MEA Market Volume (Litres) Analysis by Material, 2017-2032
Figure 159: MEA Market Value Share (%) and BPS Analysis by Material, 2022-2032
Figure 160: MEA Market Y-o-Y Growth (%) Projections by Material, 2022-2032
Figure 161: MEA Market Value (US$ Mn) Analysis by End-user Industry, 2017-2032
Figure 162: MEA Market Volume (Litres) Analysis by End-user Industry, 2017-2032
Figure 163: MEA Market Value Share (%) and BPS Analysis by End-user Industry, 2022-2032
Figure 164: MEA Market Y-o-Y Growth (%) Projections by End-user Industry, 2022-2032
Figure 165: MEA Market Attractiveness by Product Type, 2022-2032
Figure 166: MEA Market Attractiveness by Material, 2022-2032
Figure 167: MEA Market Attractiveness by End-user Industry, 2022-2032
Figure 168: MEA Market Attractiveness by Country, 2022-2032
The global fire retardant coatings market is set to advance at a CAGR of 6% from 2022 to 2032.
Asia Pacific is likely to hold major fire retardant coatings market share during the forecast period.
Fire retardant coatings market is expected to reach USD 9.17 billion by 2032.
Explore Similar Insights
Thank you!
You will receive an email from our Business Development Manager. Please be sure to check your SPAM/JUNK folder too.