The global fire extinguisher market is projected to reach USD 7.3 billion by 2035, recording an absolute increase of USD 3.1 billion over the forecast period. The market is valued at USD 4.2 billion in 2025 and is set to rise at a CAGR of 5.7% during the assessment period. The overall market size is expected to grow by 1.7 times during the same period, supported by increasing demand for fire safety solutions worldwide, driving demand for advanced extinguishing technologies and increasing investments in fire protection infrastructure and regulatory compliance projects globally. However, high maintenance costs and complex regulatory requirements may pose challenges to market expansion.
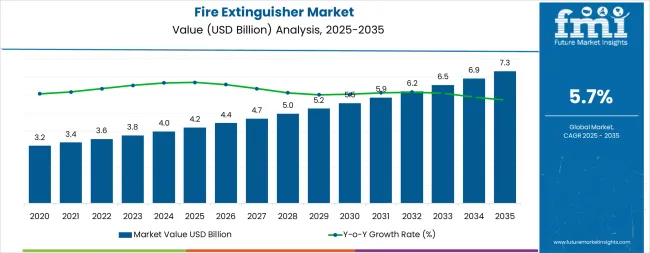
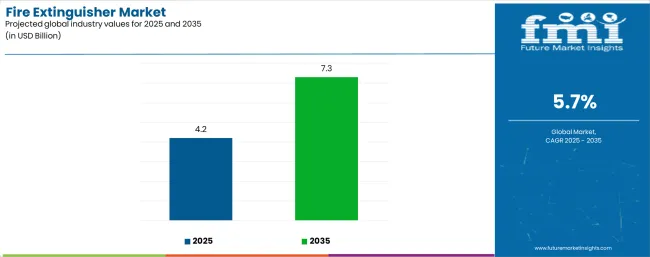
Between 2025 and 2030, the fire extinguisher market is projected to expand from USD 4.2 billion to USD 5.6 billion, resulting in a value increase of USD 1.4 billion, which represents 45.2% of the total forecast growth for the decade. This phase of development will be shaped by rising demand for commercial fire safety and residential protection applications, product innovation in smart extinguisher technologies and IoT integration systems, as well as expanding integration with building automation systems and smart monitoring initiatives. Companies are establishing competitive positions through investment in advanced fire suppression technologies, environmental-friendly agents, and strategic market expansion across residential, commercial, and industrial applications.
From 2030 to 2035, the market is forecast to grow from USD 5.6 billion to USD 7.3 billion, adding another USD 1.7 billion, which constitutes 54.8% of the overall ten-year expansion. This period is expected to be characterized by the expansion of specialized fire protection systems, including advanced smart extinguisher formulations and integrated monitoring solutions tailored for specific fire hazard requirements, strategic collaborations between equipment manufacturers and building safety providers, and an enhanced focus on fire prevention and automated response optimization. The growing emphasis on smart building integration and regulatory compliance will drive demand for advanced, high-performance fire extinguisher solutions across diverse commercial and residential applications.
| Metric | Value |
|---|---|
| Market Value (2025) | USD 4.2 billion |
| Market Forecast Value (2035) | USD 7.3 billion |
| Forecast CAGR (2025 to 2035) | 5.7% |
The fire extinguisher market grows by enabling building owners and facility managers to achieve superior fire safety protection and regulatory compliance across multiple applications, ranging from small-scale residential properties to large-scale industrial complexes. Safety managers and building operators face mounting pressure to improve fire protection standards and emergency response capabilities, with fire extinguisher solutions typically providing 90-95% fire suppression effectiveness for appropriate fire classes compared to basic fire fighting methods, making advanced fire protection technology essential for comprehensive safety management. The building safety industry's need for maximum fire protection assurance creates demand for advanced extinguisher solutions that can minimize fire damage risks, enhance response times, and ensure consistent performance across diverse fire hazard environments. Government initiatives promoting fire safety standards and building code compliance drive adoption in residential, commercial, and industrial applications, where fire protection performance has a direct impact on occupant safety and property preservation. However, high maintenance requirements and the complexity of achieving optimal performance across different fire types may limit adoption rates among cost-sensitive property owners and regions with limited fire safety infrastructure.
The market is segmented by product type, fire type, end-use sector, and region. By product type, the market is divided into water, foam, wet chemical, dry powder, carbon dioxide, dry chemical, and others. Based on fire type, the market is categorized into Class A extinguishers, Class B extinguishers, Class C extinguishers, Class D extinguishers, and Class K extinguishers. By end-use sector, the market is classified into residential, commercial, industrial, public areas, and others. Regionally, the market is divided into North America, Latin America, Western Europe, Eastern Europe, East Asia, South Asia Pacific, and Middle East & Africa.
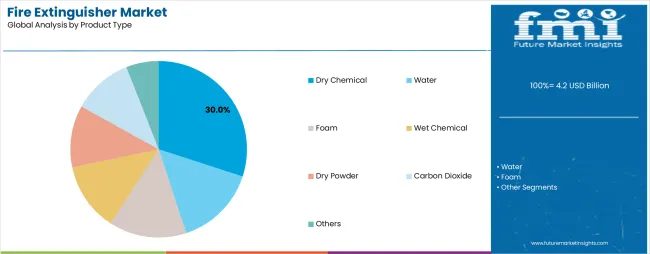
The dry chemical segment demonstrates strong performance in the fire extinguisher market, driven by its versatility and effectiveness across multiple fire classes. The dry chemical segment's established position reflects the critical importance of multi-purpose fire suppression capability, broad application range, and proven effectiveness across residential, commercial, and industrial facilities, meeting fire protection requirements in diverse safety applications.
Water-based extinguishers maintain substantial market presence through traditional fire suppression applications and environmental considerations that favor non-chemical solutions. This segment benefits from regulatory preferences for environmentally friendly agents and established effectiveness in Class A fire applications.
Key technological advantages driving the dry chemical segment include:
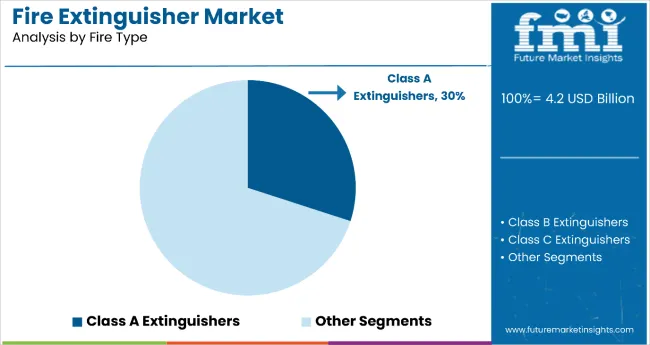
Class A extinguisher systems dominate the fire extinguisher market with approximately 30% market share in 2025, reflecting the critical role of ordinary combustible fire protection in residential and commercial applications. The Class A segment's market leadership is reinforced by the prevalence of common combustible materials, building code requirements, and rising demand for general-purpose fire protection that directly correlates with property safety and occupant protection standards.
The Class B extinguisher segment represents substantial market demand, capturing significant share through specialized requirements for flammable liquid fire protection, industrial facilities, and fuel handling applications. This segment benefits from growing industrial activity and specialized fire hazard management that requires dedicated liquid fire suppression capabilities.
Class C extinguishers account for substantial market share through electrical fire applications, while Class D and Class K segments serve specialized metal and cooking fire protection requirements respectively.
Key market dynamics supporting Class A growth include:
Commercial applications demonstrate strong market leadership in the fire extinguisher market, accounting for substantial market share through comprehensive fire safety requirements and regulatory compliance needs. The commercial segment's dominant position reflects the critical role of workplace fire protection, occupant safety standards, and business continuity requirements in driving fire extinguisher demand across office buildings, retail facilities, and service establishments.
Residential applications show growing momentum through increasing fire safety awareness, home protection initiatives, and building code developments that mandate residential fire safety equipment. This segment benefits from growing homeowner awareness and insurance requirements that create demand for accessible fire protection solutions.
Industrial applications maintain significant market presence through specialized fire hazard management, process safety requirements, and regulatory compliance in manufacturing and processing facilities. Public areas serve community safety requirements, while others category captures specialized applications including transportation and institutional facilities.
Key factors supporting commercial segment growth include:
The market is driven by three concrete demand factors tied to fire safety and regulatory compliance outcomes. First, global fire safety awareness and building code development create increasing demand for high-performance fire extinguisher solutions, with fire incidents causing over USD 50 billion in property damage annually worldwide, requiring advanced protection technology for maximum safety assurance. Second, modernization of fire protection systems and smart building integration drive the adoption of intelligent extinguisher technologies, with facility managers seeking 90-95% improvement in fire suppression effectiveness and automated monitoring capabilities. Third, technological advancements in extinguishing agents and IoT monitoring systems enable more effective and responsive fire protection solutions that reduce maintenance complexity while improving long-term reliability and performance tracking.
Market restraints include high maintenance cost requirements that can impact total ownership costs and operational budgets, particularly during periods of economic constraints or facility management budget limitations affecting fire safety equipment adoption. Regulatory complexity and compliance challenges pose another significant issue, as achieving consistent performance standards across different fire types and building applications demands specialized expertise and comprehensive training systems, potentially causing implementation delays and increased operational costs. Technical skills shortage in fire safety equipment maintenance and inspection creates additional challenges for facility managers, demanding ongoing investment in training capabilities and compliance with varying regional fire safety standards.
Key trends indicate accelerated adoption in emerging markets, particularly India, Brazil, and developing regions, where rapid urbanization and infrastructure development drive comprehensive fire safety system deployment. Technology advancement trends toward AI integration with enhanced predictive monitoring, smart building connectivity, and automated inspection capabilities enable next-generation product development that addresses multiple fire protection requirements simultaneously. However, the market could face disruption if alternative fire suppression technologies or significant changes in building safety approaches minimize reliance on traditional portable fire extinguisher solutions.
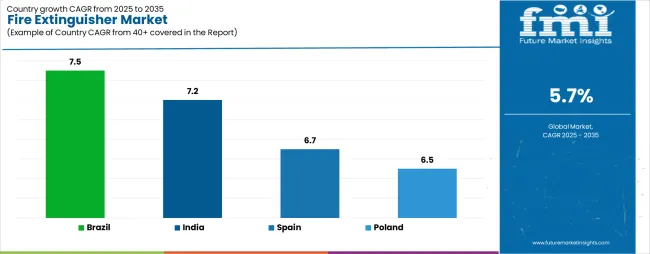
| Country | CAGR (2025-2035) |
|---|---|
| Brazil | 7.5% |
| India | 7.2% |
| Spain | 6.7% |
| Poland | 6.5% |
The fire extinguisher market is gaining momentum worldwide, with Brazil taking the lead thanks to rapid urbanization and comprehensive building safety regulatory development. Close behind, India benefits from industrial expansion and growing fire safety awareness programs, positioning itself as a strategic growth hub in the Asian region. Kingdom of Saudi Arabia shows steady advancement, where infrastructure development strengthens its role in the Middle Eastern fire safety market development. Spain is focusing on building modernization and fire safety compliance, signaling an ambition to capitalize on growing opportunities in European fire protection technology markets. Meanwhile, Poland stands out for its industrial development and regulatory alignment with EU safety standards, recording consistent progress in fire safety equipment adoption. Together, Brazil and India anchor the global expansion story, while the rest build stability and diversity into the market's growth path.
The report covers an in-depth analysis of 40+ countries, the top-performing countries are highlighted below.
Brazil demonstrates the strongest growth potential in the Fire Extinguisher Market with a CAGR of 7.5% through 2035. The country's leadership position stems from comprehensive urbanization projects, government-backed building safety programs, and aggressive fire protection regulatory targets, driving the adoption of high-performance fire extinguisher systems. Growth is concentrated in major metropolitan regions, including São Paulo, Rio de Janeiro, Minas Gerais, and Paraná, where building developers and facility managers are implementing advanced fire protection solutions for enhanced safety performance and regulatory compliance advantages. Distribution channels through established safety equipment distributors and direct manufacturer relationships expand deployment across commercial buildings, residential developments, and industrial facilities. The country's building safety strategy provides policy support for advanced fire protection technology development, including high-performance extinguisher platform adoption.
Key market factors:
In Mumbai, Delhi, Bangalore, and Chennai, the adoption of fire extinguisher systems is accelerating across commercial facilities and residential complexes, driven by industrial safety targets and comprehensive fire protection initiatives. The market demonstrates strong growth momentum with a CAGR of 7.2% through 2035, linked to comprehensive industrial development and increasing focus on workplace safety solutions. Indian facility managers and building owners are implementing advanced fire extinguisher systems and safety monitoring platforms to enhance protection performance while meeting stringent safety requirements in domestic and commercial applications. The country's industrial safety programs create demand for high-performance fire protection solutions, while increasing emphasis on building safety drives adoption of advanced extinguishing technologies and comprehensive monitoring systems.
Spain's market expansion is driven by diverse building applications, including fire protection in Madrid and Barcelona regions, commercial development in Valencia and Seville, and comprehensive building modernization across multiple urban areas. The country demonstrates promising growth potential with a CAGR of 6.7% through 2035, supported by EU building safety programs and regional fire protection initiatives. Spanish building owners face implementation challenges related to regulatory compliance and retrofitting requirements, requiring system upgrade approaches and comprehensive support systems. However, growing safety standards and tourism industry requirements create compelling business cases for fire extinguisher system adoption, particularly in commercial and hospitality sectors where safety performance has a direct impact on operational licensing.
Market characteristics:
Poland's market leads in building safety integration based on EU regulatory alignment and comprehensive fire protection applications for enhanced safety characteristics. The country shows solid potential with a CAGR of 6.5% through 2035, driven by industrial modernization programs and building safety initiatives across major industrial regions, including Mazowieckie, Silesia, Greater Poland, and Lesser Poland. Polish building owners are adopting advanced fire extinguisher systems for safety optimization and regulatory compliance, particularly in regions with industrial development and commercial facilities requiring superior fire protection capabilities. Technology deployment channels through established safety equipment distributors and direct industrial relationships expand coverage across manufacturing facilities and commercial buildings.
Leading market segments:
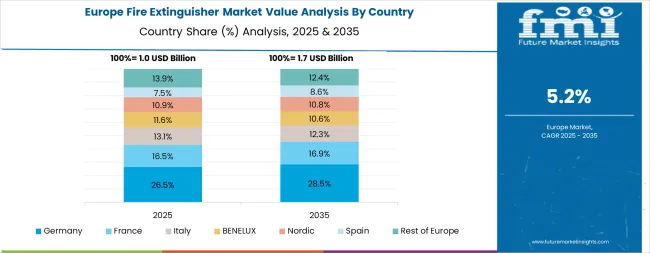
The fire extinguisher market in Europe is projected to grow from USD 1.1 billion in 2025 to USD 1.8 billion by 2035, registering a CAGR of 5.1% over the forecast period. Germany is expected to maintain its leadership position with a 28.3% market share in 2025, declining slightly to 27.8% by 2035, supported by its extensive industrial infrastructure and major manufacturing centers, including North Rhine-Westphalia, Bavaria, and Baden-Württemberg safety hubs.
Spain follows with a 19.2% share in 2025, projected to reach 19.7% by 2035, driven by comprehensive building modernization programs and advanced fire safety initiatives implementing extinguisher technologies. The United Kingdom holds a 17.4% share in 2025, expected to maintain 17.1% by 2035 through ongoing building safety development and regulatory compliance programs. France commands a 15.8% share, while Italy accounts for 11.6% in 2025. The Rest of Europe region is anticipated to gain momentum, expanding its collective share from 7.7% to 8.3% by 2035, attributed to increasing fire extinguisher adoption in Nordic countries and emerging Eastern European building safety markets implementing advanced fire protection programs.
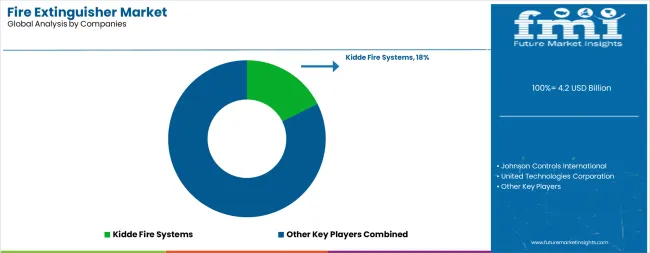
The fire extinguisher market features approximately 20-25 meaningful players with moderate concentration, where the top three companies control roughly 35-40% of global market share through established fire protection platforms and extensive safety equipment relationships. Competition centers on technological innovation, regulatory compliance, and comprehensive safety solutions rather than price competition alone.
Market leaders include Johnson Controls International, United Technologies Corporation, and Amerex Corporation, which maintain competitive advantages through comprehensive fire protection solution portfolios, global service networks, and deep expertise in the fire safety and building protection sectors, creating high switching costs for customers. These companies leverage research and development capabilities and ongoing technical support relationships to defend market positions while expanding into adjacent smart building and automated safety applications.
Challengers encompass Minimax Viking Group and Kidde Fire Systems, which compete through specialized fire protection solutions and strong regional presence in key commercial markets. Technology specialists, including FirePro Systems, Safex Fire Services, and NAFFCO, focus on specific applications or vertical markets, offering differentiated capabilities in clean agent systems, industrial fire protection, and specialized extinguishing technologies.
Regional players and emerging safety equipment providers create competitive pressure through innovative solutions and rapid customization capabilities, particularly in high-growth markets including Brazil, India, and developing regions, where local presence provides advantages in regulatory compliance and system integration. Market dynamics favor companies that combine advanced fire protection technologies with comprehensive service offerings that address the complete safety lifecycle from system design through ongoing maintenance and compliance support.
Fire extinguisher systems represent essential safety technologies that enable building owners and facility managers to achieve 90-95% improvement in fire suppression effectiveness compared to manual fire fighting methods, delivering superior property protection and life safety with enhanced emergency response capabilities in critical fire situations. With the market projected to grow from USD 4.2 billion in 2025 to USD 7.3 billion by 2035 at a 5.7% CAGR, these safety systems offer compelling advantages - enhanced fire protection, customizable suppression configurations, and comprehensive monitoring integration - making them essential for commercial buildings, residential developments, and industrial facilities seeking alternatives to inadequate fire protection systems that compromise safety through delayed response and insufficient suppression capability. Scaling market adoption and technological advancement requires coordinated action across fire safety regulations, building code development, equipment manufacturers, safety professionals, and fire protection investment capital.
| Items | Values |
|---|---|
| Quantitative Units | USD 4.2 billion |
| Product Type | Water (Air-Pressurized Water, Water-Mist), Foam (Aqueous Film-Foaming Foam, Compressed Air Foam System, Others), Wet Chemical (Potassium Acetate, Potassium Carbonate, Potassium Citrate), Dry Powder, Carbon Dioxide, Dry Chemical, Others |
| Fire Type | Class A Extinguishers, Class B Extinguishers, Class C Extinguishers, Class D Extinguishers, Class K Extinguishers |
| End Use Sector | Residential, Commercial, Industrial, Public Areas, Others |
| Regions Covered | North America, Latin America, Western Europe, Eastern Europe, East Asia, South Asia Pacific, Middle East & Africa |
| Country Covered | Brazil, India, Kingdom of Saudi Arabia, Spain, Poland, and 40+ countries |
| Key Companies Profiled | Johnson Controls International, United Technologies Corporation, Amerex Corporation, Minimax Viking Group, Kidde Fire Systems, FirePro Systems, Safex Fire Services, NAFFCO |
| Additional Attributes | Dollar sales by product type, fire type, and end-use sector categories, regional adoption trends across North America, East Asia, and Latin America, competitive landscape with fire protection providers and safety system integrators, regulatory requirements and specifications, integration with building automation initiatives and smart safety systems, innovations in fire suppression technology and monitoring systems, and development of specialized configurations with effectiveness and reliability capabilities. |
The global fire extinguisher market is estimated to be valued at USD 4.2 billion in 2025.
The market size for the fire extinguisher market is projected to reach USD 7.3 billion by 2035.
The fire extinguisher market is expected to grow at a 5.7% CAGR between 2025 and 2035.
The key product types in fire extinguisher market are dry chemical, water, foam, wet chemical, dry powder, carbon dioxide and others.
In terms of fire type, class a extinguishers segment to command 30.0% share in the fire extinguisher market in 2025.


Our Research Products

The "Full Research Suite" delivers actionable market intel, deep dives on markets or technologies, so clients act faster, cut risk, and unlock growth.

The Leaderboard benchmarks and ranks top vendors, classifying them as Established Leaders, Leading Challengers, or Disruptors & Challengers.

Locates where complements amplify value and substitutes erode it, forecasting net impact by horizon

We deliver granular, decision-grade intel: market sizing, 5-year forecasts, pricing, adoption, usage, revenue, and operational KPIs—plus competitor tracking, regulation, and value chains—across 60 countries broadly.

Spot the shifts before they hit your P&L. We track inflection points, adoption curves, pricing moves, and ecosystem plays to show where demand is heading, why it is changing, and what to do next across high-growth markets and disruptive tech

Real-time reads of user behavior. We track shifting priorities, perceptions of today’s and next-gen services, and provider experience, then pace how fast tech moves from trial to adoption, blending buyer, consumer, and channel inputs with social signals (#WhySwitch, #UX).

Partner with our analyst team to build a custom report designed around your business priorities. From analysing market trends to assessing competitors or crafting bespoke datasets, we tailor insights to your needs.
Supplier Intelligence
Discovery & Profiling
Capacity & Footprint
Performance & Risk
Compliance & Governance
Commercial Readiness
Who Supplies Whom
Scorecards & Shortlists
Playbooks & Docs
Category Intelligence
Definition & Scope
Demand & Use Cases
Cost Drivers
Market Structure
Supply Chain Map
Trade & Policy
Operating Norms
Deliverables
Buyer Intelligence
Account Basics
Spend & Scope
Procurement Model
Vendor Requirements
Terms & Policies
Entry Strategy
Pain Points & Triggers
Outputs
Pricing Analysis
Benchmarks
Trends
Should-Cost
Indexation
Landed Cost
Commercial Terms
Deliverables
Brand Analysis
Positioning & Value Prop
Share & Presence
Customer Evidence
Go-to-Market
Digital & Reputation
Compliance & Trust
KPIs & Gaps
Outputs
Full Research Suite comprises of:
Market outlook & trends analysis
Interviews & case studies
Strategic recommendations
Vendor profiles & capabilities analysis
5-year forecasts
8 regions and 60+ country-level data splits
Market segment data splits
12 months of continuous data updates
DELIVERED AS:
PDF EXCEL ONLINE
Fire Resistant Apron Market Size and Share Forecast Outlook 2025 to 2035
Firefighter Tapes Market Size and Share Forecast Outlook 2025 to 2035
Fire Pump Test Meter Market Size and Share Forecast Outlook 2025 to 2035
Fire Sprinkler System Market Size and Share Forecast Outlook 2025 to 2035
Fire Protection Materials Market Size and Share Forecast Outlook 2025 to 2035
Fire Stopping Material Market Size and Share Forecast Outlook 2025 to 2035
Fireproof Insulation Market Size and Share Forecast Outlook 2025 to 2035
Fire Tube Chemical Boiler Market Size and Share Forecast Outlook 2025 to 2035
Firefighting Foam Market Size and Share Forecast Outlook 2025 to 2035
Fire Resistant Cable Market Size and Share Forecast Outlook 2025 to 2035
Fire Suppression System Market Size and Share Forecast Outlook 2025 to 2035
Fire Protection System Pipes Market Size and Share Forecast Outlook 2025 to 2035
Fire Stopping Materials Market Size and Share Forecast Outlook 2025 to 2035
Firefighting Drone Market Size and Share Forecast Outlook 2025 to 2035
Fire Resistant Fabrics Market Size and Share Forecast Outlook 2025 to 2035
Fire Door Market Size and Share Forecast Outlook 2025 to 2035
Fireclay Tiles Market Size and Share Forecast Outlook 2025 to 2035
Firearms Market Size and Share Forecast Outlook 2025 to 2035
Fire-resistant Paint Market Size and Share Forecast Outlook 2025 to 2035
Fire Collar Market Size and Share Forecast Outlook 2025 to 2035

Thank you!
You will receive an email from our Business Development Manager. Please be sure to check your SPAM/JUNK folder too.
Chat With
MaRIA