Fire Hose Market Outlook and Forecast 2025 to 2035

The global fire hose market is anticipated to expand at a CAGR of 5.5%. The market is valued at USD 780.6 million in 2025 and is poised to reach USD 1,333.3 million by 2035. This growth is supported by rising fire safety regulations, increasing industrialization, and urban development across emerging economies.
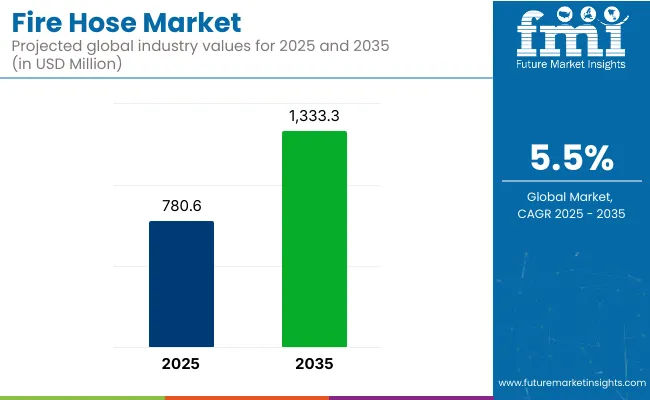
Fire Hose Market Quick Stats

  • Market Value (2025): USD 780.6 million
  • Forecast Value (2035): USD 1,333.3 million
  • Forecast CAGR: 5.5%
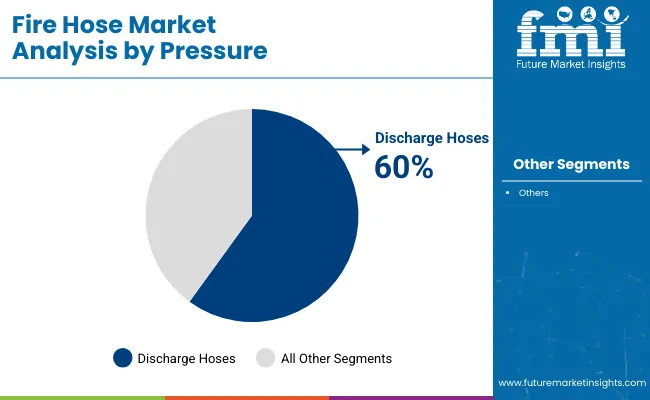
  • Top Pressure Segment (2025): Discharge Hoses (60% market share)
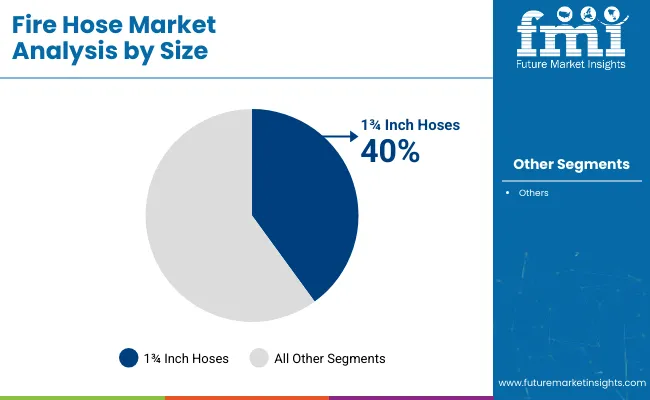
  • Leading Size Segment: 1 ¾ Inch Hoses (40% market share)
  • Key Growth Region: North America (USA is the fastest growing market with 5.7% CAGR)

Fire Hose Market

Metric Value
Industry Size (2025E) USD 780.6 million
Industry Value (2035F) USD 1,333.3 million
CAGR (2025 to 2035) 5.5%

Demand has been driven by government mandates, insurance compliance requirements, and the expanding use of fire suppression systems in smart infrastructure.Rapid advancements in lightweight and eco-friendly fire hose materials, along with the integration of IoT-based smart firefighting systems, are also contributing to market expansion. These technologies are being adopted to reduce maintenance costs, extend product lifespan, and improve emergency response effectiveness.

Government regulations focus on ensuring safety, performance, and reliability in firefighting operations. In the USA, NFPA 1961 sets design, construction, and testing requirements for fire hoses, while NFPA 14 specifies installation and maintenance standards for standpipe and hose systems. NFPA 1962 covers care, use, and inspection of fire hoses and related equipment.

Additionally, OSHA 1910.158 mandates protection against mechanical damage for standpipes and outlines equipment requirements. In Europe, 46 CFR 108.425 applies to fire hoses on vessels, detailing nozzle specifications and maintenance standards.

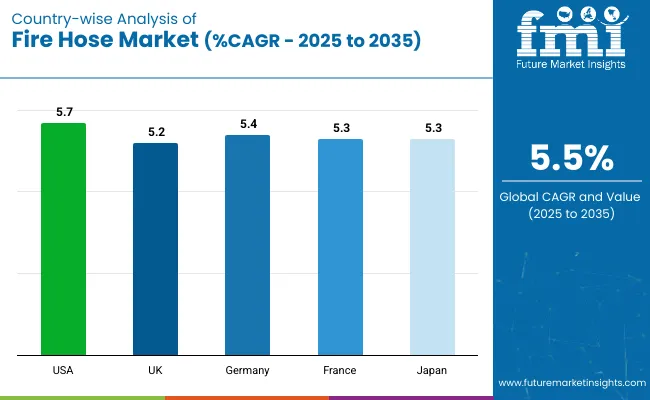
The USA fire hose market is projected to grow at a CAGR of 5.7%, driven by the modernization of fire departments and increased industrial fire risks. Discharge hoses will dominate the pressure segment, holding a 60% market share in 2025. The 1 ¾ inch hose size will lead the size segment with a 40% market share. Germany and France are also expected to experience strong growth, with projected CAGRs of 5.4% and 5.3%, respectively, fueled by increased industrial and municipal fire safety needs.

Analyzing Fire Hose Market by Top Investment Segments

The market is segmented into pressure, material used, size, and region.By pressure, the market is bifurcated into discharge hoses and suction hoses.Based on material used, the market is categorized into cotton, polyester, and nylon filament.In terms of size, the market is segmented into 1 ½ inch, 1 ¾ inch, and 2 ½ inch hoses.Regionally, the market is classified into North America, Latin America, Western Europe, Eastern Europe, East Asia, South Asia Pacific, Middle East and Africa.

Discharge Hoses to Lead the Pressure Segment with 60% Market Share

Discharge hoses are projected to lead the pressure segment, accounting for 60% of the global market share by 2025. These hoses have been recognized for their ability to handle high water pressure, making them essential in municipal firefighting, industrial plants, and emergency response operations.
  • Applications requiring rapid water discharge and extensive coverage have favored this segment for critical fire suppression efforts.
  • Discharge hoses have been constructed with lightweight, flexible materials, allowing ease of deployment in congested or vertical environments.
  • Compliance with stringent fire safety regulations such as NFPA 1961 has contributed to widespread adoption across developed regions.

Fire Hose Market Analysis By Pressure

Polyester to Lead the Material Segment with 40% Market Share

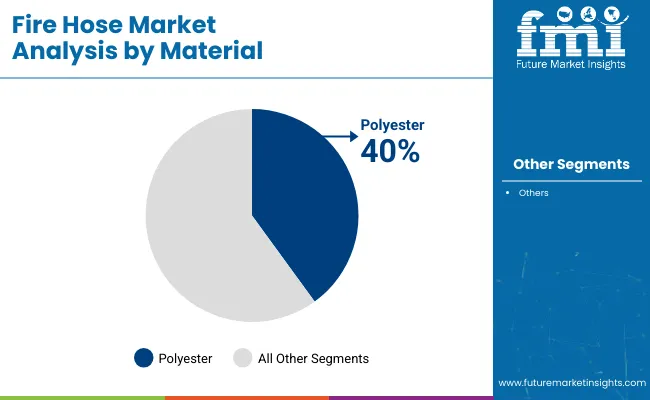
The polyester segment is expected to lead the material category, securing 40% of the global market share by 2025. Known for its high tensile strength and abrasion resistance, polyester has been extensively used in the production of fire hoses designed for demanding environments.
  • Polyester hoses have been favored due to their low water absorption and improved performance in humid and high-temperature conditions.
  • Their cost-effectiveness and recyclability have supported widespread use in municipal and industrial firefighting systems.

Fire Hose Market Analysis By Material

1 ¾ Inch Hoses to Lead the Size Segment with 40% Market Share

The 1 ¾ inch hose size is anticipated to dominate the size segment, capturing 40% of the global market share in 2025. This size has been considered ideal for its balance between maneuverability and water flow, making it a standard choice for municipal fire services and industrial use.
  • These hoses have been easily operated by small crews, especially in urban environments where space constraints are prevalent.
  • Compatibility with most firefighting nozzles and pump systems has enhanced their operational flexibility.
  • Their widespread acceptance has been driven by regulatory endorsements and integration into rapid-response firefighting protocols.

Fire Hose Market Analysis By Size

Top Fire Hose Market Dynamics

The fire hose market is experiencing robust expansion, driven by rising fire safety mandates, increased industrial risk preparedness, and continuous innovation in fire hose material technologies. Growth is supported by advancements in IoT-enabled fire suppression systems and the increasing integration of smart safety infrastructure in urban environments.

Recent Trends in the Fire Hose Market

  • The use of lightweight, heat-resistant, and flexible hose materials such as nitrile rubber and thermoplastic blends has accelerated.
  • Smart hoses with embedded pressure sensors and real-time monitoring capabilities are being increasingly adopted.
  • Fire safety protocols in commercial, residential, and industrial zones have been tightened, boosting procurement of advanced hose systems.

Challenges in the Fire Hose Market

  • High costs associated with hose maintenance and frequent replacements are being observed, especially in heavy-duty applications.
  • Fluctuating prices of synthetic raw materials such as rubber and polyester are creating instability in production costs.
  • Limited awareness and fire safety budget constraints in developing regions are continuing to hinder market penetration.

Analyzing Top Countries Exporting, Distributing, and Supplying Fire Hoses

USA Fire Hose Market Analysis

The USA fire hose market is expected to grow at a CAGR of 5.7% from 2025 to 2035. This growth is being driven by the modernization of fire departments, increasing industrial fire risks, and strict enforcement of NFPA fire safety regulations across commercial and residential infrastructure.
  • Strong demand has been noted from municipal and emergency firefighting agencies.
  • Construction of smart buildings has encouraged adoption of IoT-enabled fire suppression systems.
  • Federal and state funding has been allocated to upgrade public safety equipment.
  • High-performance, heat-resistant hose solutions have been developed for oil & gas and chemical sectors.

Country Wise Analysis Of Fire Hose Market Cagr 2025 To 2035

UK Fire Hose Sales Analysis

The UK fire hose market is projected to expand at a CAGR of 5.2% during the forecast period. Regulatory reform and intensified fire safety mandates following high-profile incidents have strengthened the need for certified, durable hose systems across industries and public infrastructure.

  • Demand has risen for fire hoses in commercial buildings and logistics parks.
  • Lightweight, flexible hose designs have been adopted to support agile emergency response.
  • Urban construction projects have accelerated demand for standardized safety gear.

Fire Hose Sales Analysis in Germany

Germany’s fire hose market is forecasted to grow at a CAGR of 5.4% from 2025 to 2035. As a central manufacturing and logistics hub, Germany has prioritized industrial-grade firefighting systems supported by robust EU safety standards and local enforcement policies.

  • High-pressure hose solutions have been adopted in the automotive and chemical sectors.
  • Local production of eco-compliant fire hose materials has been expanded.
  • Warehouse fire suppression systems have been upgraded with advanced hose units.
  • Municipal safety initiatives have received budget allocations for hose modernization.

Fire Hose Demand Analysis in France

France’s fire hose market are anticipated to grow at a CAGR of 5.3% during the forecast period. The country’s commitment to modernizing firefighting infrastructure and reducing emergency response times has stimulated demand for high-efficiency hose solutions.

  • Increased use of chemical-resistant hoses has been reported in the industrial sector.
  • Emphasis has been placed on meeting fire readiness benchmarks across rural and urban regions.
  • Lightweight hoses with corrosion-resistant linings have gained popularity in municipal deployments.
  • Government incentives for safety equipment upgrades have supported procurement trends.

Japan Fire Hose Market Analysis

Japan’s fire hose market is projected to expand at a CAGR of 5.3% through 2035. Owing to its earthquake-prone landscape and dense urban infrastructure, Japan has invested significantly in high-performance firefighting technologies, including pressure-sensitive and heat-durable hoses.

  • Hose demand has been supported by rapid smart city integration and disaster management planning.
  • Compact, maneuverable hose designs have been favored in high-rise firefighting.
  • Sensor-integrated fire hoses have been developed for early hazard detection.
  • Public safety campaigns and drills have driven awareness and equipment upgrades.

Leading Fire Hose Suppliers and Distributors

The fire hose market is moderately consolidated, with several established global manufacturers holding notable market shares, while regional and specialized suppliers continue to focus on innovation. Competitive strategies are being shaped by regulatory compliance, material science advancements, smart firefighting technologies, and strategic collaborations aimed at expanding production and geographic reach.

Tier-one companies such as Angus Fire Ltd., Dixon Valve & Coupling, National Fire Equipment Ltd., Armored Textiles Inc. (ATI), and All-American Hose LLC are competing through investments in R&D for heat-resistant and eco-friendly hose materials, digital integration into firefighting systems, and enhanced product customization. Manufacturing capabilities are being expanded globally, and long-term supply relationships with defense, municipal, and industrial clients are being established through strategic partnerships.

Recent Fire Hose Industry News

  • In May 2025, the Supreme™ II 1.75″ premium attack hose was unveiled by Snap‑tite Hose. It has onyx nitrile rubber liner, polyester double-jacket construction, and a standout two‑year all‑hazard warranty.
  • In May 2025, a Grant Services Support programme was launched by Snap‑tite Hose, designed to provide grant-writing assistance to over 27,000 fire departments across the United States.

Fire Hose Market Report Scope

Report Attributes Details
Current Total Market Size (2025) USD 780.6 million
Projected Market Size (2035) USD 1,333.3 million
CAGR (2025 to 2035) 5.5%
Base Year for Estimation 2024
Historical Period 2020 to 2024
Projections Period 2025 to 2035
Market Analysis Parameters Revenue in USD million / Volume in linear meters
By Pressure Type Discharge Hoses and Suction Hoses
By Material Used Cotton, Polyester, and Nylon Filament
By Size 1 ½ Inch, 1 ¾ Inch, and 2 ½ Inch
Regions Covered North America, Latin America, Western Europe, Eastern Europe, East Asia, South Asia Pacific, Middle East and Africa
Countries Covered United States, Canada, United Kingdom, Germany, France, China, Japan, South Korea, Brazil, Australia
Key Players Mercedes Textiles Limited, Kuriyama of America, Niedner Inc., Snap- tite Hose, Superior Corp., Richards Hose Ltd., Key Hose LLC, Tipsa Group, SABRE Fire Hose, BullDog Hose Company, and other major players.
Additional Attributes Dollar sales by value, market share analysis by region, and country-wise analysis

Key Segments

By Pressure:

In terms of Pressure, the industry is divided into Discharge Hoses, Suction Hoses

By Size:

In terms of Size, the industry is divided into 1 ½ inch, 1 ¾ inch, 2 ½ inch

By Region:

The report covers key regions, including North America, Latin America, Western Europe, Eastern Europe, East Asia, South Asia, and the Middle East and Africa (MEA).

Table of Content

  1. Executive Summary
  2. Industry Introduction, including Taxonomy and Market Definition
  3. Market Trends and Success Factors, including Macro-economic Factors, Market Dynamics, and Recent Industry Developments
  4. Global Market Demand Analysis 2020 to 2024 and Forecast 2025 to 2035, including Historical Analysis and Future Projections
  5. Pricing Analysis
  6. Global Market Analysis 2020 to 2024 and Forecast 2025 to 2035
    • Pressure
    • Size
  7. Global Market Analysis 2020 to 2024 and Forecast 2025 to 2035, By Pressure
    • Discharge Hoses
    • Suction Hoses
  8. Global Market Analysis 2020 to 2024 and Forecast 2025 to 2035, By Size
    • 1 ½ inch
    • 1 ¾ inch
    • 2 ½ inch
  9. Global Market Analysis 2020 to 2024 and Forecast 2025 to 2035, By Region
    • North America
    • Latin America
    • Western Europe
    • Eastern Europe
    • East Asia
    • South Asia Pacific
    • Middle East and Africa
  10. North America Sales Analysis 2020 to 2024 and Forecast 2025 to 2035, by Key Segments and Countries
  11. Latin America Sales Analysis 2020 to 2024 and Forecast 2025 to 2035, by Key Segments and Countries
  12. Western Europe Sales Analysis 2020 to 2024 and Forecast 2025 to 2035, by Key Segments and Countries
  13. Eastern Europe Sales Analysis 2020 to 2024 and Forecast 2025 to 2035, by Key Segments and Countries
  14. East Asia Sales Analysis 2020 to 2024 and Forecast 2025 to 2035, by Key Segments and Countries
  15. South Asia Pacific Sales Analysis 2020 to 2024 and Forecast 2025 to 2035, by Key Segments and Countries
  16. Middle East and Africa Sales Analysis 2020 to 2024 and Forecast 2025 to 2035, by Key Segments and Countries
  17. Sales Forecast 2025 to 2035 by Pressure, Material Used, and Size for 30 Countries
  18. Competition Outlook, including Market Structure Analysis, Company Share Analysis by Key Players, and Competition Dashboard
  19. Company Profile
    • Mercedes Textiles Limited
    • Kuriyama of America
    • Niedner Inc.
    • Snap-tite Hose
    • Superior Corp.
    • Richards Hose Ltd.
    • Key Hose LLC
    • Tipsa Group
    • SABRE Fire Hose
    • BullDog Hose Company
    • Other Major Players

List of Tables

  • Table 1: Global Market Value (USD Million) Forecast by Region, 2020 to 2035
  • Table 2: Global Market Volume (Linear meters) Forecast by Region, 2020 to 2035
  • Table 3: Global Market Value (USD Million) Forecast by Pressure, 2020 to 2035
  • Table 4: Global Market Volume (Linear meters) Forecast by Pressure, 2020 to 2035
  • Table 5: Global Market Value (USD Million) Forecast by Material Used, 2020 to 2035
  • Table 6: Global Market Volume (Linear meters) Forecast by Material Used, 2020 to 2035
  • Table 7: Global Market Value (USD Million) Forecast by Size, 2020 to 2035
  • Table 8: Global Market Volume (Linear meters) Forecast by Size, 2020 to 2035
  • Table 9: North America Market Value (USD Million) Forecast by Country, 2020 to 2035
  • Table 10: North America Market Volume (Linear meters) Forecast by Country, 2020 to 2035
  • Table 11: North America Market Value (USD Million) Forecast by Pressure, 2020 to 2035
  • Table 12: North America Market Volume (Linear meters) Forecast by Pressure, 2020 to 2035
  • Table 13: North America Market Value (USD Million) Forecast by Material Used, 2020 to 2035
  • Table 14: North America Market Volume (Linear meters) Forecast by Material Used, 2020 to 2035
  • Table 15: North America Market Value (USD Million) Forecast by Size, 2020 to 2035
  • Table 16: North America Market Volume (Linear meters) Forecast by Size, 2020 to 2035
  • Table 17: Latin America Market Value (USD Million) Forecast by Country, 2020 to 2035
  • Table 18: Latin America Market Volume (Linear meters) Forecast by Country, 2020 to 2035
  • Table 19: Latin America Market Value (USD Million) Forecast by Pressure, 2020 to 2035
  • Table 20: Latin America Market Volume (Linear meters) Forecast by Pressure, 2020 to 2035
  • Table 21: Latin America Market Value (USD Million) Forecast by Material Used, 2020 to 2035
  • Table 22: Latin America Market Volume (Linear meters) Forecast by Material Used, 2020 to 2035
  • Table 23: Latin America Market Value (USD Million) Forecast by Size, 2020 to 2035
  • Table 24: Latin America Market Volume (Linear meters) Forecast by Size, 2020 to 2035
  • Table 25: Western Europe Market Value (USD Million) Forecast by Country, 2020 to 2035
  • Table 26: Western Europe Market Volume (Linear meters) Forecast by Country, 2020 to 2035
  • Table 27: Western Europe Market Value (USD Million) Forecast by Pressure, 2020 to 2035
  • Table 28: Western Europe Market Volume (Linear meters) Forecast by Pressure, 2020 to 2035
  • Table 29: Western Europe Market Value (USD Million) Forecast by Material Used, 2020 to 2035
  • Table 30: Western Europe Market Volume (Linear meters) Forecast by Material Used, 2020 to 2035
  • Table 31: Western Europe Market Value (USD Million) Forecast by Size, 2020 to 2035
  • Table 32: Western Europe Market Volume (Linear meters) Forecast by Size, 2020 to 2035
  • Table 33: Eastern Europe Market Value (USD Million) Forecast by Country, 2020 to 2035
  • Table 34: Eastern Europe Market Volume (Linear meters) Forecast by Country, 2020 to 2035
  • Table 35: Eastern Europe Market Value (USD Million) Forecast by Pressure, 2020 to 2035
  • Table 36: Eastern Europe Market Volume (Linear meters) Forecast by Pressure, 2020 to 2035
  • Table 37: Eastern Europe Market Value (USD Million) Forecast by Material Used, 2020 to 2035
  • Table 38: Eastern Europe Market Volume (Linear meters) Forecast by Material Used, 2020 to 2035
  • Table 39: Eastern Europe Market Value (USD Million) Forecast by Size, 2020 to 2035
  • Table 40: Eastern Europe Market Volume (Linear meters) Forecast by Size, 2020 to 2035
  • Table 41: East Asia Market Value (USD Million) Forecast by Country, 2020 to 2035
  • Table 42: East Asia Market Volume (Linear meters) Forecast by Country, 2020 to 2035
  • Table 43: East Asia Market Value (USD Million) Forecast by Pressure, 2020 to 2035
  • Table 44: East Asia Market Volume (Linear meters) Forecast by Pressure, 2020 to 2035
  • Table 45: East Asia Market Value (USD Million) Forecast by Material Used, 2020 to 2035
  • Table 46: East Asia Market Volume (Linear meters) Forecast by Material Used, 2020 to 2035
  • Table 47: East Asia Market Value (USD Million) Forecast by Size, 2020 to 2035
  • Table 48: East Asia Market Volume (Linear meters) Forecast by Size, 2020 to 2035
  • Table 49: South Asia & Pacific Market Value (USD Million) Forecast by Country, 2020 to 2035
  • Table 50: South Asia & Pacific Market Volume (Linear meters) Forecast by Country, 2020 to 2035
  • Table 51: South Asia & Pacific Market Value (USD Million) Forecast by Pressure, 2020 to 2035
  • Table 52: South Asia & Pacific Market Volume (Linear meters) Forecast by Pressure, 2020 to 2035
  • Table 53: South Asia & Pacific Market Value (USD Million) Forecast by Material Used, 2020 to 2035
  • Table 54: South Asia & Pacific Market Volume (Linear meters) Forecast by Material Used, 2020 to 2035
  • Table 55: South Asia & Pacific Market Value (USD Million) Forecast by Size, 2020 to 2035
  • Table 56: South Asia & Pacific Market Volume (Linear meters) Forecast by Size, 2020 to 2035
  • Table 57: Middle East and Africa Market Value (USD Million) Forecast by Country, 2020 to 2035
  • Table 58: Middle East and Africa Market Volume (Linear meters) Forecast by Country, 2020 to 2035
  • Table 59: Middle East and Africa Market Value (USD Million) Forecast by Pressure, 2020 to 2035
  • Table 60: Middle East and Africa Market Volume (Linear meters) Forecast by Pressure, 2020 to 2035
  • Table 61: Middle East and Africa Market Value (USD Million) Forecast by Material Used, 2020 to 2035
  • Table 62: Middle East and Africa Market Volume (Linear meters) Forecast by Material Used, 2020 to 2035
  • Table 63: Middle East and Africa Market Value (USD Million) Forecast by Size, 2020 to 2035
  • Table 64: Middle East and Africa Market Volume (Linear meters) Forecast by Size, 2020 to 2035

List of Figures

  • Figure 1: Global Market Volume (Linear meters) Forecast 2020 to 2035
  • Figure 2: Global Market Pricing Analysis
  • Figure 3: Global Market Value (USD Million) Forecast 2020 to 2035
  • Figure 4: Global Market Value Share and BPS Analysis by Pressure, 2025 and 2035
  • Figure 5: Global Market Y-o-Y Growth Comparison by Pressure, 2025 to 2035
  • Figure 6: Global Market Attractiveness Analysis by Pressure
  • Figure 7: Global Market Value Share and BPS Analysis by Material Used, 2025 and 2035
  • Figure 8: Global Market Y-o-Y Growth Comparison by Material Used, 2025 to 2035
  • Figure 9: Global Market Attractiveness Analysis by Material Used
  • Figure 10: Global Market Value Share and BPS Analysis by Size, 2025 and 2035
  • Figure 11: Global Market Y-o-Y Growth Comparison by Size, 2025 to 2035
  • Figure 12: Global Market Attractiveness Analysis by Size
  • Figure 13: Global Market Value (USD Million) Share and BPS Analysis by Region, 2025 and 2035
  • Figure 14: Global Market Y-o-Y Growth Comparison by Region, 2025 to 2035
  • Figure 15: Global Market Attractiveness Analysis by Region
  • Figure 16: North America Market Incremental $ Opportunity, 2025 to 2035
  • Figure 17: Latin America Market Incremental $ Opportunity, 2025 to 2035
  • Figure 18: Western Europe Market Incremental $ Opportunity, 2025 to 2035
  • Figure 19: Eastern Europe Market Incremental $ Opportunity, 2025 to 2035
  • Figure 20: East Asia Market Incremental $ Opportunity, 2025 to 2035
  • Figure 21: South Asia & Pacific Market Incremental $ Opportunity, 2025 to 2035
  • Figure 22: Middle East and Africa Market Incremental $ Opportunity, 2025 to 2035
  • Figure 23: North America Market Value Share and BPS Analysis by Country, 2025 and 2035
  • Figure 24: North America Market Value Share and BPS Analysis by Pressure, 2025 and 2035
  • Figure 25: North America Market Y-o-Y Growth Comparison by Pressure, 2025 to 2035
  • Figure 26: North America Market Attractiveness Analysis by Pressure
  • Figure 27: North America Market Value Share and BPS Analysis by Material Used, 2025 and 2035
  • Figure 28: North America Market Y-o-Y Growth Comparison by Material Used, 2025 to 2035
  • Figure 29: North America Market Attractiveness Analysis by Material Used
  • Figure 30: North America Market Value Share and BPS Analysis by Size, 2025 and 2035
  • Figure 31: North America Market Y-o-Y Growth Comparison by Size, 2025 to 2035
  • Figure 32: North America Market Attractiveness Analysis by Size
  • Figure 33: Latin America Market Value Share and BPS Analysis by Country, 2025 and 2035
  • Figure 34: Latin America Market Value Share and BPS Analysis by Pressure, 2025 and 2035
  • Figure 35: Latin America Market Y-o-Y Growth Comparison by Pressure, 2025 to 2035
  • Figure 36: Latin America Market Attractiveness Analysis by Pressure
  • Figure 37: Latin America Market Value Share and BPS Analysis by Material Used, 2025 and 2035
  • Figure 38: Latin America Market Y-o-Y Growth Comparison by Material Used, 2025 to 2035
  • Figure 39: Latin America Market Attractiveness Analysis by Material Used
  • Figure 40: Latin America Market Value Share and BPS Analysis by Size, 2025 and 2035
  • Figure 41: Latin America Market Y-o-Y Growth Comparison by Size, 2025 to 2035
  • Figure 42: Latin America Market Attractiveness Analysis by Size
  • Figure 43: Western Europe Market Value Share and BPS Analysis by Country, 2025 and 2035
  • Figure 44: Western Europe Market Value Share and BPS Analysis by Pressure, 2025 and 2035
  • Figure 45: Western Europe Market Y-o-Y Growth Comparison by Pressure, 2025 to 2035
  • Figure 46: Western Europe Market Attractiveness Analysis by Pressure
  • Figure 47: Western Europe Market Value Share and BPS Analysis by Material Used, 2025 and 2035
  • Figure 48: Western Europe Market Y-o-Y Growth Comparison by Material Used, 2025 to 2035
  • Figure 49: Western Europe Market Attractiveness Analysis by Material Used
  • Figure 50: Western Europe Market Value Share and BPS Analysis by Size, 2025 and 2035
  • Figure 51: Western Europe Market Y-o-Y Growth Comparison by Size, 2025 to 2035
  • Figure 52: Western Europe Market Attractiveness Analysis by Size
  • Figure 53: Eastern Europe Market Value Share and BPS Analysis by Country, 2025 and 2035
  • Figure 54: Eastern Europe Market Value Share and BPS Analysis by Pressure, 2025 and 2035
  • Figure 55: Eastern Europe Market Y-o-Y Growth Comparison by Pressure, 2025 to 2035
  • Figure 56: Eastern Europe Market Attractiveness Analysis by Pressure
  • Figure 57: Eastern Europe Market Value Share and BPS Analysis by Material Used, 2025 and 2035
  • Figure 58: Eastern Europe Market Y-o-Y Growth Comparison by Material Used, 2025 to 2035
  • Figure 59: Eastern Europe Market Attractiveness Analysis by Material Used
  • Figure 60: Eastern Europe Market Value Share and BPS Analysis by Size, 2025 and 2035
  • Figure 61: Eastern Europe Market Y-o-Y Growth Comparison by Size, 2025 to 2035
  • Figure 62: Eastern Europe Market Attractiveness Analysis by Size
  • Figure 63: East Asia Market Value Share and BPS Analysis by Country, 2025 and 2035
  • Figure 64: East Asia Market Value Share and BPS Analysis by Pressure, 2025 and 2035
  • Figure 65: East Asia Market Y-o-Y Growth Comparison by Pressure, 2025 to 2035
  • Figure 66: East Asia Market Attractiveness Analysis by Pressure
  • Figure 67: East Asia Market Value Share and BPS Analysis by Material Used, 2025 and 2035
  • Figure 68: East Asia Market Y-o-Y Growth Comparison by Material Used, 2025 to 2035
  • Figure 69: East Asia Market Attractiveness Analysis by Material Used
  • Figure 70: East Asia Market Value Share and BPS Analysis by Size, 2025 and 2035
  • Figure 71: East Asia Market Y-o-Y Growth Comparison by Size, 2025 to 2035
  • Figure 72: East Asia Market Attractiveness Analysis by Size
  • Figure 73: South Asia & Pacific Market Value Share and BPS Analysis by Country, 2025 and 2035
  • Figure 74: South Asia & Pacific Market Value Share and BPS Analysis by Pressure, 2025 and 2035
  • Figure 75: South Asia & Pacific Market Y-o-Y Growth Comparison by Pressure, 2025 to 2035
  • Figure 76: South Asia & Pacific Market Attractiveness Analysis by Pressure
  • Figure 77: South Asia & Pacific Market Value Share and BPS Analysis by Material Used, 2025 and 2035
  • Figure 78: South Asia & Pacific Market Y-o-Y Growth Comparison by Material Used, 2025 to 2035
  • Figure 79: South Asia & Pacific Market Attractiveness Analysis by Material Used
  • Figure 80: South Asia & Pacific Market Value Share and BPS Analysis by Size, 2025 and 2035
  • Figure 81: South Asia & Pacific Market Y-o-Y Growth Comparison by Size, 2025 to 2035
  • Figure 82: South Asia & Pacific Market Attractiveness Analysis by Size
  • Figure 83: Middle East and Africa Market Value Share and BPS Analysis by Country, 2025 and 2035
  • Figure 84: Middle East and Africa Market Value Share and BPS Analysis by Pressure, 2025 and 2035
  • Figure 85: Middle East and Africa Market Y-o-Y Growth Comparison by Pressure, 2025 to 2035
  • Figure 86: Middle East and Africa Market Attractiveness Analysis by Pressure
  • Figure 87: Middle East and Africa Market Value Share and BPS Analysis by Material Used, 2025 and 2035
  • Figure 88: Middle East and Africa Market Y-o-Y Growth Comparison by Material Used, 2025 to 2035
  • Figure 89: Middle East and Africa Market Attractiveness Analysis by Material Used
  • Figure 90: Middle East and Africa Market Value Share and BPS Analysis by Size, 2025 and 2035
  • Figure 91: Middle East and Africa Market Y-o-Y Growth Comparison by Size, 2025 to 2035
  • Figure 92: Middle East and Africa Market Attractiveness Analysis by Size
  • Figure 93: Global Market - Tier Structure Analysis
  • Figure 94: Global Market - Company Share Analysis

Frequently Asked Questions

What is the projected size of the fire hose market in 2025?

The fire hose market is valued at USD 780.6 million in 2025.

What is the outlook on fire hose demand by 2035?

The market is forecasted to reach USD 1,333.3 million by 2035, reflecting a CAGR of 5.5%.

Which pressure type leads the fire hose market by segment in 2025?

Discharge hoses will lead the market by pressure type, holding a 60% market share in 2025.

What is the top hose size segment for the fire hose market in 2025?

The 1 ¾ inch hose segment will dominate the market with a 40% market share in 2025.

Which country is projected to have the fastest-growing fire hose market?

The USA is projected to grow at the fastest rate, with a CAGR of 5.7% from 2025 to 2035.

Explore Similar Insights

Future Market Insights

Fire Hose Market