Fire Stopping Material Market Size and Share Forecast Outlook (2024 to 2034)

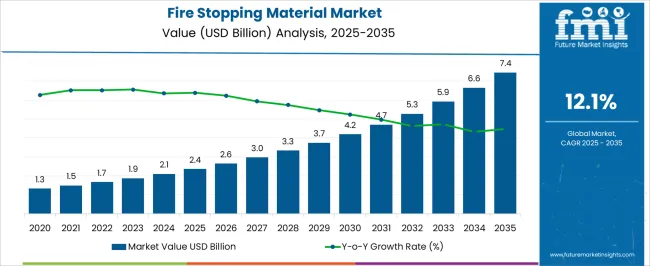
The fire stopping material market is expected to be valued at USD 2.1 billion in 2024 and reach USD 6.5 billion by 2034. The market is projected to register a CAGR of 12.2% over the forecast period.

Key Market Drivers

The market generated an estimated revenue of USD 1.0 billion in 2019. The market grew at a CAGR of 16.00% from 2019 to 2023. Several reasons can be attributed to this growth:

  • Growing awareness among builders, architects, and end users about the critical importance of fire safety measures in construction projects
  • Rapid urbanization and infrastructure development, especially in emerging economies such as India, China, Brazil, Japan, etc.
  • Continuous advancements in fire-stopping technologies and materials, offering improved performance and ease of installation
  • The rise in fire-related accidents globally is creating awareness about the need for robust fire protection measures
  • The growing trend of constructing high-rise buildings and complex structures prompted the increased use of advanced fire-stopping materials to address these specific requirements
  • The global emphasis on sustainable and resilient construction practices led to the incorporation of fire-stopping materials as part of comprehensive safety and environmental strategies in building projects
  • Rising investments in the real estate sector globally, coupled with a growing demand for quality construction materials
Attributes Key Statistics
Fire Stopping Material Market Value (2024) USD 2.1 billion
Anticipated Market Value (2034) USD 6.5 billion
Estimated Growth (2024 to 2034) 12.2% CAGR

Consumption Trends in the Fire Stopping Material Industry

  • The market is experiencing increasing demand from builders and construction companies. These companies incorporate these materials into the construction process to comply with safety regulations and enhance the overall fire resistance of buildings.
  • The adoption of fire stopping materials is also widespread among professionals involved in designing and planning buildings to ensure that fire safety is integrated into the structural elements of a project.
  • There is rising adoption of fire stopping materials in government agencies and regulatory bodies that set standards and codes that mandate using fire stopping materials in construction projects.
  • The use of fire stopping material is also growing among contract research organizations as they rely on it for outsourced research and development activities across the pharmaceutical and biotechnology sectors.
  • The growing adoption of fire stopping material is also observed in institutions, such as schools, universities, and healthcare facilities, to enhance the fire resistance of their buildings.

Key Restraints Impacting the Fire Stopping Material Market

The fire stopping material market is anticipated to surpass a global valuation of USD 6.5 billion by 2034, expanding at a 12.2% CAGR. While the market is expected to experience remarkable growth, several restraining factors could adversely affect its development:

  • The initial costs associated with the purchase and installation of advanced fire-stopping materials are the biggest hurdle for budget-conscious construction projects, potentially slowing market growth.
  • The limited awareness among some builders and stakeholders about the benefits and necessity of fire stopping materials also hinders the market’s growth.
  • Concerns about the visual impact of fire stopping materials on the aesthetics of buildings may influence some architects and builders to opt for alternative solutions
  • The emergence of alternative fire safety technologies or materials, such as advanced sprinkler systems, intumescent coatings, and gaseous fire suppressions, also diverts attention and investment away from traditional fire stopping materials, affecting their market share and growth.

Fire Stopping Material Industry Analysis by Top Investment Segments

Sealants Gaining Momentum in the Construction and Infrastructure Development Sector

Attributes Details
Top Type Sealants
CAGR (2024 to 2034) 12.00%

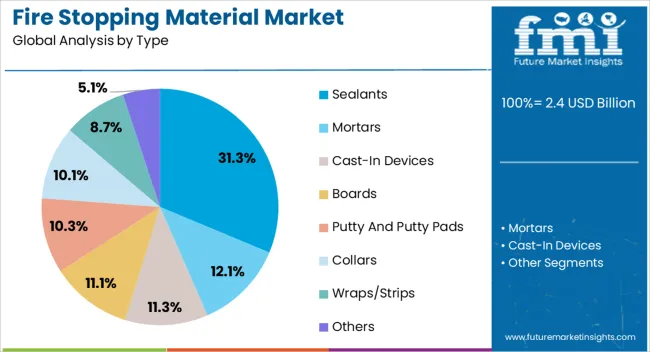
Depending on the type, the fire stopping material market is bifurcated into sealants, mortar, boards, etc. The sealants segment dominates the market, growing at a CAGR of 12.0% through 2034.

  • The significance of sealants in the construction and infrastructural development sector is rising as they are often used to create fire barriers by sealing joints, gaps, and penetrations in building elements. This helps prevent the spread of fire, smoke, and toxic gases between compartments.
  • Sealants are versatile and can be used in various applications, including sealing joints, gaps, and cracks in different surfaces. Their demand in a broad spectrum of industries is because they adapt well to different materials and substrates, making them suitable for various construction and industrial purposes.
  • Sealants also exhibit considerable flexibility, allowing them to accommodate movement and expansion/contraction of building materials. This flexibility makes them suitable for areas prone to temperature variations or structural movement.

Extensive Electrical Applications of Fire Stopping Materials

Attributes Details
Top Applications Electrical
CAGR (2024 to 2034) 11.8%

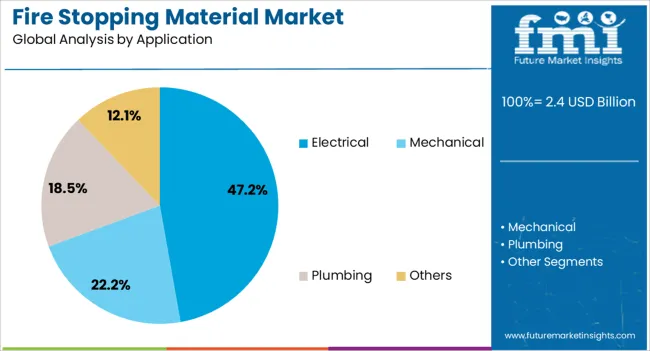
Based on applications, the fire stopping material market is categorized into electrical, mechanical, plumbing, etc. The electrical segment dominates the market and is anticipated to grow at a CAGR of 11.8% through 2034.

  • Fire safety materials are becoming increasingly popular in the electrical sector as they are used to seal openings around electrical penetrations such as conduits, cables, and wiring as they pass through fire-rated walls or floors. This helps prevent the spread of fire and smoke between compartments, maintaining fire containment.
  • The reliance on fire safety materials for the integrity of fire-rated structures has increased their demand in the construction and infrastructure development sector.
  • Fire safety materials are also in great demand as they help prevent the transmission of smoke and toxic gases through openings created by electrical conduits or cable penetrations.

Analysis of Top Countries Using Fire Stopping Materials

The section provides an analysis of the fire stopping material market by country, including Japan, China, the United States, South Korea, and the United Kingdom. The table presents the CAGRs for each country through 2034.

Countries CAGR (2024 to 2034)
South Korea 14.20%
Japan 13.80%
United Kingdom 13.20%
China 12.80%
United States 12.50%

Fire Stopping Material Market in South Korea

South Korea is one of the leading countries in this market. The South Korean fire stopping material market is anticipated to retain its dominance by progressing at a CAGR of 14.20% till 2034.

  • The country's widespread industrial growth, including the manufacturing and technology sectors, has increased demand for fire stopping materials to enhance safety measures in industrial facilities.
  • The South Korean market is also growing due to rising construction activities driven by infrastructure development projects, residential building construction, and commercial real estate expansion.

Fire Stopping Material Market in Japan

Japan is another Asian country leading the fire stopping material market. The Japanese market is anticipated to retain its dominance by progressing at an annual growth rate of 13.80% till 2034.

  • Japan's market is growing due to a significant focus on renovation activities, where fire stopping materials are adopted to upgrade existing structures and ensure compliance with modern safety standards.
  • Besides this, the Japanese islands are also prone to frequent tsunamis and earthquakes yearly. This has also surged the adoption of fire stopping materials as they contribute to overall safety and resilience in the face of earthquakes and other calamities.

Fire Stopping Material Market in the United Kingdom

In the European region, the United Kingdom dominates the fire stopping material market. The United Kingdom market is anticipated to exhibit an annual growth rate of 13.20% through 2034.

  • The last few years have seen tremendous construction projects in the country. This has necessitated the widespread adoption of fire stopping materials to address the unique fire safety challenges associated with vertical constructions.
  • The United Kingdom fire stopping material market is also growing due to a rising emphasis on retrofitting existing structures for improved fire safety.

Fire Stopping Material Market in China

China is another country leading the market in the Asian region. The Chinese fire stopping material market is anticipated to register a CAGR of 12.80% through 2034.

  • China's construction industry, in the last few years, has experienced significant growth, with numerous infrastructure projects and urban development initiatives. This has led to a rising demand for fire-stopping materials in both residential and commercial construction.
  • The Chinese government's increasing emphasis on safety standards in construction projects and the implementation of stringent building codes are also driving the adoption of fire-stopping materials to enhance overall safety levels.

Fire Stopping Material Market in the United States

In the North American region, the United States leads the market. Over the next ten years, the demand for fire stopping material is projected to rise at a 12.50% CAGR.
  • There is a growing awareness among builders and property owners in the USA about the importance of fire safety. This desire for risk mitigation has led to increased adoption of fire-stopping materials.
  • The expansion of the commercial construction sector, including office buildings, shopping malls, and industrial facilities, has fueled the demand for fire-stopping materials to meet safety requirements in these diverse projects.

Competitive Landscape of the Fire Stopping Material Market

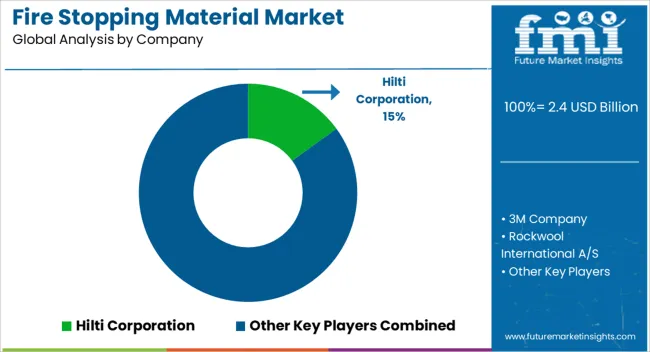
Hilti Corporation, 3M Company, Rockwool International A/S, BASF SE, Specified Technologies Inc. (STI), H. B. Fuller Company, and RectorSeal LLC are key players in the fire stopping materials market. These companies have expanded and diversified their product offerings to cater to a wide range of applications and provide comprehensive solutions for various industries, including construction, infrastructure, and manufacturing. Besides this, they are also adopting emerging technologies in manufacturing, such as automation and advanced material science, to stay competitive and maintain efficiency in production processes.

Recent Developments

  • In September 2023, scientists in the United States successfully developed a silicon-based coating to impede the spread of fires by hindering materials from contacting flames. The coating, designed to reduce combustion at the molecular level, addresses the complexity of fire, as explained by Professor Martin Thuo of North Carolina State University.
  • In January 2022, Australian and Chinese researchers developed an innovative flame retardant coating inspired by lava. Applied to materials like foam insulation, the coating forms a ceramic layer when exposed to heat, halting flames effectively and offering a cheap, nontoxic solution for enhanced building fire safety.
  • In May 2020, Roxtec introduced the GK Firestop sealing kit, providing efficient certified fire protection above the waterline for marine and offshore applications. With lightweight, halogen-free materials, the kit addresses shipyards' need to seal cables in deck and bulkhead entries, offering a solution for high cable density.

Leading Companies in the Fire Stopping Material Industry

  • Hilti Corporation
  • 3M Company
  • Rockwool International A/S
  • BASF SE
  • Specified Technologies Inc. (STI)
  • H. B. Fuller Company
  • RectorSeal LLC
  • STI Firestop
  • Promat International
  • Metacaulk (a product line of RectorSeal)
  • Everbuild Building Products Ltd.
  • Ruskin Company
  • Roxul Inc. (now known as Rockwool)
  • Emerson Electric Co. (Formerly known as Nelson Firestop)
  • Fosroc International Limited
  • FlameStop Australia Pty Ltd.
  • Rheinzink
  • Lloyd Industries Inc.
  • Fendolite (India) Limited
  • R. Brothers Waterproofing Industries Pvt. Ltd.

Top Segments Studied in the Fire Stopping Material Market

By Type:

  • Mortars
  • Sealants
  • Cast-in devices
  • Boards
  • Putty and Putty Pads
  • Collars
  • Wraps/strips
  • Others

By Application:

  • Electrical
  • Mechanical
  • Plumbing
  • Others

By End Use:

  • Commercial
  • Industrial
  • Residential

By Region:

  • North America
  • Latin America
  • Europe
  • Asia Pacific
  • Middle East and Africa

Table of Content

  • 1. Executive Summary
  • 2. Market Overview
  • 3. Market Background
  • 4. Global Market Analysis 2019 to 2023 and Forecast, 2024 to 2034
  • 5. Global Market Analysis 2019 to 2023 and Forecast 2024 to 2034, By Type
    • 5.1. Sealants
    • 5.2. Mortar
    • 5.3. Boards
    • 5.4. Others
  • 6. Global Market Analysis 2019 to 2023 and Forecast 2024 to 2034, By Application
    • 6.1. Electrical
    • 6.2. Mechanical
    • 6.3. Plumbing
  • 7. Global Market Analysis 2019 to 2023 and Forecast 2024 to 2034, By End-User
    • 7.1. Residential
    • 7.2. Commercial
    • 7.3. Industrial
  • 8. Global Market Analysis 2019 to 2023 and Forecast 2024 to 2034, By Region
    • 8.1. North America
    • 8.2. Latin America
    • 8.3. Western Europe
    • 8.4. Eastern Europe
    • 8.5. South Asia and Pacific
    • 8.6. East Asia
    • 8.7. Middle East and Africa
  • 9. North America Market Analysis 2019 to 2023 and Forecast 2024 to 2034, By Country
  • 10. Latin America Market Analysis 2019 to 2023 and Forecast 2024 to 2034, By Country
  • 11. Western Europe Market Analysis 2019 to 2023 and Forecast 2024 to 2034, By Country
  • 12. Eastern Europe Market Analysis 2019 to 2023 and Forecast 2024 to 2034, By Country
  • 13. South Asia and Pacific Market Analysis 2019 to 2023 and Forecast 2024 to 2034, By Country
  • 14. East Asia Market Analysis 2019 to 2023 and Forecast 2024 to 2034, By Country
  • 15. Middle East and Africa Market Analysis 2019 to 2023 and Forecast 2024 to 2034, By Country
  • 16. Key Countries Market Analysis
  • 17. Market Structure Analysis
  • 18. Competition Analysis
    • 18.1. RECTORSEAL CORPORATION
    • 18.2. SPECIFIED TECHNOLOGIES, INC
    • 18.3. HILTI GROUP
    • 18.4. BASF SE
    • 18.5. RPM INTERNATIONAL, INC
    • 18.6. 3M Company
    • 18.7. SIKA AG
    • 18.8. MORGAN ADVANCED MATERIALS
    • 18.9. KNAUF INSULATION
    • 18.10. ETEX GROUP
  • 19. Assumptions & Acronyms Used
  • 20. Research Methodology

List of Tables

Table 1: Global Market Value (US$ Million) Forecast by Region, 2019 to 2034

Table 2: Global Market Value (US$ Million) Forecast by Type, 2019 to 2034

Table 3: Global Market Value (US$ Million) Forecast by Application, 2019 to 2034

Table 4: Global Market Value (US$ Million) Forecast by End-User, 2019 to 2034

Table 5: North America Market Value (US$ Million) Forecast by Country, 2019 to 2034

Table 6: North America Market Value (US$ Million) Forecast by Type, 2019 to 2034

Table 7: North America Market Value (US$ Million) Forecast by Application, 2019 to 2034

Table 8: North America Market Value (US$ Million) Forecast by End-User, 2019 to 2034

Table 9: Latin America Market Value (US$ Million) Forecast by Country, 2019 to 2034

Table 10: Latin America Market Value (US$ Million) Forecast by Type, 2019 to 2034

Table 11: Latin America Market Value (US$ Million) Forecast by Application, 2019 to 2034

Table 12: Latin America Market Value (US$ Million) Forecast by End-User, 2019 to 2034

Table 13: Western Europe Market Value (US$ Million) Forecast by Country, 2019 to 2034

Table 14: Western Europe Market Value (US$ Million) Forecast by Type, 2019 to 2034

Table 15: Western Europe Market Value (US$ Million) Forecast by Application, 2019 to 2034

Table 16: Western Europe Market Value (US$ Million) Forecast by End-User, 2019 to 2034

Table 17: Eastern Europe Market Value (US$ Million) Forecast by Country, 2019 to 2034

Table 18: Eastern Europe Market Value (US$ Million) Forecast by Type, 2019 to 2034

Table 19: Eastern Europe Market Value (US$ Million) Forecast by Application, 2019 to 2034

Table 20: Eastern Europe Market Value (US$ Million) Forecast by End-User, 2019 to 2034

Table 21: South Asia and Pacific Market Value (US$ Million) Forecast by Country, 2019 to 2034

Table 22: South Asia and Pacific Market Value (US$ Million) Forecast by Type, 2019 to 2034

Table 23: South Asia and Pacific Market Value (US$ Million) Forecast by Application, 2019 to 2034

Table 24: South Asia and Pacific Market Value (US$ Million) Forecast by End-User, 2019 to 2034

Table 25: East Asia Market Value (US$ Million) Forecast by Country, 2019 to 2034

Table 26: East Asia Market Value (US$ Million) Forecast by Type, 2019 to 2034

Table 27: East Asia Market Value (US$ Million) Forecast by Application, 2019 to 2034

Table 28: East Asia Market Value (US$ Million) Forecast by End-User, 2019 to 2034

Table 29: Middle East and Africa Market Value (US$ Million) Forecast by Country, 2019 to 2034

Table 30: Middle East and Africa Market Value (US$ Million) Forecast by Type, 2019 to 2034

Table 31: Middle East and Africa Market Value (US$ Million) Forecast by Application, 2019 to 2034

Table 32: Middle East and Africa Market Value (US$ Million) Forecast by End-User, 2019 to 2034

List of Figures

Figure 1: Global Market Value (US$ Million) by Type, 2024 to 2034

Figure 2: Global Market Value (US$ Million) by Application, 2024 to 2034

Figure 3: Global Market Value (US$ Million) by End-User, 2024 to 2034

Figure 4: Global Market Value (US$ Million) by Region, 2024 to 2034

Figure 5: Global Market Value (US$ Million) Analysis by Region, 2019 to 2034

Figure 6: Global Market Value Share (%) and BPS Analysis by Region, 2024 to 2034

Figure 7: Global Market Y-o-Y Growth (%) Projections by Region, 2024 to 2034

Figure 8: Global Market Value (US$ Million) Analysis by Type, 2019 to 2034

Figure 9: Global Market Value Share (%) and BPS Analysis by Type, 2024 to 2034

Figure 10: Global Market Y-o-Y Growth (%) Projections by Type, 2024 to 2034

Figure 11: Global Market Value (US$ Million) Analysis by Application, 2019 to 2034

Figure 12: Global Market Value Share (%) and BPS Analysis by Application, 2024 to 2034

Figure 13: Global Market Y-o-Y Growth (%) Projections by Application, 2024 to 2034

Figure 14: Global Market Value (US$ Million) Analysis by End-User, 2019 to 2034

Figure 15: Global Market Value Share (%) and BPS Analysis by End-User, 2024 to 2034

Figure 16: Global Market Y-o-Y Growth (%) Projections by End-User, 2024 to 2034

Figure 17: Global Market Attractiveness by Type, 2024 to 2034

Figure 18: Global Market Attractiveness by Application, 2024 to 2034

Figure 19: Global Market Attractiveness by End-User, 2024 to 2034

Figure 20: Global Market Attractiveness by Region, 2024 to 2034

Figure 21: North America Market Value (US$ Million) by Type, 2024 to 2034

Figure 22: North America Market Value (US$ Million) by Application, 2024 to 2034

Figure 23: North America Market Value (US$ Million) by End-User, 2024 to 2034

Figure 24: North America Market Value (US$ Million) by Country, 2024 to 2034

Figure 25: North America Market Value (US$ Million) Analysis by Country, 2019 to 2034

Figure 26: North America Market Value Share (%) and BPS Analysis by Country, 2024 to 2034

Figure 27: North America Market Y-o-Y Growth (%) Projections by Country, 2024 to 2034

Figure 28: North America Market Value (US$ Million) Analysis by Type, 2019 to 2034

Figure 29: North America Market Value Share (%) and BPS Analysis by Type, 2024 to 2034

Figure 30: North America Market Y-o-Y Growth (%) Projections by Type, 2024 to 2034

Figure 31: North America Market Value (US$ Million) Analysis by Application, 2019 to 2034

Figure 32: North America Market Value Share (%) and BPS Analysis by Application, 2024 to 2034

Figure 33: North America Market Y-o-Y Growth (%) Projections by Application, 2024 to 2034

Figure 34: North America Market Value (US$ Million) Analysis by End-User, 2019 to 2034

Figure 35: North America Market Value Share (%) and BPS Analysis by End-User, 2024 to 2034

Figure 36: North America Market Y-o-Y Growth (%) Projections by End-User, 2024 to 2034

Figure 37: North America Market Attractiveness by Type, 2024 to 2034

Figure 38: North America Market Attractiveness by Application, 2024 to 2034

Figure 39: North America Market Attractiveness by End-User, 2024 to 2034

Figure 40: North America Market Attractiveness by Country, 2024 to 2034

Figure 41: Latin America Market Value (US$ Million) by Type, 2024 to 2034

Figure 42: Latin America Market Value (US$ Million) by Application, 2024 to 2034

Figure 43: Latin America Market Value (US$ Million) by End-User, 2024 to 2034

Figure 44: Latin America Market Value (US$ Million) by Country, 2024 to 2034

Figure 45: Latin America Market Value (US$ Million) Analysis by Country, 2019 to 2034

Figure 46: Latin America Market Value Share (%) and BPS Analysis by Country, 2024 to 2034

Figure 47: Latin America Market Y-o-Y Growth (%) Projections by Country, 2024 to 2034

Figure 48: Latin America Market Value (US$ Million) Analysis by Type, 2019 to 2034

Figure 49: Latin America Market Value Share (%) and BPS Analysis by Type, 2024 to 2034

Figure 50: Latin America Market Y-o-Y Growth (%) Projections by Type, 2024 to 2034

Figure 51: Latin America Market Value (US$ Million) Analysis by Application, 2019 to 2034

Figure 52: Latin America Market Value Share (%) and BPS Analysis by Application, 2024 to 2034

Figure 53: Latin America Market Y-o-Y Growth (%) Projections by Application, 2024 to 2034

Figure 54: Latin America Market Value (US$ Million) Analysis by End-User, 2019 to 2034

Figure 55: Latin America Market Value Share (%) and BPS Analysis by End-User, 2024 to 2034

Figure 56: Latin America Market Y-o-Y Growth (%) Projections by End-User, 2024 to 2034

Figure 57: Latin America Market Attractiveness by Type, 2024 to 2034

Figure 58: Latin America Market Attractiveness by Application, 2024 to 2034

Figure 59: Latin America Market Attractiveness by End-User, 2024 to 2034

Figure 60: Latin America Market Attractiveness by Country, 2024 to 2034

Figure 61: Western Europe Market Value (US$ Million) by Type, 2024 to 2034

Figure 62: Western Europe Market Value (US$ Million) by Application, 2024 to 2034

Figure 63: Western Europe Market Value (US$ Million) by End-User, 2024 to 2034

Figure 64: Western Europe Market Value (US$ Million) by Country, 2024 to 2034

Figure 65: Western Europe Market Value (US$ Million) Analysis by Country, 2019 to 2034

Figure 66: Western Europe Market Value Share (%) and BPS Analysis by Country, 2024 to 2034

Figure 67: Western Europe Market Y-o-Y Growth (%) Projections by Country, 2024 to 2034

Figure 68: Western Europe Market Value (US$ Million) Analysis by Type, 2019 to 2034

Figure 69: Western Europe Market Value Share (%) and BPS Analysis by Type, 2024 to 2034

Figure 70: Western Europe Market Y-o-Y Growth (%) Projections by Type, 2024 to 2034

Figure 71: Western Europe Market Value (US$ Million) Analysis by Application, 2019 to 2034

Figure 72: Western Europe Market Value Share (%) and BPS Analysis by Application, 2024 to 2034

Figure 73: Western Europe Market Y-o-Y Growth (%) Projections by Application, 2024 to 2034

Figure 74: Western Europe Market Value (US$ Million) Analysis by End-User, 2019 to 2034

Figure 75: Western Europe Market Value Share (%) and BPS Analysis by End-User, 2024 to 2034

Figure 76: Western Europe Market Y-o-Y Growth (%) Projections by End-User, 2024 to 2034

Figure 77: Western Europe Market Attractiveness by Type, 2024 to 2034

Figure 78: Western Europe Market Attractiveness by Application, 2024 to 2034

Figure 79: Western Europe Market Attractiveness by End-User, 2024 to 2034

Figure 80: Western Europe Market Attractiveness by Country, 2024 to 2034

Figure 81: Eastern Europe Market Value (US$ Million) by Type, 2024 to 2034

Figure 82: Eastern Europe Market Value (US$ Million) by Application, 2024 to 2034

Figure 83: Eastern Europe Market Value (US$ Million) by End-User, 2024 to 2034

Figure 84: Eastern Europe Market Value (US$ Million) by Country, 2024 to 2034

Figure 85: Eastern Europe Market Value (US$ Million) Analysis by Country, 2019 to 2034

Figure 86: Eastern Europe Market Value Share (%) and BPS Analysis by Country, 2024 to 2034

Figure 87: Eastern Europe Market Y-o-Y Growth (%) Projections by Country, 2024 to 2034

Figure 88: Eastern Europe Market Value (US$ Million) Analysis by Type, 2019 to 2034

Figure 89: Eastern Europe Market Value Share (%) and BPS Analysis by Type, 2024 to 2034

Figure 90: Eastern Europe Market Y-o-Y Growth (%) Projections by Type, 2024 to 2034

Figure 91: Eastern Europe Market Value (US$ Million) Analysis by Application, 2019 to 2034

Figure 92: Eastern Europe Market Value Share (%) and BPS Analysis by Application, 2024 to 2034

Figure 93: Eastern Europe Market Y-o-Y Growth (%) Projections by Application, 2024 to 2034

Figure 94: Eastern Europe Market Value (US$ Million) Analysis by End-User, 2019 to 2034

Figure 95: Eastern Europe Market Value Share (%) and BPS Analysis by End-User, 2024 to 2034

Figure 96: Eastern Europe Market Y-o-Y Growth (%) Projections by End-User, 2024 to 2034

Figure 97: Eastern Europe Market Attractiveness by Type, 2024 to 2034

Figure 98: Eastern Europe Market Attractiveness by Application, 2024 to 2034

Figure 99: Eastern Europe Market Attractiveness by End-User, 2024 to 2034

Figure 100: Eastern Europe Market Attractiveness by Country, 2024 to 2034

Figure 101: South Asia and Pacific Market Value (US$ Million) by Type, 2024 to 2034

Figure 102: South Asia and Pacific Market Value (US$ Million) by Application, 2024 to 2034

Figure 103: South Asia and Pacific Market Value (US$ Million) by End-User, 2024 to 2034

Figure 104: South Asia and Pacific Market Value (US$ Million) by Country, 2024 to 2034

Figure 105: South Asia and Pacific Market Value (US$ Million) Analysis by Country, 2019 to 2034

Figure 106: South Asia and Pacific Market Value Share (%) and BPS Analysis by Country, 2024 to 2034

Figure 107: South Asia and Pacific Market Y-o-Y Growth (%) Projections by Country, 2024 to 2034

Figure 108: South Asia and Pacific Market Value (US$ Million) Analysis by Type, 2019 to 2034

Figure 109: South Asia and Pacific Market Value Share (%) and BPS Analysis by Type, 2024 to 2034

Figure 110: South Asia and Pacific Market Y-o-Y Growth (%) Projections by Type, 2024 to 2034

Figure 111: South Asia and Pacific Market Value (US$ Million) Analysis by Application, 2019 to 2034

Figure 112: South Asia and Pacific Market Value Share (%) and BPS Analysis by Application, 2024 to 2034

Figure 113: South Asia and Pacific Market Y-o-Y Growth (%) Projections by Application, 2024 to 2034

Figure 114: South Asia and Pacific Market Value (US$ Million) Analysis by End-User, 2019 to 2034

Figure 115: South Asia and Pacific Market Value Share (%) and BPS Analysis by End-User, 2024 to 2034

Figure 116: South Asia and Pacific Market Y-o-Y Growth (%) Projections by End-User, 2024 to 2034

Figure 117: South Asia and Pacific Market Attractiveness by Type, 2024 to 2034

Figure 118: South Asia and Pacific Market Attractiveness by Application, 2024 to 2034

Figure 119: South Asia and Pacific Market Attractiveness by End-User, 2024 to 2034

Figure 120: South Asia and Pacific Market Attractiveness by Country, 2024 to 2034

Figure 121: East Asia Market Value (US$ Million) by Type, 2024 to 2034

Figure 122: East Asia Market Value (US$ Million) by Application, 2024 to 2034

Figure 123: East Asia Market Value (US$ Million) by End-User, 2024 to 2034

Figure 124: East Asia Market Value (US$ Million) by Country, 2024 to 2034

Figure 125: East Asia Market Value (US$ Million) Analysis by Country, 2019 to 2034

Figure 126: East Asia Market Value Share (%) and BPS Analysis by Country, 2024 to 2034

Figure 127: East Asia Market Y-o-Y Growth (%) Projections by Country, 2024 to 2034

Figure 128: East Asia Market Value (US$ Million) Analysis by Type, 2019 to 2034

Figure 129: East Asia Market Value Share (%) and BPS Analysis by Type, 2024 to 2034

Figure 130: East Asia Market Y-o-Y Growth (%) Projections by Type, 2024 to 2034

Figure 131: East Asia Market Value (US$ Million) Analysis by Application, 2019 to 2034

Figure 132: East Asia Market Value Share (%) and BPS Analysis by Application, 2024 to 2034

Figure 133: East Asia Market Y-o-Y Growth (%) Projections by Application, 2024 to 2034

Figure 134: East Asia Market Value (US$ Million) Analysis by End-User, 2019 to 2034

Figure 135: East Asia Market Value Share (%) and BPS Analysis by End-User, 2024 to 2034

Figure 136: East Asia Market Y-o-Y Growth (%) Projections by End-User, 2024 to 2034

Figure 137: East Asia Market Attractiveness by Type, 2024 to 2034

Figure 138: East Asia Market Attractiveness by Application, 2024 to 2034

Figure 139: East Asia Market Attractiveness by End-User, 2024 to 2034

Figure 140: East Asia Market Attractiveness by Country, 2024 to 2034

Figure 141: Middle East and Africa Market Value (US$ Million) by Type, 2024 to 2034

Figure 142: Middle East and Africa Market Value (US$ Million) by Application, 2024 to 2034

Figure 143: Middle East and Africa Market Value (US$ Million) by End-User, 2024 to 2034

Figure 144: Middle East and Africa Market Value (US$ Million) by Country, 2024 to 2034

Figure 145: Middle East and Africa Market Value (US$ Million) Analysis by Country, 2019 to 2034

Figure 146: Middle East and Africa Market Value Share (%) and BPS Analysis by Country, 2024 to 2034

Figure 147: Middle East and Africa Market Y-o-Y Growth (%) Projections by Country, 2024 to 2034

Figure 148: Middle East and Africa Market Value (US$ Million) Analysis by Type, 2019 to 2034

Figure 149: Middle East and Africa Market Value Share (%) and BPS Analysis by Type, 2024 to 2034

Figure 150: Middle East and Africa Market Y-o-Y Growth (%) Projections by Type, 2024 to 2034

Figure 151: Middle East and Africa Market Value (US$ Million) Analysis by Application, 2019 to 2034

Figure 152: Middle East and Africa Market Value Share (%) and BPS Analysis by Application, 2024 to 2034

Figure 153: Middle East and Africa Market Y-o-Y Growth (%) Projections by Application, 2024 to 2034

Figure 154: Middle East and Africa Market Value (US$ Million) Analysis by End-User, 2019 to 2034

Figure 155: Middle East and Africa Market Value Share (%) and BPS Analysis by End-User, 2024 to 2034

Figure 156: Middle East and Africa Market Y-o-Y Growth (%) Projections by End-User, 2024 to 2034

Figure 157: Middle East and Africa Market Attractiveness by Type, 2024 to 2034

Figure 158: Middle East and Africa Market Attractiveness by Application, 2024 to 2034

Figure 159: Middle East and Africa Market Attractiveness by End-User, 2024 to 2034

Figure 160: Middle East and Africa Market Attractiveness by Country, 2024 to 2034

Frequently Asked Questions

How Big is the Fire Stopping Material Market in 2024?

The global fire stopping material market is expected to be worth USD 2.1 billion by 2024.

What is the Sales Forecast for Fire Stopping Material by 2034?

The market for fire stopping material is expected to reach USD 6.5 billion by 2034.

At What Rate is the Market Growing through 2034?

The market is growing at a CAGR of 12.2% from 2024 to 2034.

Which are the Key Manufacturing Companies for Fire Stopping Materials?

Some of the key players in the market are Hilti Corporation, 3M Company, Rockwool International A/S, BASF SE, Specified Technologies Inc. (STI), H. B. Fuller Company, RectorSeal LLC, etc.

Which is the Most Popular Fire Stopping Material?

Sealants are the most preferred fire stopping material dominating the market.

Explore Similar Insights

Future Market Insights

Fire Stopping Material Market