The North America Flame Retardant Thermoplastics Market is estimated to be valued at USD 4.7 billion in 2025 and is projected to reach USD 7.5 billion by 2035, registering a compound annual growth rate (CAGR) of 4.8% over the forecast period.
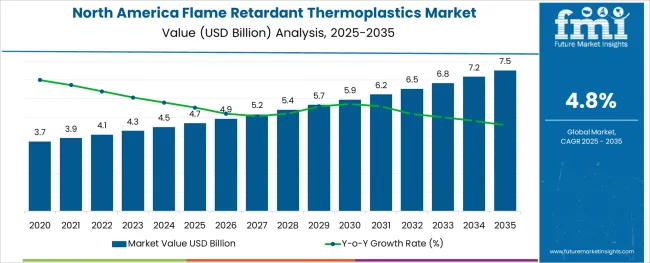
The North America flame retardant thermoplastics market is expanding steadily, fueled by the rising demand for fire-safe materials across various industries. Increasing safety regulations and standards for electrical and electronic devices have heightened the need for materials that can resist ignition and reduce fire hazards. Technological advancements in polymer formulations have improved the flame retardant properties while maintaining the mechanical strength and processing capabilities of thermoplastics.
Growing electronics manufacturing activities in the region have further driven the demand for flame retardant thermoplastics to ensure product safety and compliance. Consumer awareness of fire safety and environmental concerns about toxic emissions from burning plastics have encouraged the adoption of advanced flame retardant materials.
Looking ahead, the market is expected to benefit from innovations in non-halogenated flame retardants and expanding applications in automotive and construction sectors. Growth is expected to be primarily led by the Polycarbonate (PC) product segment and the Electrical & Electronics application segment.
The market is segmented by Product Type and Application and region. By Product Type, the market is divided into Polycarbonate (PC), Acrylonitrile & Electricals, Polypropylene (PP), and Polystyrene (PS). In terms of Application, the market is classified into Electrical & Electronics, Automotive & Transportation, Building & Construction, Industrial, and Others. Regionally, the market is classified into North America, Latin America, Western Europe, Eastern Europe, Balkan & Baltic Countries, Russia & Belarus, Central Asia, East Asia, South Asia & Pacific, and the Middle East & Africa.
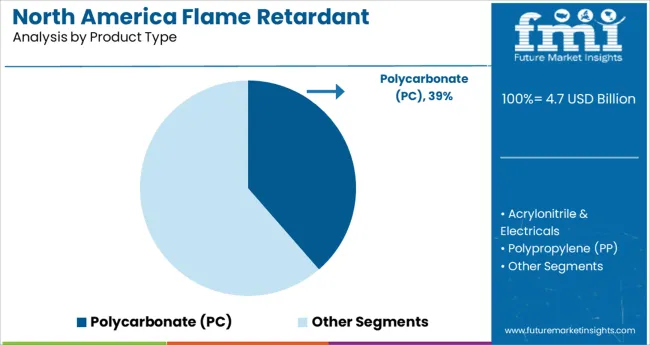
The Polycarbonate segment is expected to capture 38.6% of the North America flame retardant thermoplastics market revenue in 2025. This segment’s growth is driven by polycarbonate’s unique combination of high impact resistance, optical clarity, and flame retardant capabilities.
Polycarbonate has found extensive use in manufacturing components that require both mechanical strength and fire safety, such as electrical housings, lighting fixtures, and safety equipment. Its ability to be easily processed and molded into complex shapes has made it a preferred material for design flexibility.
The rising demand for durable and flame retardant materials in consumer electronics and industrial equipment has solidified polycarbonate’s market position. As manufacturers seek materials that meet stringent fire safety standards without compromising on performance, the Polycarbonate segment is expected to sustain its leading role.
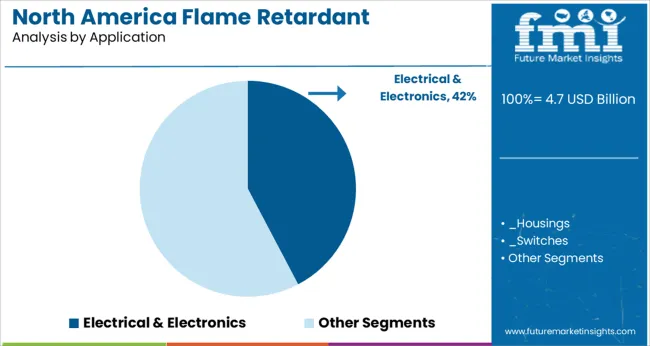
The Electrical & Electronics segment is projected to hold 42.3% of the market revenue in 2025, retaining its position as the largest application segment. Growth in this sector is attributed to the increasing use of flame retardant thermoplastics in electronic devices, circuit breakers, connectors, and wiring components to meet strict safety regulations.
The rapid innovation cycle in electronics has necessitated materials that provide both flame resistance and durability under thermal stress. Manufacturers have been integrating flame retardant thermoplastics to enhance product safety while enabling compact and lightweight device designs.
Additionally, the expansion of smart devices and IoT technology has fueled demand for high-performance materials in this sector. With ongoing regulatory focus on fire safety in consumer and industrial electronics, the Electrical & Electronics segment is anticipated to maintain robust growth.
Flame retardant thermoplastics in the building and construction sector are anticipated to see significant growth prospects due to the renovation and expansion of city amenities for disadvantaged populations.
In the upcoming years, the new research report on North America flame retardant thermoplastics market projects an increase in the use of the product in several new application sectors that would force businesses to reverse integrate mostly in the supply chain.
Thus a greater involvement in the production process is expected to speed up the process of turning resources into goods and services and provide North America flame retardant thermoplastics market players a price advantage over their competitors.
Thermoplastics, like ABS, deform, making it simple to infuse, shape, and regenerate them. However, owing to its low melting point, ABS is not utilized in high-heat conditions which could limit the growth of the North America flame retardant thermoplastics market growth prospects to a certain extent.
Stringent government regulations for controlling the chemical residues released from flame retardant thermoplastics manufacturing plants can pose as a major challenge to the growth of the target market. Restriction on the sales and uses of halogen is also anticipated to limit the North American flame retardant thermoplastics growth in the future days.
The demand for these flame-retardant thermoplastics is anticipated to be boosted by rising funding from public and private organizations for the safety of public buildings and areas.
Acrylonitrile butadiene styrene (ABS), which accounted for more than 34% of the 2024 North American flame retardant thermoplastics market statistics report, established itself as a leading product group in terms of value. It is excellent for a variety of sectors thanks to its qualities, including high tensile strength, stiffness, impact resistance, and inexpensive cost compared to its alternatives.
ABS is easier to use and carry because of its reduced weight making it the most sought-after product segment in the North American flame retardant thermoplastics market size. Computer hardware and LEGO sets are also the prominent uses of acrylic butadiene styrene thermoplastic polymers consequently turning up this segment into the most profitable segment for the North American flame retardant thermoplastics market players.
Over the course of the forecast period, the automotive and transportation application sub-segment is anticipated to expand at a pace of 4.6%. By accounting for more than 17 percent of all flame retardant thermoplastics applications in North America in 2024.
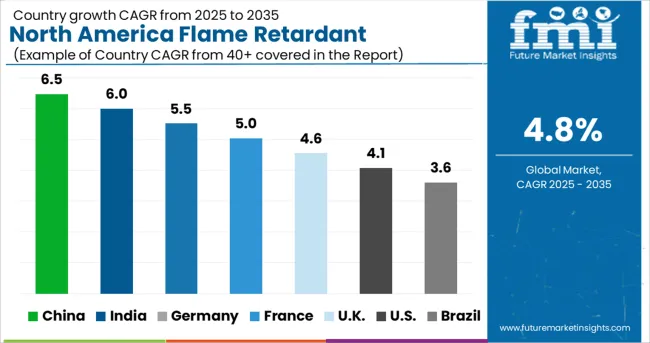
With the proliferation of megaprojects with a focus on green infrastructure, the USA flame-retardant thermoplastics market is predicted to rise exponentially.
The USA flame retardant thermoplastics market has been perpetually supported by its building and construction sector which uses these materials more often for manufacturing and commercial applications. The market for flame retardant thermoplastics is also anticipated to increase greatly as a result of the USA's expanding affordable housing sector.
The USA real estate sector has recently experienced a positive trend as a result of an increase in infrastructure projects is expected to propel the flame retardant thermoplastics market key trends and opportunities as well. Moreover, due to increased import taxes, shifting trade agreements, and a booming off-shore trade market the flame retardant thermoplastics market in the USA is projected to remain dominant during the projected period.
Canada's building and construction sector is seeing profitable growth prospects promising for North America flame retardant thermoplastics market opportunities in ample amounts. Flame retardant thermoplastics manufacturers are also choosing to establish their factories in Canada given the lower establishment costs associated with facilities and the lower cost of production compared to that in the USA.
Additionally, the Canadian government's expenditures in infrastructural development are anticipated to fuel the expansion of the nation's building projects, leading to a strong marketplace for North America flame retardant thermoplastics market future trends during the course of the forecast period.
Similarly, over the forecast timeline of 2025 to 3032, it is predicted that Mexico's expanding residential, industrial, and commercial building sectors would help drive the sales of flame retardant thermoplastics in the country.
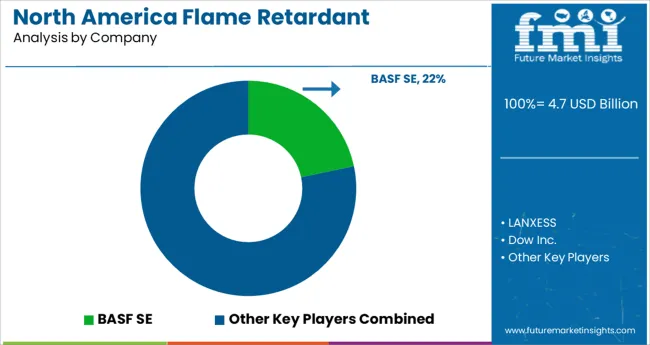
In order to meet the escalating market demands, North America flame retardant thermoplastics producers are increasing their infrastructure and manufacturing capacity. Additionally, a lot of businesses that make flame retardant thermoplastics products employ takeover and collaboration techniques to source their input resources.
This North America flame retardant thermoplastics industry is severely fragmented and still relies heavily on consolidations and joint projects, which enable businesses to increase their marketplace presence.
To retain customer satisfaction and broaden their geographical reach, the majority of the flame retardant thermoplastics market key players in North American have equipped their businesses for producing and distributing raw materials. As a result, the profit margin has increased while giving businesses a strategic profit advantage.
North American flame retardant thermoplastics market prominent players are engaging in Research and Development operations to create new goods in order to keep up with price competition and evolving consumer choice. It is anticipated that in the upcoming years, research on novel materials with multi-property combinations will find widespread adoption in this market.
The global north america flame retardant thermoplastics market is estimated to be valued at USD 4.7 billion in 2025.
It is projected to reach USD 7.5 billion by 2035.
The market is expected to grow at a 4.8% CAGR between 2025 and 2035.
The key product types are polycarbonate (pc), acrylonitrile & electricals, polypropylene (pp) and polystyrene (ps).
electrical & electronics segment is expected to dominate with a 42.3% industry share in 2025.


Full Research Suite comprises of:
Market outlook & trends analysis
Interviews & case studies
Strategic recommendations
Vendor profiles & capabilities analysis
5-year forecasts
8 regions and 60+ country-level data splits
Market segment data splits
12 months of continuous data updates
DELIVERED AS:
PDF EXCEL ONLINE
Northern Blotting Market Size and Share Forecast Outlook 2025 to 2035
Northern Europe Calcium Sulphate Market Size and Share Forecast Outlook 2025 to 2035
North America Boat Trailer Market Size and Share Forecast Outlook 2025 to 2035
North America Cryogenic Label Printer Market Size and Share Forecast Outlook 2025 to 2035
North America Chitosan Market Size and Share Forecast Outlook 2025 to 2035
North America Underground Mining Vehicle Market Size and Share Forecast Outlook 2025 to 2035
North America Bulk Aseptic Packaging Market Size and Share Forecast Outlook 2025 to 2035
North America Licorice Extract Market Size and Share Forecast Outlook 2025 to 2035
North America Par Baked Bread Market Size and Share Forecast Outlook 2025 to 2035
North America Silo Bags Market Size and Share Forecast Outlook 2025 to 2035
North America Fresh Meat Packaging Market Size and Share Forecast Outlook 2025 to 2035
North America Ceramic Barbeque Grill Market Size and Share Forecast Outlook 2025 to 2035
North America Temperature Sensor Market Size and Share Forecast Outlook 2025 to 2035
North American Dietary Supplements Market Size and Share Forecast Outlook 2025 to 2035
North America Head-up Display Market Size and Share Forecast Outlook 2025 to 2035
North America, Europe & Asia Pacific Legal Cannabis Market Size and Share Forecast Outlook 2025 to 2035
North America Ceiling Cassette Market Size and Share Forecast Outlook 2025 to 2035
North America Pressure Regulating Valves Market Size and Share Forecast Outlook 2025 to 2035
Fire Pit Market Analysis in North America - Growth, Trends and Forecast from 2025 to 2035
North America Electrical Testing Services Market - Growth & Demand 2025 to 2035

Thank you!
You will receive an email from our Business Development Manager. Please be sure to check your SPAM/JUNK folder too.
Chat With
MaRIA