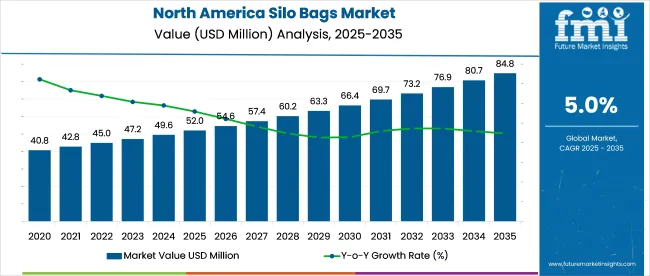
The North America Silo Bags Market is estimated to be valued at USD 52.0 billion in 2025 and is projected to reach USD 84.8 billion by 2035, registering a compound annual growth rate (CAGR) of 5.0% over the forecast period.

| Metric | Value |
|---|---|
| North America Silo Bags Market Estimated Value in (2025 E) | USD 52.0 billion |
| North America Silo Bags Market Forecast Value in (2035 F) | USD 84.8 billion |
| Forecast CAGR (2025 to 2035) | 5.0% |
The North America silo bags market is witnessing notable growth owing to increasing demand for cost effective grain storage solutions, flexibility in on farm storage, and the ability to preserve crop quality during extended periods. Rising grain production, combined with volatility in global supply chains, has driven farmers and cooperatives to adopt silo bags as an adaptable and scalable option compared to permanent infrastructure.
Polyethene based silo bags are gaining strong traction due to their durability, UV resistance, and protective properties against pests and moisture. Technological improvements in multilayer film production and sealing methods are further enhancing the performance of these storage systems.
Additionally, the need for immediate storage post harvest and the rising emphasis on reducing post harvest losses have positioned silo bags as a strategic solution. The outlook for the market remains strong as agricultural stakeholders increasingly prioritize storage efficiency, cost reduction, and crop protection.

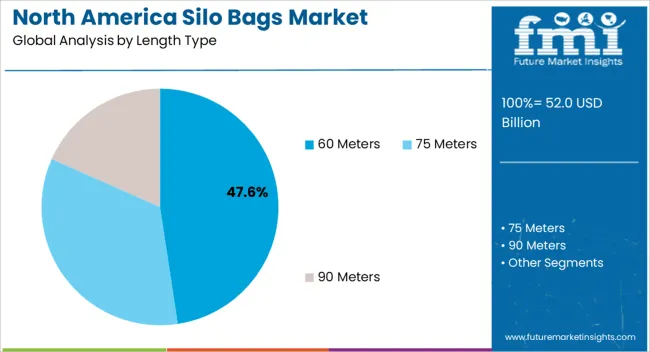
The 60 meters length type segment is projected to hold 47.60% of the total revenue by 2025, making it the leading length category. Its dominance is attributed to the balance it offers between storage capacity, ease of handling, and adaptability to farm operations.
This length type provides sufficient storage for medium to large scale farms while ensuring efficient land utilization. Its popularity has been reinforced by the ability to optimize space without requiring heavy duty machinery for handling.
Farmers have increasingly adopted this size due to its operational convenience and its suitability for a wide range of crops, ensuring its leadership in the length type category.

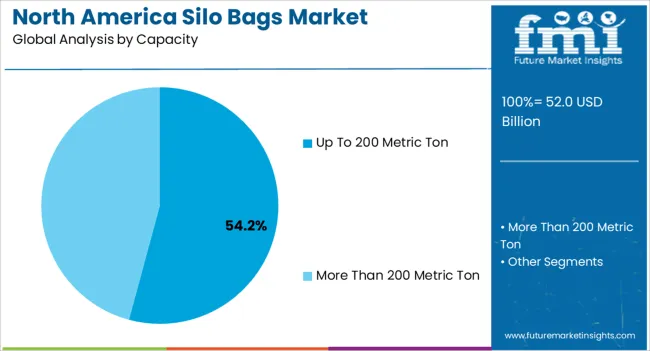
The up to 200 metric ton capacity segment is expected to contribute 54.20% of the total market revenue by 2025 within the capacity category. This preference is driven by its practicality in meeting the storage needs of medium scale farms and cooperatives.
The capacity range allows for flexible storage management without necessitating large capital investments in permanent infrastructure. It has been favored for its compatibility with standard farm equipment and ability to store multiple grain varieties while maintaining quality.
The segment’s strong adoption reflects a balance between affordability and capacity, reinforcing its leadership in the overall market.
The polyethene silo bags segment is anticipated to account for 49.80% of the market revenue by 2025 within the material type category, establishing it as the leading material choice. Its wide use is due to superior durability, UV protection, and high resistance against moisture and pests.
Polyethene has enabled farmers to ensure longer storage durations while safeguarding grain integrity. Advancements in multilayer film technologies have further enhanced the material’s protective qualities, making it a reliable option for diverse climatic conditions across North America.
The dominance of polyethene silo bags is being reinforced by their cost effectiveness and ability to minimize post harvest losses, ensuring their continued preference among end users.
North American silo bags constituted around 21% to 24% of the global silo bags market worth, which was around USD 40.8 million in 2020. In comparison to the forecasted CAGR, the North American silo bags market registered an average annual growth rate of 4.1% in the period between 2020 and 2025.
The demand for silo bags was negatively impacted to some extent during the years 2024 and 2024 as a result of the pandemic. Though the agriculture industry was least disrupted, however, the market growth was dampened because of the delays in the supply of agricultural produce. Reduced manpower in the manufacturing units also resulted in disruptions in the supply of silo bags in the North America region in 2024.
The silo bags market experienced a heightened growth rate in 2024 as the restriction and regulations were reduced in several parts of the region. The great focus on agriculture and associated industries in the following years rendered the silo bag manufacturers with better market opportunities.
The new generation of farmers expects features such as flexibility, low cost, high performance, and less space requirement instrumenting a new trend. It also has resulted in frequent innovation in packaging and creativity in the final shape of silo bags. Better material and design give farmers the ability to store the yield until a convenient time when the final delivery of grains is reached.
Various machines are now used to fill grains quickly in silo bags such as the rotor bagger machine due to technology up-gradation. The introduction of such modern machines for working well with silo bags is anticipated to favor the market key trends and opportunities.
Other baggers that are commonly used for convenient packaging are farm bagger hoppers and augers, grinder hoppers, and trucks with tunnels or truck baggers. The growing adoption of these bagger systems in North America is expected to drive the silo bags market growth during the forecast period.

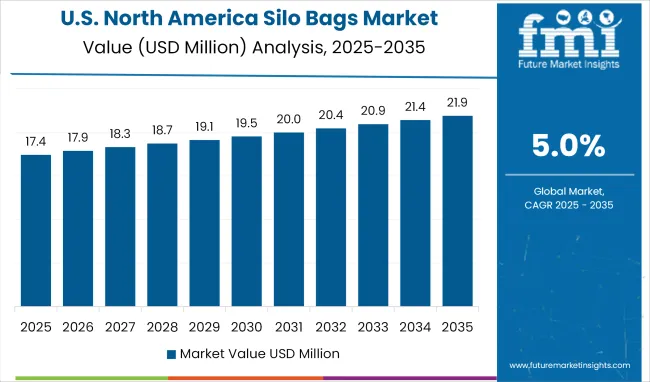
The demand for silo bags in the United States is way higher than in Canada owing to the presence of a huge commercial agricultural base. The United States is estimated to offer an excellent incremental opportunity of USD 24.9 million to silo bag manufacturers in forthcoming years. As per the USA Department of Agriculture (USDA), agriculture and related industries cumulatively contributed to a 5.2% share of the USA GDP.
The significant growth of the organic agriculture industry in the United States is anticipated to strengthen the silo bags industry in the country. So most of the silo bag manufacturers in the country are spending on the development of eco-friendly or bio-degradable materials for the purpose. Furthermore, the recent federal regulations regarding curbing the use of polymer materials might play a crucial role in this endeavor of market players.
| Regional Markets | The United States Market |
|---|---|
| Market Share in 2025 | 83.52% |
| CAGR (2025 to 2035) | 4.9% |
| Regional Markets | Canada Market |
|---|---|
| Market Share in 2025 | 16.3% |
| CAGR (2025 to 2035) | 5.4% |
Back in the year 2025, the net worth of the total silo bags sold in Canada was around USD 52 million. FMI estimates that Canada’s silo bags market might advance at a compound annual growth rate of 5.4% during the period 2025 to 2035.
According to the data published by the Government of Canada, the production of grains and oilseeds totaled 90,444 thousand tons in 2024. Further, the agricultural produce in the country was forecasted to witness an upward trend in the following years. This promising growth in the cultivation of grains is anticipated to generate huge market growth opportunities for silo bags in the country.
Among the different materials used for manufacturing silo bags, polyethylene or PE is the most preferred segment for the end users. It is also estimated to gain escalated demand through 2035 with the growing preference of farmers, and compatibility for a wide range of applications. Furthermore, the manufacturers are also enhancing their PE silo bag product offering as it is easy to recycle and sustainable compared to other alternatives.
The PE material segment is projected to offer an excellent incremental opportunity of USD 9.4 million over the next ten years. Meanwhile, the polypropylene material segment is anticipated to maintain a high growth rate with its growing adoption in some new application segments.
| Category | Material Type |
|---|---|
| Top Segment | Polyethylene (PE) Silo Bags |
| Market Share in Percentage | 92.8% |
| Category | Application |
|---|---|
| Top Segment | Grain Storage |
| Market Share in Percentage | 66.7% |
Based on application, the grain storage segment generates the most demand for silo bags and is projected to remain dominant through 2035. The demand for silo bags for the grains segment is projected to expand at a CAGR of 4.9% over the forecast period 2025 to 2035.
The forage products storage segment is anticipated to progress at a high rate during the forecasted period. Silo bags are also efficient and convenient for storing fertilizers and dried fruits, however, the contribution share of these segments is limited until now.
Many regional players in North America offer these silage storage bags for various applications, making the overall market competitive. So, these businesses now targeting only a single application or product-based sector that offers advantageous legislation is a discernible trend across the market. This enables the industries to save expenses while still hiring experts in the field at each pivotal stage of their firms.
Leading silo bag manufacturers are focusing on making investments to increase their geographical footprint and manufacturing capabilities to enhance their overseas market share. For instance,
Some key players are also focusing on providing sustainable alternatives to the end users in compliance with environmental protection laws. For instance, in August 2024, RKW Group launched Polydress FarmGuard, a seven-layer silage barrier film for manufacturing silo bags 39 meters wide.
Silo bag manufacturers in North America are increasingly getting engaged in developing strategies like targeted marketing to improve their brand recognition. So new industries entering the market can adopt online promotion to get headway in such an evolving market scenario.
By cutting trade taxes and levies, developing nations are implementing measures to entice international investors to the agro-industrial sectors and create more employment. So, the expansion of North American silo bags businesses’ beyond the territorial boundaries could be a significant opportunity for them in the coming days.
| Attribute | Details |
|---|---|
| Forecast Period | 2025 to 2035 |
| Historical Data Available for | 2020 to 2025 |
| Market Analysis | USD million for Value and ‘000 Units for Volume |
| Key Countries Covered | The United States and Canada |
| Key Segments Covered | By Length Type, By Capacity, By Material Type, By Application, By Country |
| Key Companies Profiled | IPESA - Rio Chico S.A.; GEM Silage Products; RKW Hyplast NV.; BagMan LLC; Canadian Tarpaulin Manufacturers Ltd.; Grain Bags Canada; Blue Lake Plastics, LLC; Grain Pro, Inc.; KSI Supply, Inc.; Temudjin Flex-Pack B.V. |
| Report Coverage | Market Forecast, Company Share Analysis, Competition Intelligence, DROT Analysis, Market Dynamics and Challenges, and Strategic Growth Initiatives |
The global north america silo bags market is estimated to be valued at USD 52.0 billion in 2025.
The market size for the north america silo bags market is projected to reach USD 84.8 billion by 2035.
The north america silo bags market is expected to grow at a 5.0% CAGR between 2025 and 2035.
The key product types in north america silo bags market are 60 meters, 75 meters and 90 meters.
In terms of capacity, up to 200 metric ton segment to command 54.2% share in the north america silo bags market in 2025.


Our Research Products

The "Full Research Suite" delivers actionable market intel, deep dives on markets or technologies, so clients act faster, cut risk, and unlock growth.

The Leaderboard benchmarks and ranks top vendors, classifying them as Established Leaders, Leading Challengers, or Disruptors & Challengers.

Locates where complements amplify value and substitutes erode it, forecasting net impact by horizon

We deliver granular, decision-grade intel: market sizing, 5-year forecasts, pricing, adoption, usage, revenue, and operational KPIs—plus competitor tracking, regulation, and value chains—across 60 countries broadly.

Spot the shifts before they hit your P&L. We track inflection points, adoption curves, pricing moves, and ecosystem plays to show where demand is heading, why it is changing, and what to do next across high-growth markets and disruptive tech

Real-time reads of user behavior. We track shifting priorities, perceptions of today’s and next-gen services, and provider experience, then pace how fast tech moves from trial to adoption, blending buyer, consumer, and channel inputs with social signals (#WhySwitch, #UX).

Partner with our analyst team to build a custom report designed around your business priorities. From analysing market trends to assessing competitors or crafting bespoke datasets, we tailor insights to your needs.
Supplier Intelligence
Discovery & Profiling
Capacity & Footprint
Performance & Risk
Compliance & Governance
Commercial Readiness
Who Supplies Whom
Scorecards & Shortlists
Playbooks & Docs
Category Intelligence
Definition & Scope
Demand & Use Cases
Cost Drivers
Market Structure
Supply Chain Map
Trade & Policy
Operating Norms
Deliverables
Buyer Intelligence
Account Basics
Spend & Scope
Procurement Model
Vendor Requirements
Terms & Policies
Entry Strategy
Pain Points & Triggers
Outputs
Pricing Analysis
Benchmarks
Trends
Should-Cost
Indexation
Landed Cost
Commercial Terms
Deliverables
Brand Analysis
Positioning & Value Prop
Share & Presence
Customer Evidence
Go-to-Market
Digital & Reputation
Compliance & Trust
KPIs & Gaps
Outputs
Full Research Suite comprises of:
Market outlook & trends analysis
Interviews & case studies
Strategic recommendations
Vendor profiles & capabilities analysis
5-year forecasts
8 regions and 60+ country-level data splits
Market segment data splits
12 months of continuous data updates
DELIVERED AS:
PDF EXCEL ONLINE
Northern Blotting Market Size and Share Forecast Outlook 2025 to 2035
Northern Europe Calcium Sulphate Market Size and Share Forecast Outlook 2025 to 2035
North America Boat Trailer Market Size and Share Forecast Outlook 2025 to 2035
North America Cryogenic Label Printer Market Size and Share Forecast Outlook 2025 to 2035
North America Chitosan Market Size and Share Forecast Outlook 2025 to 2035
North America Underground Mining Vehicle Market Size and Share Forecast Outlook 2025 to 2035
North America Bulk Aseptic Packaging Market Size and Share Forecast Outlook 2025 to 2035
North America Licorice Extract Market Size and Share Forecast Outlook 2025 to 2035
North America Par Baked Bread Market Size and Share Forecast Outlook 2025 to 2035
North America Fresh Meat Packaging Market Size and Share Forecast Outlook 2025 to 2035
North America Ceramic Barbeque Grill Market Size and Share Forecast Outlook 2025 to 2035
North America Temperature Sensor Market Size and Share Forecast Outlook 2025 to 2035
North American Dietary Supplements Market Size and Share Forecast Outlook 2025 to 2035
North America Head-up Display Market Size and Share Forecast Outlook 2025 to 2035
North America, Europe & Asia Pacific Legal Cannabis Market Size and Share Forecast Outlook 2025 to 2035
North America Ceiling Cassette Market Size and Share Forecast Outlook 2025 to 2035
North America Pressure Regulating Valves Market Size and Share Forecast Outlook 2025 to 2035
North America Flame Retardant Thermoplastics Market Size and Share Forecast Outlook 2025 to 2035
Fire Pit Market Analysis in North America - Growth, Trends and Forecast from 2025 to 2035
North America Electrical Testing Services Market - Growth & Demand 2025 to 2035

Thank you!
You will receive an email from our Business Development Manager. Please be sure to check your SPAM/JUNK folder too.
Chat With
MaRIA