Reports

- Global Locations -

Headquarters

Future Market Insights, Inc.

Christiana Corporate, 200
Continental Drive, Suite 401,
Newark, Delaware - 19713,
United States

T: +1-845-579-5705

Americas

Future Market Insights, Inc.

616 Corporate Way, Suite 2-9018,
Valley Cottage, NY 10989, United States

T: +1-347-918-3531

MEA

Future Market Insights

1602-6 Jumeirah Bay X2 Tower, Plot No: JLT-PH2-X2A,
Jumeirah Lakes Towers, Dubai,
United Arab Emirates

Europe

Future Market Insights

3rd Floor, 207 Regent Street,
W1B 3HH London
United Kingdom

T: + 44 (0) 20 8123 9659
D: +44 (0) 20 3287 4268

Asia Pacific

Future Market Insights

IndiaLand Global Tech Park, Unit UG-1, Behind Grand HighStreet, Phase 1, Hinjawadi, MH, Pune – 411057, India

North America Pressure Regulating Valves Market Outlook (2022 to 2032)

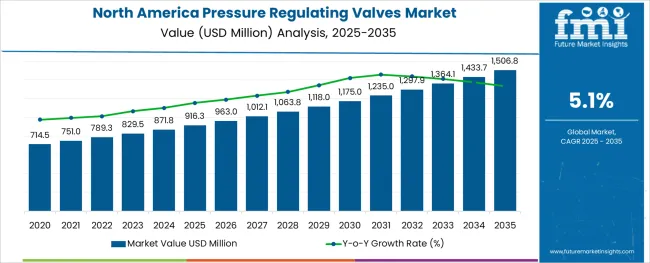
According to Future Market Insights (FMI), between 2022 and 2032, the North America market for Pressure Regulating Valves will grow at a CAGR of 5.1%, reaching a valuation of US$ 1,293.5 Million in 2032.

Pressure-regulating valves are widely used in domestic water distribution systems, in which direct-acting pressure-reducing valves are often recommended as maintaining system pressure can be very difficult under high-demand conditions. Pressure-reducing valves are used in these lines to effectively regulate the downstream pressure to acceptable limits. In the USA and Canada, Pressure Regulating Valves market growth is driven by the strength of the residential repair and remodeling markets. Following the outbreak of COVID-19, the trend for increased spending on home improvement is on the high rise and is to be continued throughout the forecast period, which will boost the pressure regulating valve market in North America.

Report Attributes Details
North America Pressure Regulating Valves Size (2021A) US$ 751.0 Million
North America Pressure Regulating Valves Size (2022E) US$ 782.9 Million
Projected Pressure Regulating Valves Market Value (2032F) US$ 1,293.5 Million
Value CAGR (2022 to 2032) 5.1%

The USA is expected to account for the dominant share owing to the rise in construction industry valuation and a growing number of multi-story buildings where consumption of Pressure Regulating Valves is high. Hence, the USA is estimated to hold more than 75% of the market value and volume share collectively in the North American market.

North America Pressure Regulating Valves account for 20 to 25% of the global Pressure Regulating Valves market on a value basis.

Don't pay for what you don't need

Customize your report by selecting specific countries or regions and save 30%!

Demand Analysis of Pressure Regulating Valves from 2017 to 2021 Vs Market Forecast for 2022 to 2032

According to historical data from 2017 to 2021, the market for Pressure Regulating Valves increased by volume at a CAGR of 1.4%. The estimated global market demand for these valves in 2022 is estimated at US$ 782.9 Million. According to the research, the USA ranked as the 39th country in the world in terms of infrastructure investment in 2019. The growing number of housing units in the USA and the registered annual growth in the Canadian construction industry are the major factors responsible for the steady growth of the North American market during the historical period.

According to research, the year-on-year change in the growth of America’s Pressure Regulating valves for 2021 is 3.4%, the reason being numerous new product innovations and increased spending in research and development by key market participants and adherence to stringent government regulations. In accordance with the above factors, the functional features of the pressure regulating valves, which include robustness, dirt tolerance, energy efficiency, and preventing overpressure, are the important aspects that are driving the market during the forecast period between 2022 and 2032.

Direct-acting pressure regulating valves is ideal solutions for precision control of flow rate or pressure. This is boosting the market growth of Pressure Regulating Valves in the North American region.

North America Pressure Regulating Valves Market

How is retrofit market of PRV driving the targeted market growth?

The drive to install pressure-reducing valves is also related to the retrofitting of a number of pre-existing valves to make them more water and energy-efficient, and to a lesser extent, in new infrastructure and renovation of multifamily residential buildings.

Key market participants are transforming into industry leaders by developing innovative solutions for these markets that seek to comply with rigorous third-party regulations, meet new building and plumbing standards, and meet project and program requirements.

Nikhil Kaitwade
Nikhil Kaitwade

Principal Consultant

Talk to Analyst

Find your sweet spots for generating winning opportunities in this market.

What factors are creating future growth opportunities for the North American pressure regulating valve market?

In 2021, the market size of the USA construction sector was registered at around US$ 1.6 trillion and it is projected to increase further in the coming years. In addition to this, in the North American region, the construction of the multi-story building shows a considerable record, which is seen as a way to provide a high density for the installation of pressure regulating valves in these buildings, which help to regulate or reduce the pressure of water from the city mains to provide a lower, more functional pressure for distribution in each of the apartments. Hence, these factors are estimated to emerge as an opportunity to boost the growth of the pressure-regulating valve market.
Country-wise Insights

What is the Outlook for Pressure Regulating Valves Market Manufacturers in the USA?

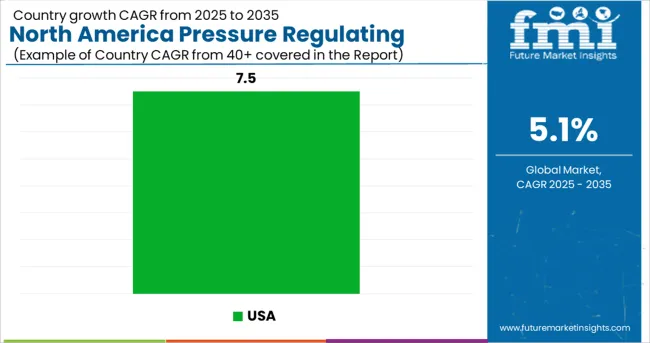
The USA is expected to hold more than 75% of the North American market by 2032 and is estimated to grow with a CAGR of 5.1% through the forecast period.

The USA population is rising steadily manner hence fueling the trend of the new home construction market. According to the USA Department of Commerce, the number of housing units in the USA has been growing year after year. In 2021, the housing units increased by one million as compared to the year 2020. In addition to this, USA new building construction spending is expected to grow by more than US$ 100 bn by the end of 2022. Hence, retrofit in Infrastructure renovation and new building construction will remain the primary growth factors for the targeted market in the USA region.

Where Does the Canada Stand in the North America PRV Market?

Canada is expected to gain 110 bps points between 2022 and 2032 and is set to create an absolute dollar opportunity worth more than US$ 109.6 million during the same period.

The construction industry in Canada is a dynamic industry that contributes significantly to the economy, accounting for 7.5% of Canada’s gross domestic product. According to Statistics Canada, the residential building construction price index rose by 18.1 percent in 2021 as Canada is one of the fastest-growing countries in terms of residential sector infrastructure. A growing population and the rising needs of the residential sector are estimated to create significant opportunities for the market in the forecast period.

Get the data you need at a Fraction of the cost

Personalize your report by choosing insights you need
and save 40%!

Category-wise Insights

Which End-Use Will Remain Dominant Over the Forecast Period?

On the basis of the end-user segment, Apartments, and condominiums are expected to account for 55% of the overall market share, and this dominance is expected to continue throughout the forecast period.

The housing market has developed into a crucial economic metric that indicates consumers' purchasing power and the health of the housing industry. The housing sector, in turn, has an effect on a number of other economic sectors, and as a result, it influences how the targeted market is developing. PRV is used to reduce the pressure of flowing water, steam, or liquid to a predetermined manageable level in residential infrastructure.

Which PRV Type Will Increase Product Demand?

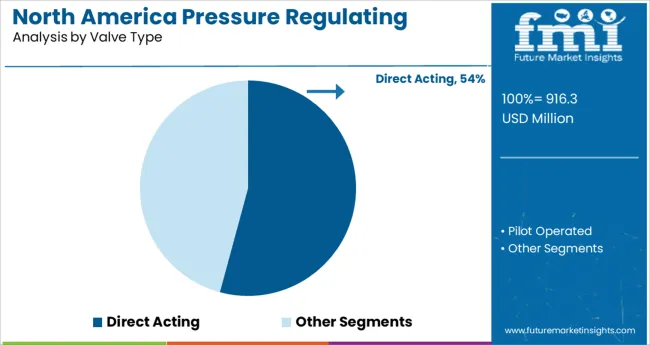
On the basis of valve type, direct-acting valves are the most popular pressure-regulating valves among all types. These valves accounted for more than 55% of market revenue in 2022.

One of the biggest benefits of Direct Acting Pressure Regulating Valves is that they are the most popular type owing to their outstanding features like being robust, dirt tolerant, and preventing overpressure. The necessary flow and pressure are provided by direct-operated pressure regulating valves in order to meet the system set point. They react immediately to changes in downstream pressure.
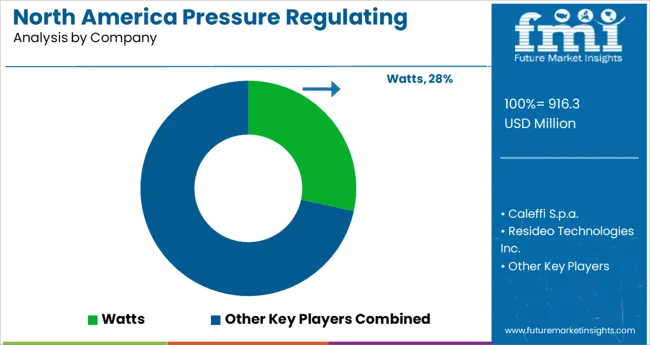
Competitive Landscape

Manufacturers in the market are following the new product strategy by developing highly innovative products with reduced product costs, which enhances their product portfolio and helps them to gain market compatibility with future market trends.

Key market participants are concentrating on diversifying their product lines through merger and acquisition activities.

  • In February 2022, Zurn Industries, LLC announces the release of the new Zurn Wilkins 500XL3 Pressure Reducing Valve. The new Zurn Wilkins 500XL3 Pressure Reducing Valve (PRV) has a patented integral venturi enabling the valve to have best-in-class flow performance.

Pressure Regulating Valves Market Report Scope

Attribute Details
Forecast Period 2022 to 2032
Historical Data Available for 2017 to 2021
Market Analysis USD Million for Value, ‘000 Units for Volume
Key Countries Covered USA & Canada
Key Market Segments Covered By Valve Type, By Inlet Pressure, By Diameter, By End-Use, and By Countries
Key Companies Profiled
  • Danfoss A/S
  • Reliance Worldwide Corporation
  • Parker Hannifin
  • Zurn Water Solutions
  • Apollo Valves
  • Watts Water Technologies Company
Report Coverage Market Forecast, brand share analysis, competition intelligence, Drivers, Restraints, Opportunities and Threats analysis, Market Dynamics and Challenges, Strategic Growth Initiatives
Customization & Pricing Available upon Request

Key Segments Covered in Pressure Regulating Valves Industry Analysis

Pressure Regulating Valves Market by Valve Type:

  • Direct Acting
  • Pilot Operated

Pressure Regulating Valves Market by Inlet Pressure:

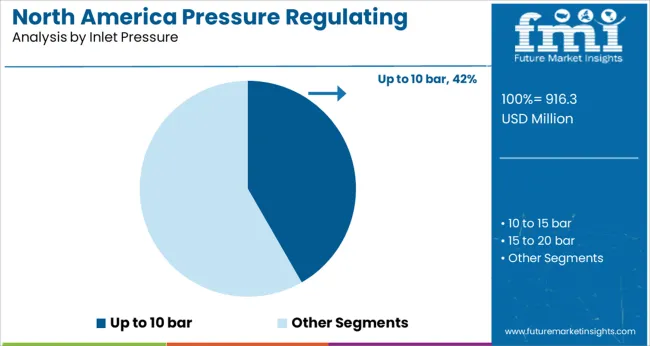
  • Up to 10 bar
  • 10 to 15 bar
  • 15 to 20 bar
  • Above 20 bar

Pressure Regulating Valves Market by Diameter:

  • 3/8"
  • 1/2"
  • 3/4"
  • 1"
  • 1 ¼”
  • Up to 2"

Pressure Regulating Valves Market by End Use:

  • Apartments & Condominiums
  • Townhouses
  • Villas

Pressure Regulating Valves Market by Country:

  • USA
    • North East USA
    • South USA
    • Midwest USA
    • West USA
  • Canada

Frequently Asked Questions

How much is the Pressure Regulating Valves market worth globally??

The North America Pressure Regulating Valves is currently valued at US$ 782.9 Million (2022).

What is the Pressure Regulating Valves market's projected growth rate from 2022 to 2032?

Pressure Regulating Valves sales are projected to soar between 2022 and 2032 at a value CAGR of about 5.1%.

Who are the top five manufacturers of Pressure Regulating Valves worldwide?

Tier-1 companies include Danfoss A/S, Watts Water Technologies, Resideo Technologies Inc, RWC, and Zurn Water Solutions account for a prominent share of the market share for Pressure Regulating Valves

Which Valve Type dominates the market for Pressure Regulating Valves globally?

The Direct Acting segment has the largest share among the types of Valves in the Pressure Regulating Valves market, accounting for nearly 60.5% of the market by volume in 2022.

Which End-Use is the prominent contributor in the Pressure Regulating Valves market globally?

Apartments and Condominiums are estimated to account for about 59% of the total market share in 2022.

Table of Content

1. Executive Summary | North America Pressure Regulating Valves Market

    1.1. North America Market Outlook

    1.2. Demand Side Trends

    1.3. Supply Side Trends

    1.4. Material Roadmap

    1.5. Analysis and Recommendations

2. Market Overview

    2.1. Market Coverage / Taxonomy

    2.2. Market Definition / Scope / Limitations

3. Key Market Trends

    3.1. Key Trends Impacting the Market

    3.2. Product Innovation / Development Trends

4. Key Success Factors

    4.1. Product Adoption / Usage Analysis

    4.2. Product USPs / Features

    4.3. Strategic Promotional Strategies

5. North Market Demand Analysis 2017 to 2021 and Forecast, 2022 to 2032

    5.1. Historical Market Volume (Units) Analysis, 2017 to 2021

    5.2. Current and Future Market Volume (Units) Projections, 2022 to 2032

    5.3. Y-o-Y Growth Trend Analysis

6. North Market - Pricing Analysis

    6.1. Regional Pricing Analysis By Inlet Pressure

    6.2. North America Average Pricing Analysis Benchmark

7. North Market Demand (in Value or Diameter in US$ Million) Analysis 2017 to 2021 and Forecast, 2022 to 2032

    7.1. Historical Market Value (US$ Million) Analysis, 2017 to 2021

    7.2. Current and Future Market Value (US$ Million) Projections, 2022 to 2032

        7.2.1. Y-o-Y Growth Trend Analysis

        7.2.2. Absolute $ Opportunity Analysis

8. Market Background

    8.1. Macro-Economic Factors

        8.1.1. North America GDP Growth Outlook

        8.1.2. North America Economic Outlook

        8.1.3. North America Residential Sector Growth Outlook

        8.1.4. North America Construction Sector Overview

        8.1.5. North America Urbanization Growth Outlook

        8.1.6. Other Macro-Economic Factors

    8.2. Forecast Factors - Relevance & Impact

        8.2.1. Investment in Water Management Sector

        8.2.2. Impact of COVID

        8.2.3. Key Companies Historical Growth Outlook

        8.2.4. Urbanization Growth

        8.2.5. Other Forecast Factors.

    8.3. Value Chain

        8.3.1. List of Manufacturers

        8.3.2. List of Physical Distributors

        8.3.3. Trade Margins/Profit Margins

    8.4. COVID-19 Crisis – Impact Assessment

        8.4.1. Current Statistics

        8.4.2. Short-Mid-Long Term Outlook

        8.4.3. Likely Rebound

    8.5. Market Dynamics

        8.5.1. Drivers

        8.5.2. Restraints

        8.5.3. Opportunity Analysis

    8.6. Patent Analysis

    8.7. Kay Regulations Overview

9. North Market Analysis 2017 to 2021 and Forecast 2022 to 2032, By Inlet Pressure

    9.1. Introduction / Key Findings

    9.2. Historical Market Diameter (US$ Million) and Volume Analysis By Inlet Pressure, 2017 to 2021

    9.3. Current and Future Market Diameter (US$ Million) and Volume Analysis and Forecast By Inlet Pressure, 2022 to 2032

        9.3.1. Direct Acting

        9.3.2. Pilot Operated

    9.4. Market Attractiveness Analysis By Inlet Pressure

10. North Market Analysis 2017 to 2021 and Forecast 2022 to 2032, By Diameter

    10.1. Introduction / Key Findings

    10.2. Historical Market Diameter (US$ Million) and Volume Analysis By Diameter, 2017 to 2021

    10.3. Current and Future Market Diameter (US$ Million) and Volume Analysis and Forecast By Diameter, 2022 to 2032

        10.3.1. Upto 10 bar

        10.3.2. 10 to 15 bar

        10.3.3. 15 to 20 bar

        10.3.4. Above 20 bar

    10.4. Market Attractiveness Analysis By Diameter

11. North Market Analysis 2017 to 2021 and Forecast 2022 to 2032, By Inlet Pressure

    11.1. Introduction / Key Findings

    11.2. Historical Market Diameter (US$ Million) and Volume Analysis By Inlet Pressure, 2017 to 2021

    11.3. Current and Future Market Diameter (US$ Million) and Volume Analysis and Forecast By Inlet Pressure, 2022 to 2032

        11.3.1. 3/8 “

        11.3.2. 1/2“

        11.3.3. 3/4“

        11.3.4. 1”

        11.3.5. 1 ¼”

        11.3.6. Up to 2“

    11.4. Market Attractiveness Analysis By Inlet Pressure

12. North Market Analysis 2017 to 2021 and Forecast 2022 to 2032, By End-Use

    12.1. Introduction / Key Findings

    12.2. Historical Market Diameter (US$ Million) and Volume Analysis By End-Use, 2017 to 2021

    12.3. Current and Future Market Diameter (US$ Million) and Volume Analysis and Forecast By End-Use, 2022 to 2032

        12.3.1. Apartments

        12.3.2. Townhouses

        12.3.3. Villas

        12.3.4. Condominiums

    12.4. Market Attractiveness Analysis By End-Use

13. North Market Analysis 2017 to 2021 and Forecast 2022 to 2032, by Region

    13.1. Introduction

    13.2. Historical Market Diameter (US$ Million) and Volume Analysis by Region, 2017 to 2021

    13.3. Current Market Diameter (US$ Million) and Volume Analysis and Forecast by Region, 2022 to 2032

        13.3.1. USA

        13.3.2. Canada

    13.4. Market Attractiveness Analysis by Region

14. USA Pressure Regulating Valves Market Analysis 2017 to 2021 and Forecast 2022 to 2032

    14.1. Introduction

    14.2. Pricing Analysis

    14.3. Historical Market Diameter (US$ Million) and Volume Trend Analysis by Market Taxonomy, 2017 to 2021

    14.4. Market Diameter (US$ Million) and Volume Forecast by Market Taxonomy, 2022 to 2032

        14.4.1. By Region

            14.4.1.1. North East USA

            14.4.1.2. South USA

            14.4.1.3. Midwest USA

            14.4.1.4. West USA

        14.4.2. By Diameter

        14.4.3. By Inlet Pressure

        14.4.4. By Inlet Pressure

        14.4.5. By End-Use

    14.5. Market Attractiveness Analysis

        14.5.1. By Country

        14.5.2. By Diameter

        14.5.3. By Inlet Pressure

        14.5.4. By Inlet Pressure

        14.5.5. By End-Use

    14.6. Key Market Participants - Intensity Mapping

    14.7. Drivers and Restraints - Impact Analysis

15. Canada Pressure Regulating Valves Market Analysis 2017 to 2021 and Forecast 2022 to 2032

    15.1. Introduction

    15.2. Pricing Analysis

    15.3. Historical Market Diameter (US$ Million) and Volume Trend Analysis by Market Taxonomy, 2017 to 2021

    15.4. Market Diameter (US$ Million) and Volume Forecast by Market Taxonomy, 2022 to 2032

        15.4.1. By Diameter

        15.4.2. By Inlet Pressure

        15.4.3. By Inlet Pressure

        15.4.4. By End-Use

    15.5. Market Attractiveness Analysis

        15.5.1. By Diameter

        15.5.2. By Inlet Pressure

        15.5.3. By Inlet Pressure

        15.5.4. By End-Use

    15.6. Key Market Participants - Intensity Mapping

    15.7. Drivers and Restraints - Impact Analysis

16. Market Structure Analysis

    16.1. Market Analysis by Tier of Companies (Pressure Regulating Valves)

    16.2. Market Share Analysis of Top Players

    16.3. Market Presence Analysis

17. Competition Analysis

    17.1. Competition Dashboard

    17.2. Competition Benchmarking

    17.3. Competition Deep Dive

        17.3.1. Watts

            17.3.1.1. Overview

            17.3.1.2. Product Portfolio

            17.3.1.3. Profitability by Market Segments (Product/Channel/Region)

            17.3.1.4. Sales Footprint

            17.3.1.5. Strategy Overview

        17.3.2. Caleffi S.p.a.

            17.3.2.1. Overview

            17.3.2.2. Product Portfolio

            17.3.2.3. Profitability by Market Segments (Product/Channel/Region)

            17.3.2.4. Sales Footprint

            17.3.2.5. Strategy Overview

        17.3.3. Resideo Technologies Inc.

            17.3.3.1. Overview

            17.3.3.2. Product Portfolio

            17.3.3.3. Profitability by Market Segments (Product/Channel/Region)

            17.3.3.4. Sales Footprint

            17.3.3.5. Strategy Overview

        17.3.4. Emerson Electric Co.

            17.3.4.1. Overview

            17.3.4.2. Product Portfolio

            17.3.4.3. Profitability by Market Segments (Product/Channel/Region)

            17.3.4.4. Sales Footprint

            17.3.4.5. Strategy Overview

        17.3.5. Zurn Water Solutions

            17.3.5.1. Overview

            17.3.5.2. Product Portfolio

            17.3.5.3. Profitability by Market Segments (Product/Channel/Region)

            17.3.5.4. Sales Footprint

            17.3.5.5. Strategy Overview

        17.3.6. Apollo Valves

            17.3.6.1. Overview

            17.3.6.2. Product Portfolio

            17.3.6.3. Profitability by Market Segments (Product/Channel/Region)

            17.3.6.4. Sales Footprint

            17.3.6.5. Strategy Overview

        17.3.7. Reliance Worldwide Corporation

            17.3.7.1. Overview

            17.3.7.2. Product Portfolio

            17.3.7.3. Profitability by Market Segments (Product/Channel/Region)

            17.3.7.4. Sales Footprint

            17.3.7.5. Strategy Overview

        17.3.8. Danfoss A/S

            17.3.8.1. Overview

            17.3.8.2. Product Portfolio

            17.3.8.3. Profitability by Market Segments (Product/Channel/Region)

            17.3.8.4. Sales Footprint

            17.3.8.5. Strategy Overview

        17.3.9. Bradley Corporation

            17.3.9.1. Overview

            17.3.9.2. Product Portfolio

            17.3.9.3. Profitability by Market Segments (Product/Channel/Region)

            17.3.9.4. Sales Footprint

            17.3.9.5. Strategy Overview

        17.3.10. Pegler Yorkshire

            17.3.10.1. Overview

            17.3.10.2. Product Portfolio

            17.3.10.3. Profitability by Market Segments (Product/Channel/Region)

            17.3.10.4. Sales Footprint

            17.3.10.5. Strategy Overview

        17.3.11. ESBE Group

            17.3.11.1. Overview

            17.3.11.2. Product Portfolio

            17.3.11.3. Profitability by Market Segments (Product/Channel/Region)

            17.3.11.4. Sales Footprint

            17.3.11.5. Strategy Overview

        17.3.12. Leonard Valve Company

            17.3.12.1. Overview

            17.3.12.2. Product Portfolio

            17.3.12.3. Profitability by Market Segments (Product/Channel/Region)

            17.3.12.4. Sales Footprint

            17.3.12.5. Strategy Overview

        17.3.13. IMI PLC

            17.3.13.1. Overview

            17.3.13.2. Product Portfolio

            17.3.13.3. Profitability by Market Segments (Product/Channel/Region)

            17.3.13.4. Sales Footprint

            17.3.13.5. Strategy Overview

        17.3.14. AMOT (Allied Motion Technologies)

            17.3.14.1. Overview

            17.3.14.2. Product Portfolio

            17.3.14.3. Profitability by Market Segments (Product/Channel/Region)

            17.3.14.4. Sales Footprint

            17.3.14.5. Strategy Overview

        17.3.15. Other Prominent Players

Note: The list of companies is subject to refinement and augmentation during the course of research

18. Assumptions and Acronyms Used

19. Research Methodology

List of Tables

Table 01: North Market Value (US$ Million) and Volume (‘000 Units) Historical Data 2017 to 2021 and Forecast 2022 to 2032 by Valve Type

Table 02: North Market Value (US$ Million) and Volume (‘000 Units) Historical Data 2017 to 2021 and Forecast 2022 to 2032 by Inlet Pressure

Table 03: North Market Value (US$ Million) and Volume ('000 Units) Historical Data 2017 to 2021 and Forecast 2022 to 2032 By Diameter

Table 04: North Market Value (US$ Million) and Volume (‘000 Units) Historical Data 2017 to 2021 and Forecast 2022 to 2032 By End Use

Table 05: North Market Value (US$ Million) and Volume ('000 Units) Historical Data 2017 to 2021 and Forecast 2022 to 2032 By Country

Table 06: USA Pressure Regulating Valves Market Value (US$ Million) and Volume (‘000 Units) Historical Data 2017 to 2021 and Forecast 2022 to 2032 By Region

Table 07: North Market Value (US$ Million) and Volume (‘000 Units) Historical Data 2017 to 2021 and Forecast 2022 to 2032 by Inlet Pressure

Table 08: North Market Value (US$ Million) and Volume (‘000 Units) Historical Data 2017 to 2021 and Forecast 2022 to 2032 by Inlet Pressure

Table 09: North Market Value (US$ Million) and Volume ('000 Units) Historical Data 2017 to 2021 and Forecast 2022 to 2032 By Diameter

Table 10: North Market Value (US$ Million) and Volume (‘000 Units) Historical Data 2017 to 2021 and Forecast 2022 to 2032 By End Use

Table 11: North Market Value (US$ Million) and Volume (‘000 Units) Historical Data 2017 to 2021 and Forecast 2022 to 2032 by Inlet Pressure

Table 12: North Market Value (US$ Million) and Volume (‘000 Units) Historical Data 2017 to 2021 and Forecast 2022 to 2032 by Inlet Pressure

Table 13: North Market Value (US$ Million) and Volume ('000 Units) Historical Data 2017 to 2021 and Forecast 2022 to 2032 By Diameter

Table 14: North Market Value (US$ Million) and Volume (‘000 Units) Historical Data 2017 to 2021 and Forecast 2022 to 2032 By End Use

List of Charts

Figure 01: North Market Historical Demand, 2017 to 2021

Figure 02: North Market Demand Forecast, 2022 to 2032

Figure 03: North Market Historical Value (US$ Million), 2017 to 2021

Figure 04: North Market Value (US$ Million) Forecast, 2022 to 2032

Figure 05: North Market Absolute $ Opportunity, 2022 to 2032

Figure 06: North Market Share and BPS Analysis by Valve Type- 2022 & 2032

Figure 07: North Market Y-o-Y Growth Projections by Valve Type, 2021 to 2032

Figure 08: North Market Attractiveness by Valve Type, 2022 to 2032

Figure 09: North Market Share and BPS Analysis by Inlet Pressure - 2022 & 2032

Figure 10: North Market Y-o-Y Growth Projections by Inlet Pressure, 2021 to 2032

Figure 11: North Market Attractiveness by Inlet Pressure, 2022 to 2032

Figure 12: North Market Share and BPS Analysis by Diameter - 2022 & 2032

Figure 13: North Market Y-o-Y Growth Projections by Diameter, 2021 to 2032

Figure 14: North Market Attractiveness by Diameter, 2022 to 2032

Figure 15: North Market Share and BPS Analysis by End Use- 2022 & 2032

Figure 16: North Market Y-o-Y Growth Projections by End Use, 2021 to 2032

Figure 17: North Market Attractiveness by End Use, 2022 to 2032

Figure 18: North Market Share and BPS Analysis by Country- 2022 & 2032

Figure 19: North Market Y-o-Y Growth Projections By Country, 2021 to 2032

Figure 20: North Market Attractiveness By Country, 2022 to 2032

Figure 21: USA Pressure Regulating Valves Market Share and BPS Analysis by Region - 2022 & 2032

Figure 22: USA Pressure Regulating Valves Market Y-o-Y Growth Projections by Region, 2021 to 2032

Figure 23: USA Pressure Regulating Valves Market Attractiveness by Region, 2022 to 2032

Figure 24: North Market Share and BPS Analysis by Inlet Pressure- 2022 & 2032

Figure 25: North Market Y-o-Y Growth Projections by Inlet Pressure, 2021 to 2032

Figure 26: North Market Attractiveness by Inlet Pressure, 2022 to 2032

Figure 27: North Market Share and BPS Analysis by Inlet Pressure - 2022 & 2032

Figure 28: North Market Y-o-Y Growth Projections by Inlet Pressure, 2021 to 2032

Figure 29: North Market Attractiveness by Inlet Pressure, 2022 to 2032

Figure 30: North Market Share and BPS Analysis by Diameter - 2022 & 2032

Figure 31: North Market Y-o-Y Growth Projections by Diameter, 2021 to 2032

Figure 32: North Market Attractiveness by Diameter, 2022 to 2032

Figure 33: North Market Share and BPS Analysis by End Use- 2022 & 2032

Figure 34: North Market Y-o-Y Growth Projections by End Use, 2021 to 2032

Figure 35: North Market Attractiveness by End Use, 2022 to 2032

Figure 36: North Market Share and BPS Analysis by Inlet Pressure- 2022 & 2032

Figure 37: North Market Y-o-Y Growth Projections by Inlet Pressure, 2021 to 2032

Figure 38: North Market Attractiveness by Inlet Pressure, 2022 to 2032

Figure 39: North Market Share and BPS Analysis by Inlet Pressure - 2022 & 2032

Figure 40: North Market Y-o-Y Growth Projections by Inlet Pressure, 2021 to 2032

Figure 41: North Market Attractiveness by Inlet Pressure, 2022 to 2032

Figure 42: North Market Share and BPS Analysis by Diameter - 2022 & 2032

Figure 43: North Market Y-o-Y Growth Projections by Diameter, 2021 to 2032

Figure 44: North Market Attractiveness by Diameter, 2022 to 2032

Figure 45: North Market Share and BPS Analysis by End Use- 2022 & 2032

Figure 46: North Market Y-o-Y Growth Projections by End Use, 2021 to 2032

Figure 47: North Market Attractiveness by End Use, 2022 to 2032

Recommendations

Industrial Automation

Pressure Reducing Valve Market

Published : March 2024

Industrial Automation

Industrial Automation Market

Published : January 2023

Explore Industrial Automation Insights

View Reports

North America Pressure Regulating Valves Market