Flame Proof Lighting Market Size and Share Forecast Outlook 2025 to 2035

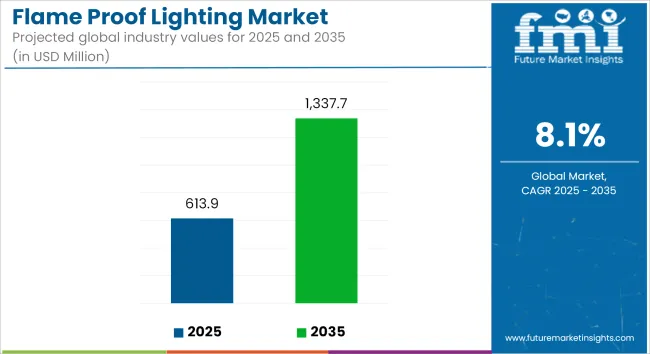
The global flame proof lighting market is estimated at USD 613.9 million in 2025 and is forecast to grow to USD 1,337.7 million by 2035, advancing at a CAGR of 8.1%. Growth is largely fueled by stricter industrial safety regulations, expanding hazardous workplace infrastructure, and rising adoption of energy-efficient, explosion-proof lighting technology.
Quick Stats for Flame Proof Lighting Market

  • Industry Value (2025): USD 613.9 Million
  • Forecast Value (2035): USD 1,337.7 Million
  • Forecast CAGR: 8.1%
  • Leading Segment by End Use in 2025: Industrial
  • Top Key Players: Phoenix Products LLC, Dialight Corporation, Nordland Lighting, Warom Technology Inc., Nemalux Industrial Lighting, Cortem Group, B&R Enclosures Pty Ltd.

Flame Proof Lighting Market

Metric Value
Industry Size (2025E) USD 613.9 million
Industry Value (2035F) USD 1,337.7 million
CAGR (2025 to 2035) 8.1%

The global flame proof lighting market is gaining momentum as safety requirements and modernization initiatives reshape industrial infrastructure. Industries such as oil & gas, mining, chemical manufacturing, and power generation are adopting explosion-proof lighting to comply with ATEX, IECEx, and OSHA regulations.

These zones known for explosive vapors, flammable dust, and extreme operational conditions, demand rugged, long-lasting illumination systems. LED technology has transformed the market by enabling better energy efficiency, longer operational life, and minimal maintenance compared to traditional fluorescent or incandescent systems.

Flame proof LED lights offer faster startup times, better resistance to vibration and shocks, and suitability for integration with smart systems such as IoT sensors and remote diagnostics. These benefits align with Industry 4.0 standards and are pushing global facility managers to invest in scalable, compliant, and intelligent lighting systems. Asia-Pacific continues to show high demand, supported by expanding industrial bases in India, China, and Southeast Asia.
Analyzing Flame Proof Lighting Market by Top Investing Segments

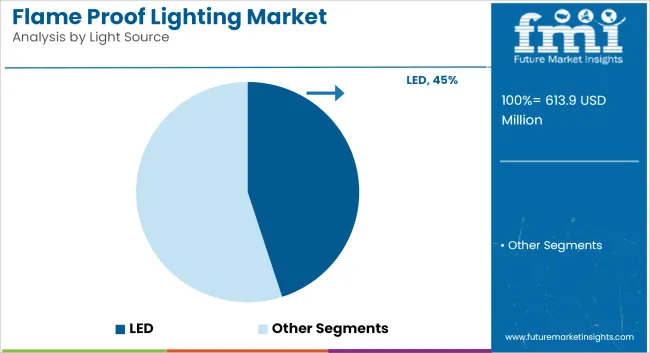
LED Flame Proof Lighting Leads Market Due to High Efficiency, Durability, Instant Illumination, and Compliance with Global Safety Standards

LED flame proof lighting is projected to account for 45% of the global market share in 2025, expanding at a CAGR of 9% through 2035. These systems are rapidly replacing traditional light sources like HID and fluorescent fixtures in hazardous locations. LEDs provide higher efficiency, longer lifespan, better durability against vibration and corrosion, and instant-on functionality-critical in emergency or confined environments.

They also emit less heat, minimizing ignition risks in combustible zones. With stricter energy efficiency mandates and the global phase-out of high-wattage legacy lighting, demand for certified flame proof LEDs is rising in oil refineries, offshore rigs, paint booths, and gas processing plants.

Furthermore, advancements in smart lighting control, integrated sensors, and wireless diagnostics are enhancing functionality, safety, and maintenance scheduling. Key manufacturers are focusing on modular, scalable, and ATEX/IECEx-certified LED systems to support fast deployment in both permanent and temporary installations.
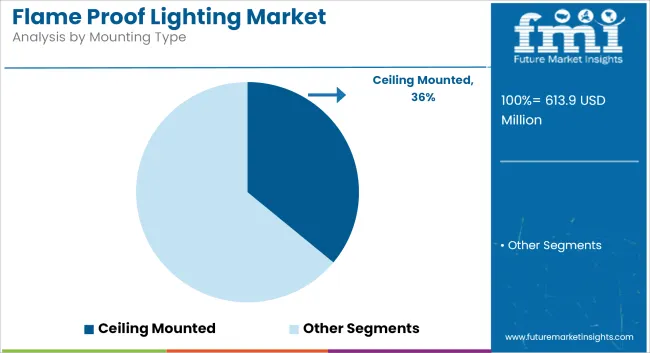
Ceiling Mounted Flame Proof Fixtures Dominate Due to Broad Illumination, Safety, and Versatility across High-Risk Industrial and Marine Environments

Ceiling mounted flame proof lighting is expected to hold approximately 36% market share in 2025, growing at a CAGR of 8.3% through 2035. Ceiling-mounted systems are the preferred configuration across large industrial facilities, warehouses, and marine terminals due to their ability to provide uniform illumination while remaining securely out of reach of operational hazards.

These fixtures support high mounting heights and wide light dispersion, making them ideal for dusty, high-ceiling environments. They also offer flexible integration with lighting control systems and emergency battery backups. Ceiling-mounted flame proof lights are increasingly being adopted in both greenfield and retrofit industrial projects due to their ease of maintenance and compliance with global safety standards.

New models come with corrosion-resistant housings, thermal cut-offs, and vibration-proof brackets, ensuring durability in harsh environments. As safety codes become more stringent across global construction and energy sectors, ceiling-mounted solutions are emerging as the most widely deployed fixture format.

Challenges & Opportunities

Challenges

High Initial Costs and Complexity in Installation

The flame proof lighting market is facing one of the major restraints in the high installation and maintenance cost associated with flame proof lights. This makes them more expensive than conventional lighting options as explosion-proof lighting systems, and especially LED-based solutions, require specialized materials and certifications.

This barrier is mainly cost, so these systems can prove difficult for SMEs (small and mid-sized enterprises) to adopt in volume. Moreover, the need for regular inspections and maintenance checks in compliance with regulatory safety standards adds to the long-term operational expenses.

Another key challenge is the complexity of installation in hazardous environments. Industries such as mining, oil & gas, and offshore drilling require flame proof lighting fixtures to be installed in high-risk areas, where restricted access, harsh environmental conditions, and regulatory constraints make installation and maintenance difficult. Developing modular, easy-to-install lighting solutions can help address this challenge.

Opportunities

Advancements in Smart Lighting and AI-Based Monitoring

The upcoming market potential of intelligent and AI-driven flame proof lighting systems marks for the momentous growth potentiality of the market. The new IoT-enabled lighting systems featured with real-time diagnostics, automatic brightness control, and predictive maintenance are driving the market of hazardous environment lighting applications.

These technologies enable industries to monitor lighting systems remotely, decrease energy consumption, and ensure workplace safety. Companies investing in these areas of AI integrated, Smart explosion-proof lighting are expected to gain a competitive position in the market.

The growth in demand for connected lighting systems is driven by the expansion of smart city projects and automation in industrial safety solutions. In these oil refineries, mining sites and even metro tunnels, cloud-based lighting management platforms are being used to make remote adjustments, track energy and detect faults, which can ultimately enhance safety and efficiency.
Country Wise Analysis

United States

United States flame-proof lighting market is anticipated to grow at a formidable rate due to stringent industrial safety regulations, increasing investments to develop oil & gas infrastructure, and growing adoption of explosion proof lighting in hazardous environment.

Fatigue and performance related accidents have thus led to flame-proof lighting requirements in combustible / explosive atmospheres by OSHA & NEC standards; which are now ubiquitous in petrochemical plants, refineries and underground mining operations.

Further, the growing USA shale gas industry is putting a high demand for energy efficiency and durability flame-proof lighting solutions based on LED technology in such hazardous locations. Market growth is further fueled by the expansion of chemical manufacturing, pharmaceuticals, and wastewater treatment facilities. In addition to this, with hazardous industrial areas moving towards smart lighting solutions that provide IoT-enabled monitoring and automated control features.

  • Stringent OSHA & NEC Regulations for Hazardous Locations: Stricter enforcement from OSHA on safety lighting requirements in high risk industries.
  • Expansion of Shale Gas & Offshore Drilling Operations: Increasing need for long-lasting explosion-proof LED luminaire in refineries and drilling rigs.
  • Technological Advancements in Smart & IoT-Integrated Lighting: Growth of remotely controlled, sensor-based flame-proof lighting.
  • Rising Investments in Chemical & Pharmaceutical Manufacturing Plants: Growing use of explosion-proof lighting in volatile chemical conditions.
  • Growing Demand for Long-Lasting & Maintenance-Free Lighting Solutions: Preference for LED-based flame-proof light fixtures that have longer life and lower operating costs.
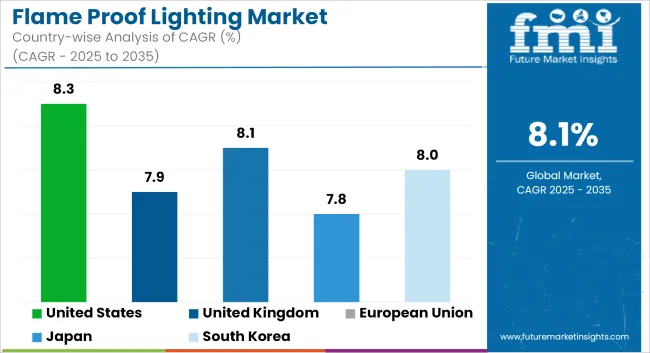
Country CAGR (2025 to 2035)
United States 8.3%

United Kingdom

The United Kingdom flame-proof lighting market is witnessing steady growth, fueled by strong health and safety regulations, increasing offshore oil exploration activities, and advancements in industrial lighting solutions. The Health and Safety Executive (HSE) guidelines for hazardous area lighting have created a greater need for the innovative flame-proof lighting fixtures on offer as a greater number of industrial end-users are investing in such solutions across oil refineries, chemical plants, and also underground mining sites.

The UK’s North Sea oil & gas industry also continues to be an important consumer of explosion-proof lighting, as offshore platforms need corrosion-resistant, high-lumen LED fixtures able to withstand the most extreme weather conditions. Urban infrastructure projects, such as subway and railway expansions, are also using flame-proof lighting-- as are underground tunnels and hazardous work zones.

UK’s importance of lowering carbon emissions and improving energy efficiency, sectors have been moving to a flame-proof LED illuminating setting with minimal energy usage. In addition, evolution of wireless control and adaptive dimming technology are providing traction to the growth of the market.

  • HSE Mandates for Industrial Safety in Hazardous Environments: Rising adoption of ATEX-certified flame-proof lighting solutions.
  • Expansion of North Sea Offshore Oil & Gas Exploration: Increase in demand for corrosion-resistant explosion-proof lighting.
  • Infrastructure Upgrades in Transportation & Public Safety Zones: Increasing deployment of flame-proof lighting in railway tunnels and dangerous industrial applications.
  • Rising Preference for Energy-Efficient & Long-Lifespan LED Lighting: Increasing adoption of low-maintenance explosion-proof LED lighting fixtures.
  • Technological Developments in Wireless & Adaptive Lighting Controls: Increasing use in IoT-enabled smart flame-proof lighting solutions.
Country CAGR (2025 to 2035)
United Kingdom 7.9%

European Union

Surging ATEX (Atmosphères Explosibles) regulations, growth of renewable energy projects and the rising industrial automation will develop the European Union flame-proof lighting market at a high growth rate. Germany, France, and Netherlands are among the early adopters of flame-proof lighting in dangerous working environments such as chemical plants, manufacturing sites and offshore wind farms.

The EU is committed to driving industrial safety and energy-effective industrial solutions, leading to many smart and explosion-proof lighting systems that include hazard detection and automated lighting control. Moreover, growing investments in hydrogen energy infrastructure and industrial refineries are also augmenting the demand for flame-proof lighting solutions with high durability.

In addition, consequent to new applications in aerospace manufacturing and cleanroom environments, the market is expanding. The incorporation of advanced thermal management systems in explosion-proof LED lighting continues to enhance heat resistance and performance life in severe, industrial environments.

  • Strict ATEX Regulations for Flame-Proof Equipment in Industrial Facilities: Higher demand for certified explosion-proof lighting in hazardous areas.
  • Expansion of Offshore Renewable Energy & Hydrogen Infrastructure: Greater use of explosion-proof lighting in offshore wind farms and hydrogen facilities.
  • Growth in Aerospace & High-Risk Manufacturing Sectors: Increase adoption of specialized explosion-proof lighting in cleanrooms and aircraft assembly facilities.
  • Advancements in Thermal Management for High-Temperature Industrial Applications: Development of heat-resistant flame-proof LED fixtures.
  • Integration of Smart Sensors & Automated Hazard Detection in Industrial Lighting: Growing use of AI-powered lighting with predictive alerts for safety.
Region CAGR (2025 to 2035)
European Union 8.1%

Japan

The growth of the market is driven by increasing investments in industrial safety solutions, expansion of smart manufacturing, and adoption of advanced explosion-proof lighting in semiconductor and chemical industries across the country. Japan’s strict fire codes require high performance, flame-proof lighting solutions in hazardous working environments.

Industries are focused on integrating sensor-based flame-proof lighting that ensures operational safety while consuming less energy, as Japan, with its emphasis on precision manufacturing and automation, adopts energy-efficient lighting. The quick developments of the country’s robotics and AI-powered factory automation are also driving demand for automated explosion-proof lighting in hazardous production locations.

Besides, Japan’s hydrogen energy sector and smart grids development is driving demand for flame-proof lighting products at hydrogen fuel cell manufacturing and energy storage sites. One more growing trend is the transition to miniaturized, ultra-lightweight explosion-proof LED lighting for small working areas.

  • Strict Fire Safety & Industrial Hazard Regulations: Strict regulations on fire safety in semiconductor and chemical plants, and flame-proof lighting is mandatory.
  • Expansion of Smart Factories & Industrial Automation: Increased adoption of sensor-based, AI-integrated flame-proof lighting.
  • Growth in Hydrogen Energy & Clean Technology Manufacturing: Hydrogen energy market is growing, and will require explosion-proof lighting for hydrogen fuel cells.
  • Advancements in Miniaturized & Ultra-Lightweight LED Lighting: Compact explosion-proof lighting development for precision workspaces.
  • Rising Use of Heat-Resistant & Anti-Corrosive Lighting Fixtures in Hazardous Areas: Technology shift in nuclear energy and high-tech industrial territories.
Country CAGR (2025 to 2035)
Japan 7.8%

South Korea

Industrial safety regulation initiatives, rising investment in offshore liquefied natural gas (LNG) facilities and surging demand for explosion-proof lighting in semiconductor and petrochemical industries are the key factors boosting the South Korea flame-proof lighting market. The acceleration of intelligent, flame-proof lighting solutions is propelled by South Korea's rapid industrialization and increasingly advanced technology in hazardous environment monitoring.

Demand for heavy-duty, water-resistant explosion-proof lighting is also fueled by the growth of South Korea’s shipbuilding and offshore drilling industries. The country is increasingly utilizing AI-oriented and self-diagnostic flame-proof lighting systems for real-time safety monitoring, with an increasing push for digital transformation and smart factory deployment.

  • Growth in Offshore LNG Processing & Refinery Infrastructure: Increased adoption of marine-grade explosion-proof lighting in offshore LNG processing & refinery infrastructure.
  • Advancements in Digital Smart Lighting for Industrial Safety Applications: Increased demand for IoT-integrated, self-diagnosing flame-proof lighting.
  • Expansion of South Korea’s Shipbuilding & Maritime Sectors: Rising demand for corrosion-resistant lighting in naval and commercial fleets.
  • Rising Use of Explosion-Proof Lighting in Semiconductor Cleanrooms: Increasing demand for explosion-proof lighting technologies in semiconductor.
  • Government Initiatives Promoting Industrial Fire Safety & Compliance: Growth in hazard-rated flame-proof lighting installations.
Country CAGR (2025 to 2035)
South Korea 8.0%

Competitive Outlook

The flame proof lighting market is moderately consolidated, with key players including Phoenix Products LLC, Dialight Corporation, Nordland Lighting, Warom Technology Inc., Nemalux Industrial Lighting, Cortem Group. These companies are focusing on developing smart, rugged, and energy-efficient lighting solutions designed for hazardous zones, with ATEX, IECEx, and UL certifications. Technological innovations such as wireless controls, motion-activated lighting, and built-in diagnostics are reshaping product offerings.

Strategic initiatives include acquisitions, expansion into emerging markets, and partnerships with EPC contractors and oilfield service companies. Growing demand from Asia-Pacific and the Middle East is prompting manufacturers to establish regional manufacturing hubs and service centers. The competitive edge will depend on a firm’s ability to offer high IP-rated, durable lighting systems that are modular, scalable, and compatible with Industry 4.0 systems.

  • May 21, 2025, ABB announced the acquisition of BrightLoop, a French innovator in rugged power electronics. While primarily focused on electrification for industrial vehicles and marine vessels, BrightLoop’s compact, high-efficiency converters are being integrated into ABB’s flame-proof lighting systems for offshore and mining applications, enhancing energy efficiency and reliability in extreme conditions.
  • June 17, 2025. Warom, a major manufacturer of explosion-proof lighting, launched a safety initiative during China’s National Safety Production Month, emphasizing enhanced product quality and reliability in hazardous environments. The campaign included upgrades to flame-proof lighting systems used in petrochemical, mining, and offshore sectors, with a focus on IECEx-certified technologies and smart diagnostics for predictive maintenance.

Key Players

  • Phoenix Products LLC
  • Dialight Corporation
  • Nordland Lighting
  • Warom Technology Inc.
  • Nemalux Industrial Lighting
  • Cortem Group
  • B&R Enclosures Pty Ltd.
  • Appleton (Emerson)
  • Nemalux
  • GIFAS ELECTRIC
  • Adolf Schuch GmbH

Key Segments

By Light Source:

LED, Fluorescent, Incandescent & Halogen, HID (High-Intensity Discharge).

By Mounting Type:

Wall Mounted, Ceiling Mounted, Pole Mounted, Hand Held.

By End Use:

Mining, Marine & Off shore, Warehouses, Malls & Auditoriums, Airports & Transit Stations, Industrial, Commercial, Others.

By Region:

North America, Latin America, East Asia, South Asia & Pacific, Western Europe, Eastern Europe, Middle East & Africa.

Table of Content

  1. Executive Summary
  2. Industry Introduction, including Taxonomy and Market Definition
  3. Market Trends and Success Factors, including Macro-economic Factors, Market Dynamics, and Recent Industry Developments
  4. Global Market Demand Analysis 2020 to 2024 and Forecast 2025 to 2035, including Historical Analysis and Future Projections
  5. Global Market Analysis 2020 to 2024 and Forecast 2025 to 2035
    • Light Source
    • Mounting Type
    • End Use
  6. Global Market Analysis 2020 to 2024 and Forecast 2025 to 2035, By Light Source
    • LED
    • Fluorescent
    • Incandescent & Halogen
    • HID (High-Intensity Discharge)
  7. Global Market Analysis 2020 to 2024 and Forecast 2025 to 2035, By Mounting Type
    • Wall Mounted
    • Ceiling Mounted
    • Pole Mounted
    • Hand Held
  8. Global Market Analysis 2020 to 2024 and Forecast 2025 to 2035, By End Use
    • Mining
    • Marine & Offshore
    • Malls & Auditoriums
    • Airports & Transit Stations
    • Industrial
    • Commercial
    • Others
  9. Global Market Analysis 2020 to 2024 and Forecast 2025 to 2035, By Region
    • North America
    • Latin America
    • Western Europe
    • South Asia
    • East Asia
    • Eastern Europe
    • Middle East & Africa
  10. North America Sales Analysis 2020 to 2024 and Forecast 2025 to 2035, by Key Segments and Countries
  11. Latin America Sales Analysis 2020 to 2024 and Forecast 2025 to 2035, by Key Segments and Countries
  12. Western Europe Sales Analysis 2020 to 2024 and Forecast 2025 to 2035, by Key Segments and Countries
  13. South Asia Sales Analysis 2020 to 2024 and Forecast 2025 to 2035, by Key Segments and Countries
  14. East Asia Sales Analysis 2020 to 2024 and Forecast 2025 to 2035, by Key Segments and Countries
  15. Eastern Europe Sales Analysis 2020 to 2024 and Forecast 2025 to 2035, by Key Segments and Countries
  16. Middle East & Africa Sales Analysis 2020 to 2024 and Forecast 2025 to 2035, by Key Segments and Countries
  17. Sales Forecast 2025 to 2035 by Light Source, Mounting Type, and End Use for 30 Countries
  18. Competition Outlook, including Market Structure Analysis, Company Share Analysis by Key Players, and Competition Dashboard
  19. Company Profile
    • Phoenix Products LLC
    • Dialight Corporation
    • Nordland Lighting
    • Cree Lighting
    • Warom Technology Incorporated
    • Nemalux Industrial Lighting
    • Cortem Group
    • B&R Enclosures Pty Ltd.
    • Schneider Electric SE
    • Appleton (Emerson)

List of Tables

  • Table 1: Global Market Value (USD Million) Forecast by Region, 2020 to 2035
  • Table 2: Global Market Volume (Units) Forecast by Region, 2020 to 2035
  • Table 3: Global Market Value (USD Million) Forecast by Product Type, 2020 to 2035
  • Table 4: Global Market Volume (Units) Forecast by Product Type, 2020 to 2035
  • Table 5: Global Market Value (USD Million) Forecast by Application Type, 2020 to 2035
  • Table 6: Global Market Volume (Units) Forecast by Application Type, 2020 to 2035
  • Table 7: Global Market Value (USD Million) Forecast by Distribution Channels, 2020 to 2035
  • Table 8: Global Market Volume (Units) Forecast by Distribution Channels, 2020 to 2035
  • Table 9: North America Market Value (USD Million) Forecast by Country, 2020 to 2035
  • Table 10: North America Market Volume (Units) Forecast by Country, 2020 to 2035
  • Table 11: North America Market Value (USD Million) Forecast by Product Type, 2020 to 2035
  • Table 12: North America Market Volume (Units) Forecast by Product Type, 2020 to 2035
  • Table 13: North America Market Value (USD Million) Forecast by Application Type, 2020 to 2035
  • Table 14: North America Market Volume (Units) Forecast by Application Type, 2020 to 2035
  • Table 15: North America Market Value (USD Million) Forecast by Distribution Channels, 2020 to 2035
  • Table 16: North America Market Volume (Units) Forecast by Distribution Channels, 2020 to 2035
  • Table 17: Latin America Market Value (USD Million) Forecast by Country, 2020 to 2035
  • Table 18: Latin America Market Volume (Units) Forecast by Country, 2020 to 2035
  • Table 19: Latin America Market Value (USD Million) Forecast by Product Type, 2020 to 2035
  • Table 20: Latin America Market Volume (Units) Forecast by Product Type, 2020 to 2035
  • Table 21: Latin America Market Value (USD Million) Forecast by Application Type, 2020 to 2035
  • Table 22: Latin America Market Volume (Units) Forecast by Application Type, 2020 to 2035
  • Table 23: Latin America Market Value (USD Million) Forecast by Distribution Channels, 2020 to 2035
  • Table 24: Latin America Market Volume (Units) Forecast by Distribution Channels, 2020 to 2035
  • Table 25: Western Europe Market Value (USD Million) Forecast by Country, 2020 to 2035
  • Table 26: Western Europe Market Volume (Units) Forecast by Country, 2020 to 2035
  • Table 27: Western Europe Market Value (USD Million) Forecast by Product Type, 2020 to 2035
  • Table 28: Western Europe Market Volume (Units) Forecast by Product Type, 2020 to 2035
  • Table 29: Western Europe Market Value (USD Million) Forecast by Application Type, 2020 to 2035
  • Table 30: Western Europe Market Volume (Units) Forecast by Application Type, 2020 to 2035
  • Table 31: Western Europe Market Value (USD Million) Forecast by Distribution Channels, 2020 to 2035
  • Table 32: Western Europe Market Volume (Units) Forecast by Distribution Channels, 2020 to 2035
  • Table 33: Eastern Europe Market Value (USD Million) Forecast by Country, 2020 to 2035
  • Table 34: Eastern Europe Market Volume (Units) Forecast by Country, 2020 to 2035
  • Table 35: Eastern Europe Market Value (USD Million) Forecast by Product Type, 2020 to 2035
  • Table 36: Eastern Europe Market Volume (Units) Forecast by Product Type, 2020 to 2035
  • Table 37: Eastern Europe Market Value (USD Million) Forecast by Application Type, 2020 to 2035
  • Table 38: Eastern Europe Market Volume (Units) Forecast by Application Type, 2020 to 2035
  • Table 39: Eastern Europe Market Value (USD Million) Forecast by Distribution Channels, 2020 to 2035
  • Table 40: Eastern Europe Market Volume (Units) Forecast by Distribution Channels, 2020 to 2035
  • Table 41: South Asia and Pacific Market Value (USD Million) Forecast by Country, 2020 to 2035
  • Table 42: South Asia and Pacific Market Volume (Units) Forecast by Country, 2020 to 2035
  • Table 43: South Asia and Pacific Market Value (USD Million) Forecast by Product Type, 2020 to 2035
  • Table 44: South Asia and Pacific Market Volume (Units) Forecast by Product Type, 2020 to 2035
  • Table 45: South Asia and Pacific Market Value (USD Million) Forecast by Application Type, 2020 to 2035
  • Table 46: South Asia and Pacific Market Volume (Units) Forecast by Application Type, 2020 to 2035
  • Table 47: South Asia and Pacific Market Value (USD Million) Forecast by Distribution Channels, 2020 to 2035
  • Table 48: South Asia and Pacific Market Volume (Units) Forecast by Distribution Channels, 2020 to 2035
  • Table 49: East Asia Market Value (USD Million) Forecast by Country, 2020 to 2035
  • Table 50: East Asia Market Volume (Units) Forecast by Country, 2020 to 2035
  • Table 51: East Asia Market Value (USD Million) Forecast by Product Type, 2020 to 2035
  • Table 52: East Asia Market Volume (Units) Forecast by Product Type, 2020 to 2035
  • Table 53: East Asia Market Value (USD Million) Forecast by Application Type, 2020 to 2035
  • Table 54: East Asia Market Volume (Units) Forecast by Application Type, 2020 to 2035
  • Table 55: East Asia Market Value (USD Million) Forecast by Distribution Channels, 2020 to 2035
  • Table 56: East Asia Market Volume (Units) Forecast by Distribution Channels, 2020 to 2035
  • Table 57: Middle East and Africa Market Value (USD Million) Forecast by Country, 2020 to 2035
  • Table 58: Middle East and Africa Market Volume (Units) Forecast by Country, 2020 to 2035
  • Table 59: Middle East and Africa Market Value (USD Million) Forecast by Product Type, 2020 to 2035
  • Table 60: Middle East and Africa Market Volume (Units) Forecast by Product Type, 2020 to 2035
  • Table 61: Middle East and Africa Market Value (USD Million) Forecast by Application Type, 2020 to 2035
  • Table 62: Middle East and Africa Market Volume (Units) Forecast by Application Type, 2020 to 2035
  • Table 63: Middle East and Africa Market Value (USD Million) Forecast by Distribution Channels, 2020 to 2035
  • Table 64: Middle East and Africa Market Volume (Units) Forecast by Distribution Channels, 2020 to 2035

List of Figures

  • Figure 1: Global Market Value (USD Million) by Product Type, 2025 to 2035
  • Figure 2: Global Market Value (USD Million) by Application Type, 2025 to 2035
  • Figure 3: Global Market Value (USD Million) by Distribution Channels, 2025 to 2035
  • Figure 4: Global Market Value (USD Million) by Region, 2025 to 2035
  • Figure 5: Global Market Value (USD Million) Analysis by Region, 2020 to 2035
  • Figure 6: Global Market Volume (Units) Analysis by Region, 2020 to 2035
  • Figure 7: Global Market Value Share (%) and BPS Analysis by Region, 2025 to 2035
  • Figure 8: Global Market Y-o-Y Growth (%) Projections by Region, 2025 to 2035
  • Figure 9: Global Market Value (USD Million) Analysis by Product Type, 2020 to 2035
  • Figure 10: Global Market Volume (Units) Analysis by Product Type, 2020 to 2035
  • Figure 11: Global Market Value Share (%) and BPS Analysis by Product Type, 2025 to 2035
  • Figure 12: Global Market Y-o-Y Growth (%) Projections by Product Type, 2025 to 2035
  • Figure 13: Global Market Value (USD Million) Analysis by Application Type, 2020 to 2035
  • Figure 14: Global Market Volume (Units) Analysis by Application Type, 2020 to 2035
  • Figure 15: Global Market Value Share (%) and BPS Analysis by Application Type, 2025 to 2035
  • Figure 16: Global Market Y-o-Y Growth (%) Projections by Application Type, 2025 to 2035
  • Figure 17: Global Market Value (USD Million) Analysis by Distribution Channels, 2020 to 2035
  • Figure 18: Global Market Volume (Units) Analysis by Distribution Channels, 2020 to 2035
  • Figure 19: Global Market Value Share (%) and BPS Analysis by Distribution Channels, 2025 to 2035
  • Figure 20: Global Market Y-o-Y Growth (%) Projections by Distribution Channels, 2025 to 2035
  • Figure 21: Global Market Attractiveness by Product Type, 2025 to 2035
  • Figure 22: Global Market Attractiveness by Application Type, 2025 to 2035
  • Figure 23: Global Market Attractiveness by Distribution Channels, 2025 to 2035
  • Figure 24: Global Market Attractiveness by Region, 2025 to 2035
  • Figure 25: North America Market Value (USD Million) by Product Type, 2025 to 2035
  • Figure 26: North America Market Value (USD Million) by Application Type, 2025 to 2035
  • Figure 27: North America Market Value (USD Million) by Distribution Channels, 2025 to 2035
  • Figure 28: North America Market Value (USD Million) by Country, 2025 to 2035
  • Figure 29: North America Market Value (USD Million) Analysis by Country, 2020 to 2035
  • Figure 30: North America Market Volume (Units) Analysis by Country, 2020 to 2035
  • Figure 31: North America Market Value Share (%) and BPS Analysis by Country, 2025 to 2035
  • Figure 32: North America Market Y-o-Y Growth (%) Projections by Country, 2025 to 2035
  • Figure 33: North America Market Value (USD Million) Analysis by Product Type, 2020 to 2035
  • Figure 34: North America Market Volume (Units) Analysis by Product Type, 2020 to 2035
  • Figure 35: North America Market Value Share (%) and BPS Analysis by Product Type, 2025 to 2035
  • Figure 36: North America Market Y-o-Y Growth (%) Projections by Product Type, 2025 to 2035
  • Figure 37: North America Market Value (USD Million) Analysis by Application Type, 2020 to 2035
  • Figure 38: North America Market Volume (Units) Analysis by Application Type, 2020 to 2035
  • Figure 39: North America Market Value Share (%) and BPS Analysis by Application Type, 2025 to 2035
  • Figure 40: North America Market Y-o-Y Growth (%) Projections by Application Type, 2025 to 2035
  • Figure 41: North America Market Value (USD Million) Analysis by Distribution Channels, 2020 to 2035
  • Figure 42: North America Market Volume (Units) Analysis by Distribution Channels, 2020 to 2035
  • Figure 43: North America Market Value Share (%) and BPS Analysis by Distribution Channels, 2025 to 2035
  • Figure 44: North America Market Y-o-Y Growth (%) Projections by Distribution Channels, 2025 to 2035
  • Figure 45: North America Market Attractiveness by Product Type, 2025 to 2035
  • Figure 46: North America Market Attractiveness by Application Type, 2025 to 2035
  • Figure 47: North America Market Attractiveness by Distribution Channels, 2025 to 2035
  • Figure 48: North America Market Attractiveness by Country, 2025 to 2035
  • Figure 49: Latin America Market Value (USD Million) by Product Type, 2025 to 2035
  • Figure 50: Latin America Market Value (USD Million) by Application Type, 2025 to 2035
  • Figure 51: Latin America Market Value (USD Million) by Distribution Channels, 2025 to 2035
  • Figure 52: Latin America Market Value (USD Million) by Country, 2025 to 2035
  • Figure 53: Latin America Market Value (USD Million) Analysis by Country, 2020 to 2035
  • Figure 54: Latin America Market Volume (Units) Analysis by Country, 2020 to 2035
  • Figure 55: Latin America Market Value Share (%) and BPS Analysis by Country, 2025 to 2035
  • Figure 56: Latin America Market Y-o-Y Growth (%) Projections by Country, 2025 to 2035
  • Figure 57: Latin America Market Value (USD Million) Analysis by Product Type, 2020 to 2035
  • Figure 58: Latin America Market Volume (Units) Analysis by Product Type, 2020 to 2035
  • Figure 59: Latin America Market Value Share (%) and BPS Analysis by Product Type, 2025 to 2035
  • Figure 60: Latin America Market Y-o-Y Growth (%) Projections by Product Type, 2025 to 2035
  • Figure 61: Latin America Market Value (USD Million) Analysis by Application Type, 2020 to 2035
  • Figure 62: Latin America Market Volume (Units) Analysis by Application Type, 2020 to 2035
  • Figure 63: Latin America Market Value Share (%) and BPS Analysis by Application Type, 2025 to 2035
  • Figure 64: Latin America Market Y-o-Y Growth (%) Projections by Application Type, 2025 to 2035
  • Figure 65: Latin America Market Value (USD Million) Analysis by Distribution Channels, 2020 to 2035
  • Figure 66: Latin America Market Volume (Units) Analysis by Distribution Channels, 2020 to 2035
  • Figure 67: Latin America Market Value Share (%) and BPS Analysis by Distribution Channels, 2025 to 2035
  • Figure 68: Latin America Market Y-o-Y Growth (%) Projections by Distribution Channels, 2025 to 2035
  • Figure 69: Latin America Market Attractiveness by Product Type, 2025 to 2035
  • Figure 70: Latin America Market Attractiveness by Application Type, 2025 to 2035
  • Figure 71: Latin America Market Attractiveness by Distribution Channels, 2025 to 2035
  • Figure 72: Latin America Market Attractiveness by Country, 2025 to 2035
  • Figure 73: Western Europe Market Value (USD Million) by Product Type, 2025 to 2035
  • Figure 74: Western Europe Market Value (USD Million) by Application Type, 2025 to 2035
  • Figure 75: Western Europe Market Value (USD Million) by Distribution Channels, 2025 to 2035
  • Figure 76: Western Europe Market Value (USD Million) by Country, 2025 to 2035
  • Figure 77: Western Europe Market Value (USD Million) Analysis by Country, 2020 to 2035
  • Figure 78: Western Europe Market Volume (Units) Analysis by Country, 2020 to 2035
  • Figure 79: Western Europe Market Value Share (%) and BPS Analysis by Country, 2025 to 2035
  • Figure 80: Western Europe Market Y-o-Y Growth (%) Projections by Country, 2025 to 2035
  • Figure 81: Western Europe Market Value (USD Million) Analysis by Product Type, 2020 to 2035
  • Figure 82: Western Europe Market Volume (Units) Analysis by Product Type, 2020 to 2035
  • Figure 83: Western Europe Market Value Share (%) and BPS Analysis by Product Type, 2025 to 2035
  • Figure 84: Western Europe Market Y-o-Y Growth (%) Projections by Product Type, 2025 to 2035
  • Figure 85: Western Europe Market Value (USD Million) Analysis by Application Type, 2020 to 2035
  • Figure 86: Western Europe Market Volume (Units) Analysis by Application Type, 2020 to 2035
  • Figure 87: Western Europe Market Value Share (%) and BPS Analysis by Application Type, 2025 to 2035
  • Figure 88: Western Europe Market Y-o-Y Growth (%) Projections by Application Type, 2025 to 2035
  • Figure 89: Western Europe Market Value (USD Million) Analysis by Distribution Channels, 2020 to 2035
  • Figure 90: Western Europe Market Volume (Units) Analysis by Distribution Channels, 2020 to 2035
  • Figure 91: Western Europe Market Value Share (%) and BPS Analysis by Distribution Channels, 2025 to 2035
  • Figure 92: Western Europe Market Y-o-Y Growth (%) Projections by Distribution Channels, 2025 to 2035
  • Figure 93: Western Europe Market Attractiveness by Product Type, 2025 to 2035
  • Figure 94: Western Europe Market Attractiveness by Application Type, 2025 to 2035
  • Figure 95: Western Europe Market Attractiveness by Distribution Channels, 2025 to 2035
  • Figure 96: Western Europe Market Attractiveness by Country, 2025 to 2035
  • Figure 97: Eastern Europe Market Value (USD Million) by Product Type, 2025 to 2035
  • Figure 98: Eastern Europe Market Value (USD Million) by Application Type, 2025 to 2035
  • Figure 99: Eastern Europe Market Value (USD Million) by Distribution Channels, 2025 to 2035
  • Figure 100: Eastern Europe Market Value (USD Million) by Country, 2025 to 2035
  • Figure 101: Eastern Europe Market Value (USD Million) Analysis by Country, 2020 to 2035
  • Figure 102: Eastern Europe Market Volume (Units) Analysis by Country, 2020 to 2035
  • Figure 103: Eastern Europe Market Value Share (%) and BPS Analysis by Country, 2025 to 2035
  • Figure 104: Eastern Europe Market Y-o-Y Growth (%) Projections by Country, 2025 to 2035
  • Figure 105: Eastern Europe Market Value (USD Million) Analysis by Product Type, 2020 to 2035
  • Figure 106: Eastern Europe Market Volume (Units) Analysis by Product Type, 2020 to 2035
  • Figure 107: Eastern Europe Market Value Share (%) and BPS Analysis by Product Type, 2025 to 2035
  • Figure 108: Eastern Europe Market Y-o-Y Growth (%) Projections by Product Type, 2025 to 2035
  • Figure 109: Eastern Europe Market Value (USD Million) Analysis by Application Type, 2020 to 2035
  • Figure 110: Eastern Europe Market Volume (Units) Analysis by Application Type, 2020 to 2035
  • Figure 111: Eastern Europe Market Value Share (%) and BPS Analysis by Application Type, 2025 to 2035
  • Figure 112: Eastern Europe Market Y-o-Y Growth (%) Projections by Application Type, 2025 to 2035
  • Figure 113: Eastern Europe Market Value (USD Million) Analysis by Distribution Channels, 2020 to 2035
  • Figure 114: Eastern Europe Market Volume (Units) Analysis by Distribution Channels, 2020 to 2035
  • Figure 115: Eastern Europe Market Value Share (%) and BPS Analysis by Distribution Channels, 2025 to 2035
  • Figure 116: Eastern Europe Market Y-o-Y Growth (%) Projections by Distribution Channels, 2025 to 2035
  • Figure 117: Eastern Europe Market Attractiveness by Product Type, 2025 to 2035
  • Figure 118: Eastern Europe Market Attractiveness by Application Type, 2025 to 2035
  • Figure 119: Eastern Europe Market Attractiveness by Distribution Channels, 2025 to 2035
  • Figure 120: Eastern Europe Market Attractiveness by Country, 2025 to 2035
  • Figure 121: South Asia and Pacific Market Value (USD Million) by Product Type, 2025 to 2035
  • Figure 122: South Asia and Pacific Market Value (USD Million) by Application Type, 2025 to 2035
  • Figure 123: South Asia and Pacific Market Value (USD Million) by Distribution Channels, 2025 to 2035
  • Figure 124: South Asia and Pacific Market Value (USD Million) by Country, 2025 to 2035
  • Figure 125: South Asia and Pacific Market Value (USD Million) Analysis by Country, 2020 to 2035
  • Figure 126: South Asia and Pacific Market Volume (Units) Analysis by Country, 2020 to 2035
  • Figure 127: South Asia and Pacific Market Value Share (%) and BPS Analysis by Country, 2025 to 2035
  • Figure 128: South Asia and Pacific Market Y-o-Y Growth (%) Projections by Country, 2025 to 2035
  • Figure 129: South Asia and Pacific Market Value (USD Million) Analysis by Product Type, 2020 to 2035
  • Figure 130: South Asia and Pacific Market Volume (Units) Analysis by Product Type, 2020 to 2035
  • Figure 131: South Asia and Pacific Market Value Share (%) and BPS Analysis by Product Type, 2025 to 2035
  • Figure 132: South Asia and Pacific Market Y-o-Y Growth (%) Projections by Product Type, 2025 to 2035
  • Figure 133: South Asia and Pacific Market Value (USD Million) Analysis by Application Type, 2020 to 2035
  • Figure 134: South Asia and Pacific Market Volume (Units) Analysis by Application Type, 2020 to 2035
  • Figure 135: South Asia and Pacific Market Value Share (%) and BPS Analysis by Application Type, 2025 to 2035
  • Figure 136: South Asia and Pacific Market Y-o-Y Growth (%) Projections by Application Type, 2025 to 2035
  • Figure 137: South Asia and Pacific Market Value (USD Million) Analysis by Distribution Channels, 2020 to 2035
  • Figure 138: South Asia and Pacific Market Volume (Units) Analysis by Distribution Channels, 2020 to 2035
  • Figure 139: South Asia and Pacific Market Value Share (%) and BPS Analysis by Distribution Channels, 2025 to 2035
  • Figure 140: South Asia and Pacific Market Y-o-Y Growth (%) Projections by Distribution Channels, 2025 to 2035
  • Figure 141: South Asia and Pacific Market Attractiveness by Product Type, 2025 to 2035
  • Figure 142: South Asia and Pacific Market Attractiveness by Application Type, 2025 to 2035
  • Figure 143: South Asia and Pacific Market Attractiveness by Distribution Channels, 2025 to 2035
  • Figure 144: South Asia and Pacific Market Attractiveness by Country, 2025 to 2035
  • Figure 145: East Asia Market Value (USD Million) by Product Type, 2025 to 2035
  • Figure 146: East Asia Market Value (USD Million) by Application Type, 2025 to 2035
  • Figure 147: East Asia Market Value (USD Million) by Distribution Channels, 2025 to 2035
  • Figure 148: East Asia Market Value (USD Million) by Country, 2025 to 2035
  • Figure 149: East Asia Market Value (USD Million) Analysis by Country, 2020 to 2035
  • Figure 150: East Asia Market Volume (Units) Analysis by Country, 2020 to 2035
  • Figure 151: East Asia Market Value Share (%) and BPS Analysis by Country, 2025 to 2035
  • Figure 152: East Asia Market Y-o-Y Growth (%) Projections by Country, 2025 to 2035
  • Figure 153: East Asia Market Value (USD Million) Analysis by Product Type, 2020 to 2035
  • Figure 154: East Asia Market Volume (Units) Analysis by Product Type, 2020 to 2035
  • Figure 155: East Asia Market Value Share (%) and BPS Analysis by Product Type, 2025 to 2035
  • Figure 156: East Asia Market Y-o-Y Growth (%) Projections by Product Type, 2025 to 2035
  • Figure 157: East Asia Market Value (USD Million) Analysis by Application Type, 2020 to 2035
  • Figure 158: East Asia Market Volume (Units) Analysis by Application Type, 2020 to 2035
  • Figure 159: East Asia Market Value Share (%) and BPS Analysis by Application Type, 2025 to 2035
  • Figure 160: East Asia Market Y-o-Y Growth (%) Projections by Application Type, 2025 to 2035
  • Figure 161: East Asia Market Value (USD Million) Analysis by Distribution Channels, 2020 to 2035
  • Figure 162: East Asia Market Volume (Units) Analysis by Distribution Channels, 2020 to 2035
  • Figure 163: East Asia Market Value Share (%) and BPS Analysis by Distribution Channels, 2025 to 2035
  • Figure 164: East Asia Market Y-o-Y Growth (%) Projections by Distribution Channels, 2025 to 2035
  • Figure 165: East Asia Market Attractiveness by Product Type, 2025 to 2035
  • Figure 166: East Asia Market Attractiveness by Application Type, 2025 to 2035
  • Figure 167: East Asia Market Attractiveness by Distribution Channels, 2025 to 2035
  • Figure 168: East Asia Market Attractiveness by Country, 2025 to 2035
  • Figure 169: Middle East and Africa Market Value (USD Million) by Product Type, 2025 to 2035
  • Figure 170: Middle East and Africa Market Value (USD Million) by Application Type, 2025 to 2035
  • Figure 171: Middle East and Africa Market Value (USD Million) by Distribution Channels, 2025 to 2035
  • Figure 172: Middle East and Africa Market Value (USD Million) by Country, 2025 to 2035
  • Figure 173: Middle East and Africa Market Value (USD Million) Analysis by Country, 2020 to 2035
  • Figure 174: Middle East and Africa Market Volume (Units) Analysis by Country, 2020 to 2035
  • Figure 175: Middle East and Africa Market Value Share (%) and BPS Analysis by Country, 2025 to 2035
  • Figure 176: Middle East and Africa Market Y-o-Y Growth (%) Projections by Country, 2025 to 2035
  • Figure 177: Middle East and Africa Market Value (USD Million) Analysis by Product Type, 2020 to 2035
  • Figure 178: Middle East and Africa Market Volume (Units) Analysis by Product Type, 2020 to 2035
  • Figure 179: Middle East and Africa Market Value Share (%) and BPS Analysis by Product Type, 2025 to 2035
  • Figure 180: Middle East and Africa Market Y-o-Y Growth (%) Projections by Product Type, 2025 to 2035
  • Figure 181: Middle East and Africa Market Value (USD Million) Analysis by Application Type, 2020 to 2035
  • Figure 182: Middle East and Africa Market Volume (Units) Analysis by Application Type, 2020 to 2035
  • Figure 183: Middle East and Africa Market Value Share (%) and BPS Analysis by Application Type, 2025 to 2035
  • Figure 184: Middle East and Africa Market Y-o-Y Growth (%) Projections by Application Type, 2025 to 2035
  • Figure 185: Middle East and Africa Market Value (USD Million) Analysis by Distribution Channels, 2020 to 2035
  • Figure 186: Middle East and Africa Market Volume (Units) Analysis by Distribution Channels, 2020 to 2035
  • Figure 187: Middle East and Africa Market Value Share (%) and BPS Analysis by Distribution Channels, 2025 to 2035
  • Figure 188: Middle East and Africa Market Y-o-Y Growth (%) Projections by Distribution Channels, 2025 to 2035
  • Figure 189: Middle East and Africa Market Attractiveness by Product Type, 2025 to 2035
  • Figure 190: Middle East and Africa Market Attractiveness by Application Type, 2025 to 2035
  • Figure 191: Middle East and Africa Market Attractiveness by Distribution Channels, 2025 to 2035
  • Figure 192: Middle East and Africa Market Attractiveness by Country, 2025 to 2035

Frequently Asked Questions

What is the estimated market size of the global flame proof lighting market for 2025?

The global flame proof lighting market is projected to reach USD 613.9 million by the end of 2025.

At what rate is the market expected to grow during the forecast period?

The market is anticipated to grow at a CAGR of 8.1% over the forecast period.

What is the projected market worth by 2035?

By 2035, the flame proof lighting market is expected to reach USD 1,337.7 million.

Which segment is expected to dominate the market?

The LED Flame Proof Lighting segment is expected to dominate due to its superior energy efficiency, longer lifespan, and increasing adoption in hazardous industrial environments such as oil & gas, mining, and chemical processing.

Who are the key players in the flame proof lighting market?

Key players in the flame proof lighting market include Hubbell Incorporated, Larson Electronics, Eaton Corporation, ABB Ltd., and Phoenix Products LLC.

Explore Automation Auxiliary Insights

Future Market Insights

Flame Proof Lighting Market