The global flameproof equipment market is valued at USD 7,139.2 million in 2025 and is expecgted to reach USD 10,876.5 million by 2035, recording an absolute increase of USD 3,737.3 million over the forecast period. This translates into a total growth of 52.3%, with the market forecast to expand at a compound annual growth rate (CAGR) of 4.3% between 2025 and 2035. The overall market size is expected to grow by nearly 1.52X during the same period, supported by increasing demand for explosion-proof safety solutions, growing adoption of hazardous area protection equipment in industrial applications, and rising focus on workplace safety across diverse high-risk industrial environments.
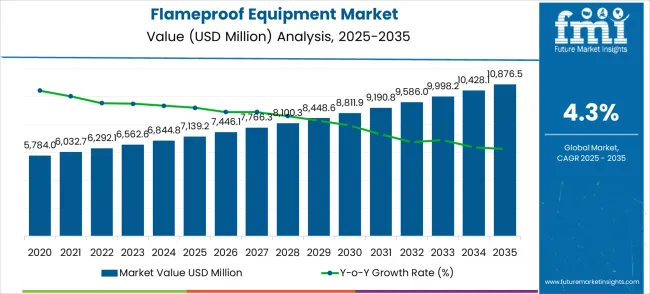
Between 2025 and 2030, the flameproof equipment market is projected to expand from USD 7,139.2 million to USD 8,811.9 million, resulting in a value increase of USD 1,672.7 million, which represents 44.8% of the total forecast growth for the decade. This phase of development will be shaped by increasing industrial safety regulations, rising adoption of explosion-proof technologies in hazardous environments, and growing demand for certified safety equipment that ensures worker protection and regulatory compliance. Industrial facilities and safety equipment manufacturers are expanding their flameproof equipment capabilities to address the growing demand for comprehensive hazardous area protection and workplace safety solutions.
| Metric | Value |
|---|---|
| Estimated Value in (2025E) | USD 7,139.2 million |
| Forecast Value in (2035F) | USD 10,876.5 million |
| Forecast CAGR (2025 to 2035) | 4.3% |
The oil and gas industry leads the market, contributing 40-45%, as flameproof equipment is essential in exploration, extraction, refining, and storage activities to prevent ignition of volatile substances in offshore rigs, drilling sites, and refineries. The chemical and petrochemical industries follow with 25-30%, where the handling of flammable chemicals and materials necessitates the use of flameproof equipment in processing, storage, and transportation facilities to minimize risks. The mining industry holds a share of 15-18%, particularly in underground operations where explosive gases like methane are present, requiring strict safety standards to prevent ignition. The pharmaceutical industry contributes 10-12%, driven by the need for flameproof equipment in production areas where flammable solvents, chemicals, and powders are used, ensuring safety in manufacturing plants. Other industries such as food processing, power generation, and utilities make up 5-8% of the market, utilizing flameproof equipment in environments handling combustible dust or gases.
The flameproof equipment market is set for steady growth, advancing from USD 7.1 billion in 2025 to USD 10.9 billion in 2035 at a 4.3% CAGR. Growth is being fueled by rising industrial safety regulations, the critical need for hazardous area protection, and technological upgrades in explosion prevention systems across the petrochemical, mining, and manufacturing sectors. Asia-Pacific, led by China and India, will be the most dynamic growth hub, while North America and Europe continue to rely on advanced regulatory frameworks and Industry 4.0 integration. The future opportunity lies in smart safety systems, predictive analytics integration, and certified, globally compliant solutions that provide both worker safety and operational reliability.
Pathway A - Class I Equipment Leadership. With gas and vapor hazards dominating in petrochemicals and industrial processing, Class I flameproof equipment will remain the backbone of hazardous area protection. Companies that build advanced, cost-effective, and globally certified Class I solutions can consolidate leadership. Revenue pool: USD 1.0–1.4 billion.
Pathway B - Petrochemical Industry Expansion. The petrochemical sector is the largest application segment, demanding high-reliability flameproof systems for refineries and chemical plants. Tailored solutions and integrated safety programs will unlock significant adoption. Opportunity: USD 0.8-1.2 billion.
Pathway C - Smart Safety & IoT-Enabled Solutions. Digitalization is driving demand for real-time monitoring, predictive analytics, and connected flameproof systems. Firms that offer IoT-ready equipment and condition monitoring platforms can secure premium margins. Revenue lift: USD 0.6–0.9 billion.
Pathway D - Predictive Analytics & Maintenance Efficiency. Industrial buyers increasingly prioritize systems that reduce downtime through predictive failure detection and proactive maintenance. Vendors delivering analytics-enabled flameproof equipment gain recurring revenue from monitoring and service contracts. Pool: USD 0.5-0.8 billion.
Pathway E - Asia-Pacific Growth & Localization. China (5.8% CAGR) and India (5.4% CAGR) are the fastest-growing markets. Localized production, cost-sensitive solutions, and regional certification strategies will be key for global players to capture share. Expected upside: USD 1.2-1.6 billion.
Pathway F - Integrated Safety Management Systems. Large industrial operators increasingly want all-in-one safety ecosystems integrating flameproof gear with automation and risk management. Companies offering turnkey systems will gain long-term contracts. Opportunity: USD 0.7-1.0 billion.
Pathway G - Compliance & Certification Services. As regulations tighten worldwide, demand for certified, tested, and standards-compliant equipment rises. Vendors that streamline compliance and offer certification-backed guarantees can secure premium positioning. Pool: USD 0.4-0.6 billion.
Market expansion is being supported by the increasing global focus on industrial safety and the corresponding need for comprehensive explosion protection solutions that can prevent accidents, ensure worker safety, and maintain operational integrity across various hazardous industrial environments and high-risk applications. Modern industrial operators and safety managers are increasingly focused on implementing protection solutions that can eliminate ignition sources, prevent explosions, and provide reliable safety performance in challenging industrial conditions. Flameproof equipment's proven ability to deliver explosion prevention, ensure regulatory compliance, and support operational safety makes it essential infrastructure for contemporary hazardous area operations and industrial safety management.
The growing focus on regulatory compliance and workplace safety is driving demand for flameproof equipment that can support safety standards, prevent industrial accidents, and enable comprehensive hazardous area management. Industrial operators' preference for safety solutions that combine explosion protection with operational reliability and maintenance efficiency is creating opportunities for innovative flameproof equipment implementations. The rising influence of safety regulations and risk management requirements is also contributing to increased adoption of flameproof equipment that can provide comprehensive protection without compromising operational efficiency or productivity.
The market is segmented by class, application, and region. By class, the market is divided into Class I, Class II, Class III, and others. Based on application, the market is categorized into the petrochemical industry, the mining industry, the industrial sector, and others. Regionally, the market is divided into Asia Pacific, North America, Europe, Latin America, and the Middle East & Africa.
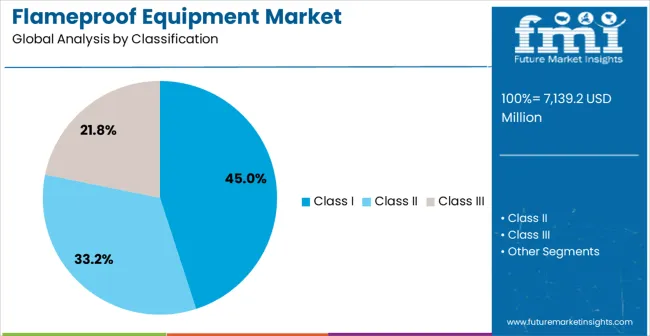
The Class I segment is projected to maintain its leading position in the flameproof equipment market in 2025, capturing 45% of the market share. Industrial operators and safety professionals increasingly rely on Class I flameproof equipment for its comprehensive protection against flammable gases and vapors. This protection category is essential in petrochemical and industrial environments where safety is critical. Class I flameproof technology ensures explosion prevention and hazardous area protection while meeting established safety standards and regulatory compliance. It forms the backbone of modern hazardous area protection systems, with a proven record of effectiveness across multiple industrial sectors. Industrial investments in Class I flameproof equipment continue to grow, further strengthening its adoption among safety managers and facility operators. With a focus on safety and compliance, Class I equipment remains central to comprehensive protection strategies in gas and vapor environments.
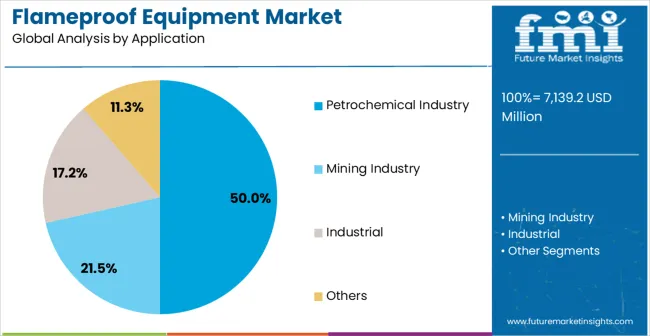
The petrochemical industry application segment is projected to represent the largest share of flameproof equipment demand in 2025, with 50% of the market. Explosion-proof equipment is essential in petrochemical operations, particularly in oil refineries, chemical processing plants, and petrochemical manufacturing facilities, where hazardous environments pose significant safety risks. Petrochemical operators favor flameproof equipment for its ability to meet comprehensive safety requirements while ensuring continuous operations. The segment benefits from continuous innovation in explosion protection technologies, with specialized systems offering enhanced reliability and regulatory alignment. Petrochemical operators are investing in comprehensive safety programs to meet the growing complexity of operations and safety standards. As safety regulations become more stringent, the petrochemical industry application will continue to lead the market, supporting advanced protection and safety management strategies in hazardous industrial environments.
The flameproof equipment market is advancing steadily due to increasing demand for industrial safety and growing adoption of explosion protection technologies that provide enhanced worker protection and operational safety across diverse hazardous industrial environments. The market faces challenges, including high equipment costs and installation complexity, stringent certification requirements and approval processes, and the need for specialized expertise in safety system design and maintenance. Innovation in smart safety technologies and predictive monitoring systems continues to influence product development and market expansion patterns.
The growing adoption of intelligent safety systems and IoT-enabled monitoring technologies is enabling industrial operators to achieve superior safety management, predictive maintenance capabilities, and real-time hazard detection for enhanced operational safety. Smart safety systems provide improved risk management while allowing more proactive safety monitoring and consistent protection across various industrial environments and operational conditions. Manufacturers are increasingly recognizing the competitive advantages of smart safety capabilities for operational differentiation and safety optimization.
Modern flameproof equipment manufacturers are incorporating predictive analytics technologies and condition monitoring systems to enhance equipment reliability, enable preventive maintenance, and ensure optimal safety performance through continuous system health assessment. These technologies improve operational efficiency while enabling new applications, including remote monitoring and predictive failure analysis. Advanced analytics integration also allows operators to support comprehensive safety management and equipment optimization beyond traditional reactive maintenance approaches.
| Country | CAGR (2025-2035) |
|---|---|
| China | 5.8% |
| India | 5.4% |
| Germany | 4.9% |
| Brazil | 4.5% |
| USA | 4.1% |
| UK | 3.7% |
| Japan | 3.2% |
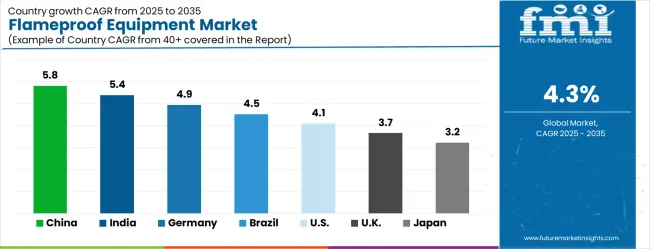
The flameproof equipment market is experiencing solid growth globally, with China leading at a 5.8% CAGR through 2035, driven by the expanding industrial sector, growing petrochemical industry development, and significant investment in industrial safety infrastructure and hazardous area protection systems. India follows at 5.4%, supported by rapid industrialization, increasing manufacturing activities, and growing adoption of safety equipment in dangerous industrial environments. Germany shows growth at 4.9%, emphasizing advanced safety engineering and precision industrial protection technologies. Brazil records 4.5%, focusing on industrial modernization and safety improvement initiatives in the mining and petrochemical sectors. The USA demonstrates 4.1% growth, supported by established safety regulations and an focus on industrial accident prevention. The UK exhibits 3.7% growth, emphasizing safety compliance and industrial protection standards. Japan shows 3.2% growth, supported by advanced industrial technologies and precision safety equipment manufacturing.
The report covers an in-depth analysis of 40+ countries, with top-performing countries highlighted below.
The flameproof equipment market is set to grow at a CAGR of 5.8% from 2025 to 2035. As one of the largest industrial economies, China continues to expand its manufacturing, oil, and gas sectors, all of which demand advanced safety systems, particularly flameproof equipment. Stringent industrial safety regulations are driving the need for equipment that prevents explosions in hazardous environments. China's investment in technological advancements and industrial automation is expected to further boost the demand for flameproof solutions. The rapid growth in construction, infrastructure, and energy projects is fueling the need for reliable and compliant safety equipment. The increasing focus on the safety of workers in high-risk industries is a key factor contributing to market expansion.
The flameproof equipment market in India is projected to grow at a CAGR of 5.4% from 2025 to 2035. With significant growth in its industrial sectors, particularly in the energy, oil, and gas industries, India faces increasing demand for flameproof solutions. The government’s focus on improving safety standards and the implementation of stricter workplace regulations in hazardous environments is expected to drive market growth. India’s expanding infrastructure and industrial base, especially in manufacturing and heavy industries, further contribute to the rising need for flameproof equipment. The market is also benefiting from the country’s push for modernization, along with increased awareness about the safety of workers in dangerous working conditions.
The flameproof equipment market in Germany is expected to grow at a CAGR of 4.9% from 2025 to 2035. As a leader in industrial manufacturing, Germany requires reliable flameproof systems for its chemical, automotive, and energy sectors. With its strict regulatory framework, the country mandates the use of flameproof equipment in hazardous environments such as refineries and mining operations. Germany’s commitment to technological innovations in industrial safety is driving the adoption of advanced flameproof solutions. The market is also supported by Germany’s focus on environmental and worker safety, as well as its ongoing investments in energy-efficient solutions.
The flameproof equipment market in Brazil is forecasted to grow at a CAGR of 4.5% from 2025 to 2035. As Brazil continues to expand its oil, gas, and mining sectors, there is a growing demand for flameproof equipment to ensure workplace safety. The country’s stringent safety regulations, coupled with a strong focus on improving industrial safety, are expected to drive the market’s growth. Brazil’s infrastructure projects, including those in energy and manufacturing, contribute to the increasing need for explosion-proof and flameproof solutions. As awareness around worker protection rises, the demand for reliable flameproof equipment is set to increase.
The flameproof equipment market in the USA is expected to expand at a CAGR of 4.1% from 2025 to 2035. The demand for flameproof equipment in the USA is primarily driven by the need for safety in sectors such as chemicals, oil, gas, and manufacturing, where workers face hazardous working conditions. The USA has some of the strictest industrial safety regulations in the world, which mandates the use of flameproof equipment in critical environments. Technological advancements in industrial automation and the increasing focus on minimizing risks in high-risk industries contribute to market growth.
The flameproof equipment market in the UK is anticipated to expand at a CAGR of 3.7% from 2025 to 2035. The UK’s focus on industrial safety in sectors like oil, gas, and chemicals is a key factor driving the market. The country’s strict safety regulations and a heightened focus on preventing industrial accidents are encouraging businesses to adopt flameproof equipment. The increasing investment in infrastructure projects and the growing trend of automation in industries are expected to further propel market growth. As safety regulations become more stringent, the demand for reliable and compliant flameproof equipment will continue to rise.
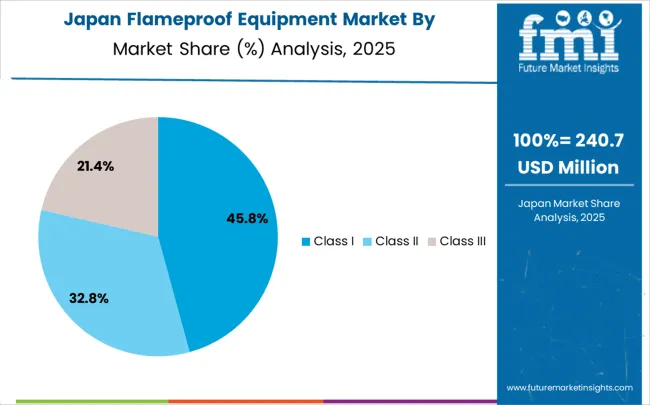
The flameproof equipment market in Japan is expected to grow at a CAGR of 3.2% from 2025 to 2035. Japan’s industrial sectors, including energy, manufacturing, and chemicals, are seeing steady growth, with an increasing focus on workplace safety and compliance with international safety standards. The country’s government regulations are pushing for the use of flameproof equipment in hazardous environments such as refineries and chemical plants. Japan’s adoption of advanced industrial technologies and automation in manufacturing and energy sectors is expected to further boost the demand for flameproof solutions.
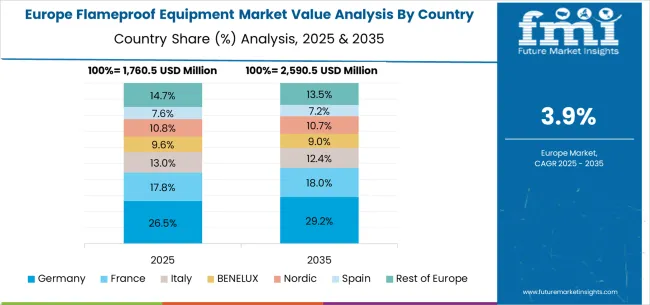
The flameproof equipment market in Europe is projected to grow from USD 1,760.5 million in 2025 to USD 2,590.5 million by 2035, registering a CAGR of 3.9%. Germany will maintain leadership with 26.5% in 2025, rising to 29.2% in 2035, driven by its advanced industrial sector, explosion protection infrastructure, and safety engineering standards. The United Kingdom follows with 22.0% in 2025, rising slightly to 21.8% by 2035, reflecting strong safety compliance and industrial protection frameworks. France contributes 18.0% in 2025, projected to reach 18.2% in 2035, supported by industrial infrastructure development and adoption of advanced safety technologies.
Italy holds 13.0% in 2025, increasing to 13.1% in 2035, while Spain declines from 8.5% in 2025 to 8.6% in 2035. BENELUX (Netherlands & neighbors) stands at 4.0% in 2025, increasing slightly to 4.1% in 2035, supported by industrial modernization and niche safety applications. The Rest of Europe (including Eastern European countries and Nordics) accounts for 7.6% in 2025, holding at 6.5% in 2035, reflecting more moderate adoption compared to Western Europe.
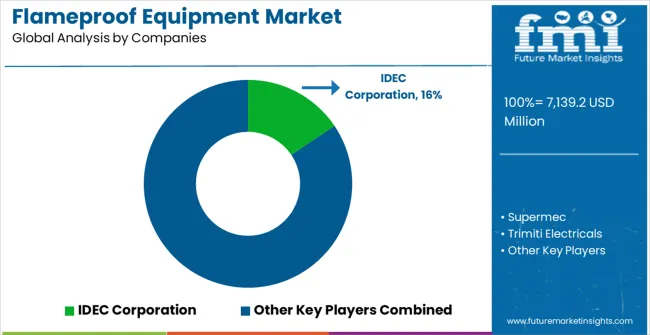
The flameproof equipment market is characterized by competition among established industrial safety companies, specialized explosion protection manufacturers, and integrated safety solution providers. Companies are investing in advanced safety technology research, certification compliance, engineering excellence, and comprehensive product portfolios to deliver reliable, certified, and effective flameproof equipment solutions. Innovation in smart safety systems, predictive monitoring technologies, and integrated protection platforms is central to strengthening market position and competitive advantage.
IDEC Corporation leads the market with comprehensive industrial safety solutions, offering advanced flameproof equipment with a focus on explosion protection and operational safety in hazardous environments. Supermec provides specialized explosion protection equipment with an focus on petrochemical and industrial applications. Trimiti Electricals delivers innovative safety solutions with a focus on electrical protection and hazardous area equipment. COELBO specializes in explosion protection technologies for industrial and marine applications. Activaa Techno Controls focuses on industrial automation and safety control systems. Eaton offers comprehensive electrical safety and protection solutions with focus on industrial and commercial applications.
| Items | Values |
|---|---|
| Quantitative Units (2025) | USD 7,139.2 million |
| Class | Class I, Class II, Class III, Others |
| Application | Petrochemical Industry, Mining Industry, Industrial, Others |
| Regions Covered | Asia Pacific, North America, Europe, Latin America, Middle East & Africa |
| Countries Covered | China, India, Germany, Brazil, the United States, the United Kingdom, Japan, and 40+ countries |
| Key Companies Profiled | IDEC Corporation, Supermec, Trimiti Electricals, COELBO, Activaa Techno Controls, and Eaton |
| Additional Attributes | Dollar sales by class and application category, regional demand trends, competitive landscape, technological advancements in explosion protection systems, smart safety development, predictive monitoring innovation, and industrial safety optimization |
The global flameproof equipment market is estimated to be valued at USD 7,139.2 million in 2025.
The market size for the flameproof equipment market is projected to reach USD 10,876.5 million by 2035.
The flameproof equipment market is expected to grow at a 4.3% CAGR between 2025 and 2035.
The key product types in flameproof equipment market are class i, class ii and class iii.
In terms of application, petrochemical industry segment to command 50.0% share in the flameproof equipment market in 2025.


Our Research Products

The "Full Research Suite" delivers actionable market intel, deep dives on markets or technologies, so clients act faster, cut risk, and unlock growth.

The Leaderboard benchmarks and ranks top vendors, classifying them as Established Leaders, Leading Challengers, or Disruptors & Challengers.

Locates where complements amplify value and substitutes erode it, forecasting net impact by horizon

We deliver granular, decision-grade intel: market sizing, 5-year forecasts, pricing, adoption, usage, revenue, and operational KPIs—plus competitor tracking, regulation, and value chains—across 60 countries broadly.

Spot the shifts before they hit your P&L. We track inflection points, adoption curves, pricing moves, and ecosystem plays to show where demand is heading, why it is changing, and what to do next across high-growth markets and disruptive tech

Real-time reads of user behavior. We track shifting priorities, perceptions of today’s and next-gen services, and provider experience, then pace how fast tech moves from trial to adoption, blending buyer, consumer, and channel inputs with social signals (#WhySwitch, #UX).

Partner with our analyst team to build a custom report designed around your business priorities. From analysing market trends to assessing competitors or crafting bespoke datasets, we tailor insights to your needs.
Supplier Intelligence
Discovery & Profiling
Capacity & Footprint
Performance & Risk
Compliance & Governance
Commercial Readiness
Who Supplies Whom
Scorecards & Shortlists
Playbooks & Docs
Category Intelligence
Definition & Scope
Demand & Use Cases
Cost Drivers
Market Structure
Supply Chain Map
Trade & Policy
Operating Norms
Deliverables
Buyer Intelligence
Account Basics
Spend & Scope
Procurement Model
Vendor Requirements
Terms & Policies
Entry Strategy
Pain Points & Triggers
Outputs
Pricing Analysis
Benchmarks
Trends
Should-Cost
Indexation
Landed Cost
Commercial Terms
Deliverables
Brand Analysis
Positioning & Value Prop
Share & Presence
Customer Evidence
Go-to-Market
Digital & Reputation
Compliance & Trust
KPIs & Gaps
Outputs
Full Research Suite comprises of:
Market outlook & trends analysis
Interviews & case studies
Strategic recommendations
Vendor profiles & capabilities analysis
5-year forecasts
8 regions and 60+ country-level data splits
Market segment data splits
12 months of continuous data updates
DELIVERED AS:
PDF EXCEL ONLINE
Equipment Management Software Market Size and Share Forecast Outlook 2025 to 2035
Equipment cases market Size and Share Forecast Outlook 2025 to 2035
Farm Equipment Market Forecast and Outlook 2025 to 2035
Golf Equipment Market Size and Share Forecast Outlook 2025 to 2035
Port Equipment Market Size and Share Forecast Outlook 2025 to 2035
Pouch Equipment Market Growth – Demand, Trends & Outlook 2025 to 2035
Garage Equipment Market Forecast and Outlook 2025 to 2035
Mining Equipment Industry Analysis in Latin America Size and Share Forecast Outlook 2025 to 2035
Subsea Equipment Market Size and Share Forecast Outlook 2025 to 2035
Pavers Equipment Market Size and Share Forecast Outlook 2025 to 2035
Tennis Equipment Market Analysis - Size, Share, and Forecast Outlook 2025 to 2035
Galley Equipment Market Analysis and Forecast by Fit, Application, and Region through 2035
Sorting Equipment Market Size and Share Forecast Outlook 2025 to 2035
General Equipment Rental Services Market Size and Share Forecast Outlook 2025 to 2035
Bagging Equipment Market Size and Share Forecast Outlook 2025 to 2035
RF Test Equipment Market Size and Share Forecast Outlook 2025 to 2035
Medical Equipment Covers Market Size and Share Forecast Outlook 2025 to 2035
Telecom Equipment Market Size and Share Forecast Outlook 2025 to 2035
Welding Equipment And Consumables Market Size and Share Forecast Outlook 2025 to 2035
Hunting Equipment and Accessory Market Analysis - Size, Share, and Forecast Outlook 2025 to 2035

Thank you!
You will receive an email from our Business Development Manager. Please be sure to check your SPAM/JUNK folder too.
Chat With
MaRIA