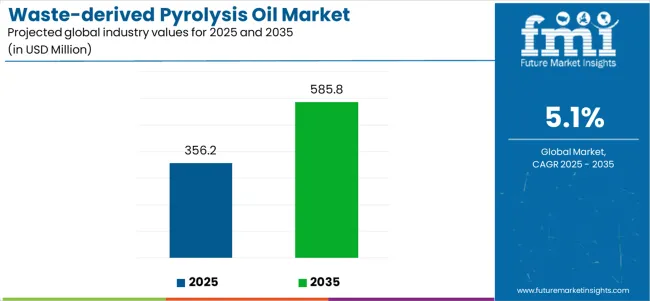
The global waste-derived pyrolysis oil market is anticipated to grow from USD 356.2 million in 2025 to USD 585.8 million by 2035, advancing at a CAGR of 5.1%. The industry stands at the threshold of a decade-long expansion trajectory that promises to reshape circular economy technology and waste-to-energy conversion solutions. The market's journey from USD 356.2 million in 2025 to USD 585.8 million by 2035 represents substantial growth, demonstrating the accelerating adoption of advanced pyrolysis technologies and thermal conversion systems across waste management, renewable energy, and chemical recycling sectors.
The first half of the decade (2025 to 2030) will witness the market climbing from USD 356.2 million to approximately USD 457.8 million, adding USD 92.6 million in value, which constitutes 40% of the total forecast growth period. This phase will be characterized by the steady adoption of fast pyrolysis systems, driven by increasing plastic waste volumes and the growing need for alternative fuel solutions worldwide. Advanced thermal conversion capabilities and modular pyrolysis units will become standard expectations rather than premium options.
The latter half (2030 to 2035) will witness accelerated growth from USD 457.8 million to USD 585.8 million, representing an addition of USD 140.5 million or 60% of the decade's expansion. This period will be defined by mass market penetration of chemical recycling integration, deployment across comprehensive refinery co-processing platforms, and seamless compatibility with existing energy infrastructure. The market trajectory signals fundamental shifts in how waste managers and energy producers approach plastic waste valorization and circular economy optimization, with participants positioned to benefit from steady demand across multiple source types and application segments.
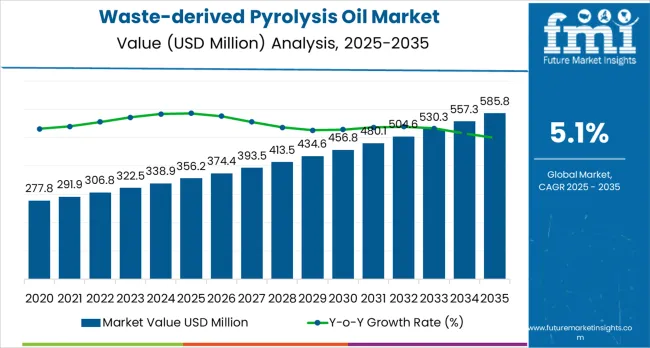
The market exhibits distinct growth phases characterized by varying market characteristics and competitive dynamics. Between 2025 and 2030, the market progresses through its technology deployment phase, growing from USD 356.2 million to USD 457.8 million with consistent annual increments averaging 5.1% growth. This period showcases the transition from pilot-scale pyrolysis units to commercial fast pyrolysis systems with enhanced oil yields and integrated feedstock preprocessing becoming mainstream features.
The 2025-2030 phase adds USD 92.6 million to market value, representing 40% of total decade expansion. Market maturation factors include the standardization of pyrolysis protocols, declining capital costs for modular systems, and increasing awareness of the waste management industry about the benefits of the circular economy, ultimately reaching optimal conversion efficiency in plastic-to-fuel applications. The competitive landscape during this period features established waste-to-energy companies, such as Fortum and Enerkem, expanding their pyrolysis portfolios, while specialty technology providers focus on advanced reactor development and enhanced oil quality capabilities.
From 2030 to 2035, market dynamics shift toward refinery integration and chemical recycling expansion, with accelerated growth continuing from USD 457.8 million to USD 585.8 million, representing an additional USD 128.0 million or 60% of the total expansion. This phase transition centers on commercial-scale chemical recycling systems, integration with petrochemical refinery networks, and deployment across diverse waste-to-energy scenarios, becoming standard rather than specialized applications. According to Future Market Insights, a leading provider of insights for Fortune 1000 firms globally, the competitive environment is maturing, with a focus shifting from basic pyrolysis capabilities to comprehensive circular economy optimization systems and integration with polymer production platforms.
At-a-Glance Metrics
| Metric | Value |
|---|---|
| Market Value (2025) | USD 356.2 million |
| Market Forecast (2035) | USD 585.8 million |
| Growth Rate | 5.1% CAGR |
| Leading Technology | Plastic Source Type |
| Primary Application | Heat &Power End Use Segment |
The market demonstrates strong fundamentals with plastic-derived pyrolysis oil systems capturing a dominant share through advanced thermal conversion and waste valorization capabilities. Heat and power applications drive primary demand, supported by increasing renewable energy requirements and alternative fuel technology adoption. Geographic expansion remains concentrated in developed markets with established waste management infrastructure, while emerging economies show accelerating adoption rates driven by circular economy policies and rising waste-to-energy standards.
Market expansion rests on three fundamental shifts driving adoption across the waste management and energy sectors. Plastic waste crisis creates compelling operational advantages through pyrolysis oil conversion that provides alternative fuel sources and circular economy solutions without landfill disposal, enabling waste managers to meet diversion targets while generating revenue and reducing environmental impact. Renewable energy transition accelerates as power generation facilities worldwide seek ecofriendly fuel systems that complement traditional energy sources, enabling carbon footprint reduction and regulatory compliance that align with climate goals and ecofriendly standards.
Chemical recycling advancement drives adoption from petrochemical refineries and polymer manufacturers requiring effective feedstock solutions that maximize plastic waste valorization while maintaining operational effectiveness during co-processing and polymer production operations. The growth faces headwinds from feedstock quality challenges that vary across waste collection systems regarding the contamination levels and plastic composition variability, which may limit adoption in quality-sensitive refinery applications. Technical limitations also persist regarding oil quality and upgrading requirements that may reduce economic viability in certain process configurations, which affect commercial scalability and market competitiveness.
The waste-derived pyrolysis oil market represents a transformative circular economy opportunity driven by expanding plastic waste volumes, renewable fuel mandates, and the need for ecofriendly waste management solutions. The market's growth trajectory from USD 356.2 million in 2025 to USD 585.8 million by 2035 at a 5.1% CAGR reflects fundamental shifts in waste valorization strategies and circular economy integration. Geographic expansion opportunities are particularly pronounced in Europe and Asia-Pacific markets, where the dominance of plastic feedstocks (44.0% market share) and heat and power applications (40.0% share) provides clear strategic focus areas.
Strengthening the dominant plastic source segment (44.0% market share) through enhanced feedstock preprocessing, superior plastic sorting technology, and seamless integration with waste collection infrastructure. This pathway focuses on optimizing LDPE (16.0%), HDPE (15.0%), polystyrene (9.0%), and mixed plastic (4.0%) processing streams, improving conversion efficiency, and developing specialized pyrolysis systems for diverse plastic waste types. Market leadership consolidation through advanced sorting technology and comprehensive feedstock quality management enables premium positioning while defending competitive advantages against alternative waste-to-energy technologies. Expected revenue pool: USD 25-40 million
Rapid circular economy policy adoption across India (6.2% CAGR), China (5.5% CAGR), and France (5.1% CAGR) creates substantial expansion opportunities through waste-to-energy infrastructure development and chemical recycling partnerships. Growing plastic waste volumes, landfill diversion mandates, and government circular economy initiatives drive steady demand for pyrolysis systems. Market localization strategies enable faster technology deployment and position companies advantageously for waste management procurement programs while accessing growing domestic alternative fuel markets. Expected revenue pool: USD 22-35 million
Expansion within the dominant heat and power segment (40.0% market share) through specialized pyrolysis oil formulations addressing boiler fuel standards (18.0%), gas turbine applications (12.0%), and diesel engine CHP systems (10.0%). This pathway encompasses automated fuel handling systems, quality control integration, and compatibility with diverse combustion technologies, supporting modern industrial energy operations while enabling integration with district heating networks and decentralized power generation platforms. Expected revenue pool: USD 20-32 million
Strategic focus on fast pyrolysis technology (62.0% market share) requires enhanced reactor design, superior heat transfer optimization, and specialized process control addressing high-throughput operational requirements. This pathway addresses flash pyrolysis applications (20.0%) and alternative thermal conversion methods (18.0%) with advanced engineering for demanding waste processing conditions while creating opportunities for technology licensing agreements and specialized engineering services. Expected revenue pool: USD 18-28 million
Development of petrochemical-grade pyrolysis oil for refinery co-processing and polymer production, addressing quality specifications, hydrotreatment requirements, and chemical industry feedstock demands. This pathway encompasses long-term offtake agreements with major petrochemical players, integration with existing refinery infrastructure, and comprehensive upgrading solutions. Premium positioning reflects superior oil quality and regulatory compliance while enabling access to high-value chemical recycling markets and comprehensive technical support programs. Expected revenue pool: USD 16-25 million
Expansion within the European market through RED III alignment, EPR scheme integration, and comprehensive regulatory compliance addressing renewable fuel mandates and circular economy targets. This pathway encompasses port-centric bio-refinery hubs in Netherlands and France, modular pyrolysis deployment with UK local authorities, and German refinery co-processing trials, creating opportunities for policy-supported project development and sustainability-driven partnerships across diverse waste management applications. Expected revenue pool: USD 14-22 million
Development of scalable modular pyrolysis units for decentralized waste processing, addressing municipal waste management needs, small-scale deployment requirements, and distributed energy generation. This pathway encompasses turnkey system provision, technology licensing, ongoing operational support, and comprehensive training programs. Technology differentiation through compact design and automated operation enables diversified revenue streams while reducing project development timelines and expanding addressable market opportunities in regions with limited waste infrastructure. Expected revenue pool: USD 12-20 million
Primary Classification: The market segments by source into Plastic, Biomass, Tires, and Others categories, representing the evolution from basic waste pyrolysis to specialized feedstock processing for comprehensive circular economy optimization.
Secondary Classification: End use segmentation divides the market into Heat &Power, Transportation Fuels, Chemical Feedstock, and Others sectors, reflecting distinct requirements for fuel quality, energy content, and processing standards.
Tertiary Classification: Pyrolysis process segmentation covers Fast Pyrolysis, Flash pyrolysis, Slow pyrolysis, and Others technologies, demonstrating varied adoption patterns across thermal conversion efficiency, capital requirements, and operational complexity considerations.
Regional Classification: Geographic distribution covers North America, Europe, Asia Pacific, Latin America, and the Middle East &Africa, with developed markets leading adoption while emerging economies show accelerating growth patterns driven by waste management modernization programs.
The segmentation structure reveals technology progression from conventional waste-to-energy toward specialized chemical recycling systems with enhanced conversion efficiency and product quality capabilities, while application diversity spans from industrial heating to petrochemical feedstock production requiring precise thermal processing solutions.
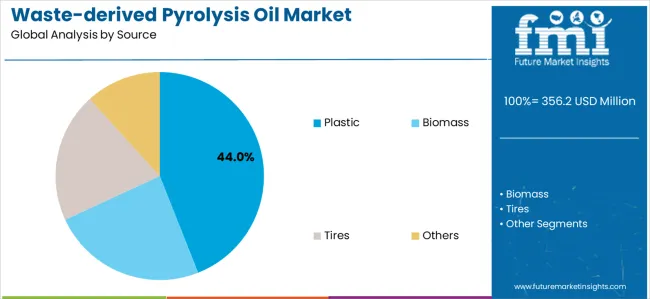
Market Position: Plastic-derived pyrolysis oil systems command the leading position in the market with approximately 44.0% market share through advanced thermal conversion properties, including superior oil yields, energy content capability, and product consistency that enable waste processors and energy producers to achieve optimal waste valorization across diverse municipal and industrial plastic waste streams.
Value Drivers: The segment benefits from waste management industry preference for proven conversion systems that provide reliable oil production, enhanced waste diversion rates, and circular economy optimization without requiring extensive feedstock modifications. Advanced processing features enable high conversion efficiency, quality oil output, and integration with existing waste management equipment, where feedstock availability and conversion economics represent critical operational requirements.
Competitive Advantages: Plastic pyrolysis systems differentiate through abundant feedstock availability, established collection networks, and compatibility with diverse thermal conversion technologies that enhance operational effectiveness while maintaining optimal oil quality suitable for various energy and chemical applications.
Key market characteristics:
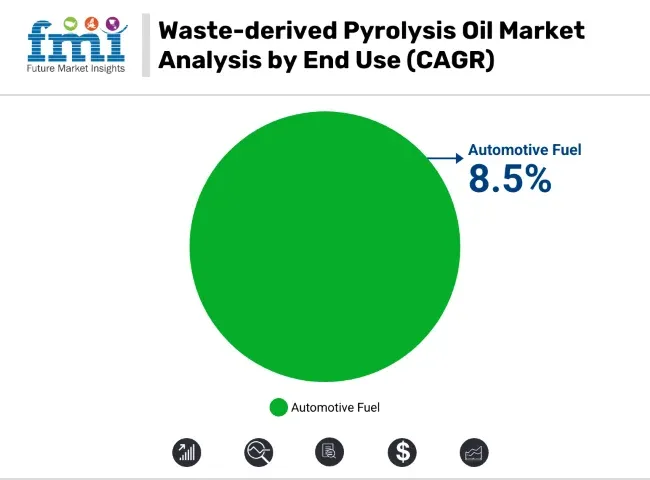
Market Context: Heat &Power applications dominate the market with approximately 40.0% market share due to widespread adoption in industrial energy systems and increasing focus on renewable fuel integration, carbon emission reduction, and alternative energy applications that support decarbonization goals while utilizing waste-derived resources.
Appeal Factors: Industrial energy operators prioritize fuel reliability, combustion performance, and integration with existing heating infrastructure that enables coordinated fuel management across multiple facilities. The segment benefits from substantial renewable energy investment and climate policy support that prioritize pyrolysis oil adoption for industrial heat and distributed power generation applications.
Growth Drivers: Industrial decarbonization programs incorporate pyrolysis oil as alternative fuel for energy production, while district heating expansion increases demand for renewable fuel solutions that comply with emission standards and ecofriendly requirements.
Application dynamics include:
Transportation fuels applications capture growing market share through blending with conventional fuels and advanced biofuel pathways. Chemical feedstock applications demonstrate emerging demand through refinery co-processing and polymer production integration serving petrochemical industry requirements.
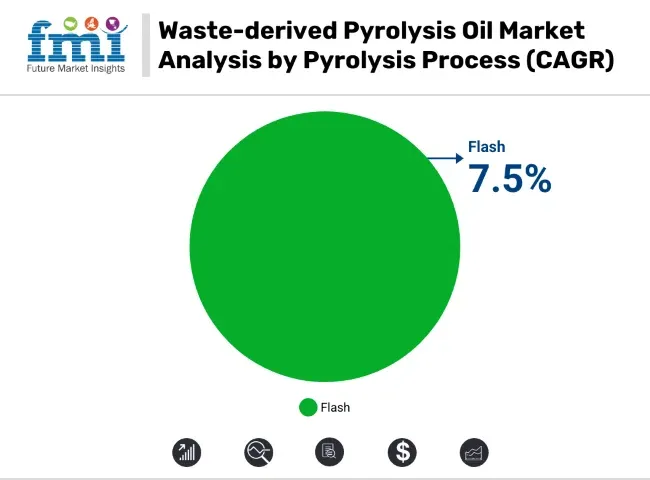
Market Context: Fast Pyrolysis technology dominates the market with approximately 62.0% market share due to superior conversion efficiency and proven commercial viability in waste-to-oil applications that enable high-throughput processing and optimal liquid product yields.
Appeal Factors: Technology developers and waste processors prioritize fast pyrolysis for rapid conversion kinetics, high oil yields, and proven commercial scalability that enable effective waste processing across multiple feedstock types. The segment benefits from substantial technology investment and demonstration projects that prioritize fast pyrolysis systems for commercial waste-to-energy facilities.
Growth Drivers: Commercial-scale deployment accelerates across waste management facilities implementing fast pyrolysis as primary conversion technology, while technology licensing programs expand access to proven reactor designs and process optimization capabilities.
Market Challenges: Varying feedstock quality and operational requirements may limit technology standardization across different waste streams or facility configurations.
Application dynamics include:
Growth Accelerators: Plastic waste crisis drives primary adoption as pyrolysis oil technology provides waste valorization and circular economy capabilities that enable waste managers to achieve landfill diversion targets without excessive disposal costs, supporting sustainability missions and environmental compliance requirements that demand effective plastic waste processing solutions. Renewable fuel mandates accelerate market expansion as energy facilities seek alternative fuel systems that reduce carbon footprint while maintaining operational effectiveness during industrial heating and power generation scenarios. Climate policy investment increases worldwide, creating constant demand for waste-to-energy technologies that complement traditional fuel systems and provide operational flexibility in complex energy transition environments.
Growth Inhibitors: Feedstock quality variability persists across waste collection systems regarding the contamination levels, plastic composition consistency, and sorting efficiency, which may limit operational reliability and market penetration in regions with inadequate waste infrastructure or quality-sensitive end-use applications. Economic viability challenges affect pyrolysis oil competitiveness compared to conventional fuels regarding the capital investment requirements, oil upgrading costs, and price volatility that may reduce adoption in cost-sensitive industrial applications. Market fragmentation across multiple technology configurations and quality specifications creates compatibility concerns between different pyrolysis systems and existing energy infrastructure.
Market Evolution Patterns: Adoption accelerates in waste management and energy sectors where ecofriendly requirements justify technology investment, with geographic concentration in policy-driven markets transitioning toward mainstream adoption in emerging economies driven by waste management modernization and circular economy development. Technology development focuses on enhanced reactor designs, improved oil quality, and integration with refinery co-processing systems that optimize conversion efficiency and product economics. The market could face disruption if mechanical recycling improvements or alternative waste-to-energy technologies significantly reduce reliance on pyrolysis conversion in mainstream plastic waste management applications. Policy integration enables renewable fuel incentive programs, extended producer responsibility schemes, and carbon pricing mechanisms that optimize project economics while supporting waste processors'transition toward circular economy business models and comprehensive sustainability platforms.
The market demonstrates varied regional dynamics with Growth Leaders including India (6.2% CAGR) driving expansion through waste-to-energy policy support and circular economy development. High-Growth Markets encompass China (5.5% CAGR), France (5.1% CAGR), and the United Kingdom (4.9% CAGR), benefiting from industrial co-processing adoption and chemical recycling integration. Steady Performers feature Germany (4.8% CAGR), the United States (4.7% CAGR), and the Netherlands (4.6% CAGR), where refinery trials and renewable fuel programs support consistent growth patterns.
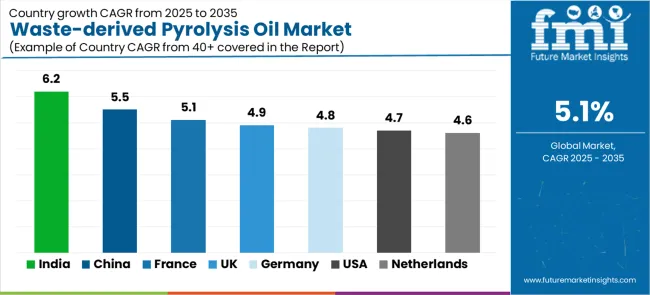
| Country | CAGR (2025-2035) |
|---|---|
| India | 6.2% |
| China | 5.5% |
| France | 5.1% |
| United Kingdom | 4.9% |
| Germany | 4.8% |
| United States | 4.7% |
| Netherlands | 4.6% |
Regional synthesis reveals Asia-Pacific markets leading adoption through waste management modernization and circular economy policy implementation, while European countries maintain robust growth supported by RED III compliance and chemical recycling integration requirements. North American markets show steady growth driven by renewable fuel standards and industrial decarbonization trends.
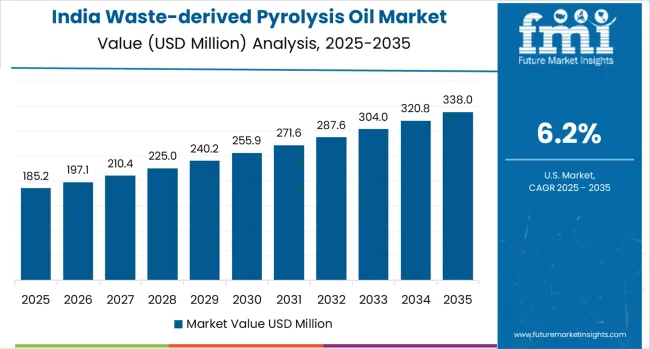
India establishes the highest growth trajectory through aggressive waste-to-energy policy initiatives and comprehensive plastic waste collection infrastructure development, integrating pyrolysis oil technology as critical solution in municipal waste management and alternative fuel installations. The country's 6.2% CAGR reflects government initiatives promoting waste valorization and import substitution for transport and heating fuels that mandate the adoption of circular economy systems in waste processing and energy production facilities. Growth concentrates in major industrial centers where waste-to-energy development showcases integrated pyrolysis technology that appeals to waste processors seeking revenue generation from plastic waste streams.
Indian technology developers are establishing local manufacturing capabilities that combine domestic market advantages with international technology partnerships, including modular pyrolysis units and feedstock preprocessing systems. Distribution channels through waste management operators and energy sector suppliers expand market access, while government support for circular economy development supports adoption across diverse municipal and industrial segments.
Strategic Market Indicators:
China's advanced waste management ecosystem demonstrates sophisticated pyrolysis oil deployment with documented operational effectiveness in refinery co-processing and municipal waste management through integration with industrial circular economy initiatives. The country leverages manufacturing scale and plastic waste volumes to maintain a 5.5% CAGR. Major industrial centers showcase pilot installations where pyrolysis systems integrate with comprehensive waste management platforms and petrochemical facilities to optimize resource recovery and environmental compliance.
Chinese waste processors prioritize commercial scalability and industrial integration in technology development, creating demand for proven conversion systems with reliable operational characteristics. The market benefits from established waste management infrastructure and substantial investment in circular economy technologies that provide long-term growth opportunities.
Market Intelligence Brief:
France's market expansion benefits from diverse regulatory drivers, including RED III renewable fuel mandates, chemical recycling integration with petrochemical clusters, and district heating programs that incorporate pyrolysis oil solutions for carbon reduction applications. The country maintains a 5.1% CAGR, driven by rising circular economy investment and increasing awareness of waste valorization benefits for energy transition and ecofriendly targets.
Market dynamics focus on high-quality pyrolysis oil production that balances technical performance with regulatory compliance important to French energy operators and petrochemical manufacturers. Growing chemical recycling infrastructure creates steady demand for pyrolysis technology in refinery co-processing projects.
Strategic Market Considerations:
The UK market demonstrates robust expansion through extended producer responsibility schemes, landfill tax pressure driving waste diversion, and modular pyrolysis unit deployment tied to local authority waste management programs that increasingly incorporate circular economy solutions for plastic waste processing applications. The country holds a 4.9% CAGR, supported by government waste management policy and chemical recycling development programs that promote pyrolysis technology for municipal and commercial waste streams. British waste operators are implementing modular pyrolysis systems that provide localized processing capabilities and technical flexibility, particularly appealing in urban areas where waste logistics and landfill costs represent critical operational challenges.
Market expansion benefits from established waste management infrastructure and regulatory frameworks that support pyrolysis adoption across the UK's circular economy and renewable energy sectors, where operational scalability and policy alignment represent critical requirements.
Market Intelligence Brief:
Germany's advanced industrial market demonstrates sophisticated pyrolysis oil deployment with documented co-processing trials in refineries, strong automotive OEM demand for low-carbon fuels, and advanced waste sorting infrastructure. The country leverages engineering expertise in chemical processing and waste management to maintain a 4.8% CAGR. Industrial centers showcase pilot installations where pyrolysis systems integrate with comprehensive refinery platforms to optimize feedstock quality and product specifications.
German technology providers prioritize quality standards and industrial integration in pyrolysis development, creating demand for premium conversion systems with proven refinery compatibility. The market benefits from established petrochemical infrastructure and willingness to invest in advanced circular economy technologies that provide long-term ecofriendly benefits.
Market Intelligence Brief:
The USA market prioritizes renewable fuel standard pathways and corporate ecofriendly programs through pyrolysis systems that manage industrial heat applications, RFS/RIN compliance mechanisms, and modular plant scaling aligned with waste management modernization. The country holds a 4.7% CAGR, driven by federal renewable fuel policies and state-level circular economy initiatives that support pyrolysis technology adoption. American waste processors prioritize operational flexibility with pyrolysis systems delivering reliable waste conversion through proven technology and commercial scalability.
Technology deployment channels include waste management contractors, industrial energy users, and renewable fuel developers that support professional applications for complex waste-to-energy and circular economy projects.
Performance Metrics:
The Netherlands demonstrates steady market development with a 4.6% CAGR, distinguished by port-centric bio-refinery hub development and established import/export infrastructure for pyrolysis feedstock and products. The market prioritizes integration with existing petrochemical logistics networks and comprehensive policy support for chemical recycling that reflects Dutch commitment to circular economy leadership and green materials management.

Europe, including the UK and Nordics, is estimated at USD 113.2 million in 2025, representing approximately 31% of the global market. Within Europe, Germany leads with USD 29.4 million (26% of European market), followed by France at USD 20.4 million (18%), and the United Kingdom at USD 19.2 million (17%). Italy accounts for USD 11.3 million (10%), while the Netherlands contributes USD 9.1 million (8%), and Spain represents USD 7.9 million (7%). The Nordic region holds USD 10.2 million (9%), with the Rest of Europe at USD 5.7 million (5%). Growth through 2035 is underpinned by RED III compliance requirements, EPR scheme roll-outs, and refinery co-processing trial programs. Port-adjacent hubs in the Netherlands and France support imports and exports of pyrolysis oil and feedstock materials, while Germany and the UK focus on integrating modular pyrolysis units with advanced sorting infrastructure and local district heating customers for comprehensive waste-to-energy optimization.
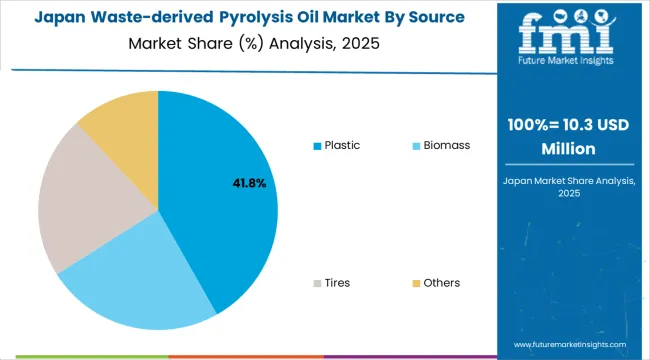
In Japan, the market prioritizes fast pyrolysis technology, which captures the dominant share of conversion installations due to advanced features, including rapid processing capability and proven commercial viability with existing waste management infrastructure. Japanese waste processors prioritize reliability, process efficiency, and long-term operational stability, creating demand for fast pyrolysis systems that provide consistent oil production and adaptive performance based on feedstock characteristics and processing requirements. Alternative pyrolysis methods including slow and flash technologies maintain secondary positions primarily in research applications and specialized waste processing scenarios where specific thermal properties meet operational requirements without compromising conversion efficiency.
Market Characteristics:
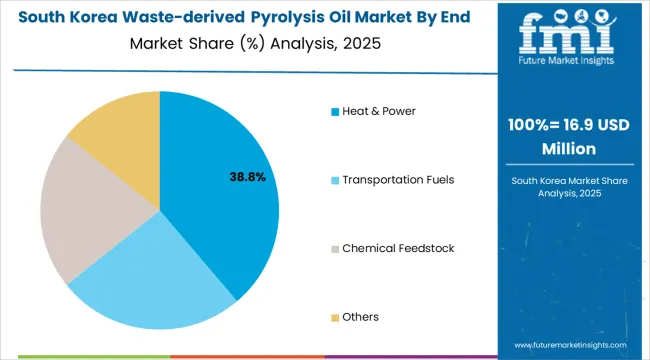
In South Korea, the market structure favors international technology companies and specialized pyrolysis developers, which maintain positions through comprehensive technology portfolios and established waste management networks supporting both municipal and industrial waste processing installations. These providers offer integrated solutions combining proven pyrolysis technology with technical support services and ongoing operational optimization that appeal to Korean waste managers seeking reliable conversion systems. Local engineering contractors capture market share by providing localized service capabilities and competitive pricing for modular system deployment, while domestic technology developers focus on specialized applications tailored to Korean waste management characteristics.
Channel Insights:

The market operates with moderate concentration, featuring approximately 15-20 meaningful participants, where leading companies control roughly 35-40% of the global market share through established waste management relationships and comprehensive technology portfolios. Fortum Oyj holds the leading position with approximately 9.5% market share through extensive waste-to-energy operations, Nordic district heating networks, and comprehensive pyrolysis technology capabilities. Competition prioritizes technology reliability, feedstock flexibility, and oil quality rather than price-based rivalry.
Market Leaders encompass Fortum, Enerkem, and Agilyx Corporation, which maintain competitive advantages through extensive waste processing experience, proven commercial installations, and comprehensive technical support capabilities that create customer relationships and support technology adoption. These companies leverage years of pyrolysis development and ongoing process innovations to deliver consistent conversion systems with reliable operational characteristics and quality features.
Technology Innovators include Ensyn Corporation, Twence, and Nexus Fuels, which compete through specialized reactor technology focus and innovative process development that appeal to waste managers seeking advanced conversion capabilities and operational flexibility. These companies differentiate through proprietary thermal conversion expertise and specialized waste-to-energy application focus.
Regional Specialists feature companies like Plastic Energy, Quantafuel, Green Fuel Nordic, and Freepoint Eco-Systems, which focus on specific geographic markets and specialized applications, including chemical recycling systems and modular deployment programs. Market dynamics favor participants that combine proven conversion technology with flexible feedstock handling, including quality management and technical support capabilities. Competitive pressure intensifies as established waste-to-energy companies expand into pyrolysis technology while specialized developers challenge incumbents through innovative reactor designs and cost-effective modular solutions targeting high-growth circular economy segments.
| Item | Value |
|---|---|
| Quantitative Units | USD 356.2 million |
| Source | Plastic, Biomass, Tires, Others |
| End Use | Heat &Power, Transportation Fuels, Chemical Feedstock, Others |
| Pyrolysis Process | Fast Pyrolysis, Flash pyrolysis, Slow pyrolysis, Others |
| Regions Covered | North America, Europe, Asia Pacific, Latin America, Middle East &Africa |
| Countries Covered | India, China, France, the UK, Germany, the USA, the Netherlands, and 25+ additional countries |
| Key Companies Profiled | Fortum Oyj, Enerkem, Agilyx Corporation, Ensyn Corporation, Twence, Nexus Fuels, Plastic Energy, Quantafuel |
| Additional Attributes | Dollar sales by source, end use, and pyrolysis process categories, regional adoption trends across North America, Europe, and Asia-Pacific, competitive landscape with technology providers and waste management operators, waste processor preferences for conversion efficiency and feedstock flexibility, integration with circular economy platforms and energy management systems, innovations in chemical recycling and refinery co-processing applications, and development of modular pyrolysis solutions with enhanced oil quality and operational optimization capabilities. |
The global waste-derived pyrolysis oil market is estimated to be valued at USD 356.2 million in 2025.
The market size for the waste-derived pyrolysis oil market is projected to reach USD 585.8 million by 2035.
The waste-derived pyrolysis oil market is expected to grow at a 5.1% CAGR between 2025 and 2035.
The key product types in waste-derived pyrolysis oil market are plastic, biomass, tires and others.
In terms of end use, heat & power segment to command 40.0% share in the waste-derived pyrolysis oil market in 2025.


Full Research Suite comprises of:
Market outlook & trends analysis
Interviews & case studies
Strategic recommendations
Vendor profiles & capabilities analysis
5-year forecasts
8 regions and 60+ country-level data splits
Market segment data splits
12 months of continuous data updates
DELIVERED AS:
PDF EXCEL ONLINE
Tire Pyrolysis Oil Market Size and Share Forecast Outlook 2025 to 2035
Pygas (Pyrolysis Gasoline) Market
Europe Rubber Derived Unrefined Pyrolysis Oil Market Size and Share Forecast Outlook 2025 to 2035
Oily Waste Can Market Size and Share Forecast Outlook 2025 to 2035
Oil and Gas Seal Market Size and Share Forecast Outlook 2025 to 2035
Oil Coalescing Filter Market Size and Share Forecast Outlook 2025 to 2035
Oil-immersed Iron Core Series Reactor Market Size and Share Forecast Outlook 2025 to 2035
Oil and Gas Sensor Market Forecast Outlook 2025 to 2035
Oil Packing Machine Market Forecast and Outlook 2025 to 2035
Oil and Gas Pipeline Coating Market Forecast and Outlook 2025 to 2035
Oilfield Scale Inhibitor Market Size and Share Forecast Outlook 2025 to 2035
Oil-in-Water Anionic Emulsifier Market Size and Share Forecast Outlook 2025 to 2035
Oil and Gas Field Services Market Size and Share Forecast Outlook 2025 to 2035
Oil Control Shampoo Market Size and Share Forecast Outlook 2025 to 2035
Oil Expellers Market Size and Share Forecast Outlook 2025 to 2035
Oilfield Stimulation Chemicals Market Size and Share Forecast Outlook 2025 to 2035
Oiler Kits Market Size and Share Forecast Outlook 2025 to 2035
Oil Pressure Sensor Market Size and Share Forecast Outlook 2025 to 2035
Oil Filled Power Transformer Market Size and Share Forecast Outlook 2025 to 2035
Oily Skin Control Products Market Analysis - Size and Share Forecast Outlook 2025 to 2035

Thank you!
You will receive an email from our Business Development Manager. Please be sure to check your SPAM/JUNK folder too.
Chat With
MaRIA