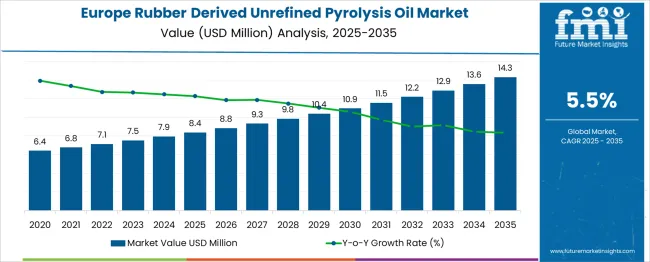
The Europe Rubber Derived Unrefined Pyrolysis Oil Market is estimated to be valued at USD 8.4 million in 2025 and is projected to reach USD 14.3 million by 2035, registering a compound annual growth rate (CAGR) of 5.5% over the forecast period.

| Metric | Value |
|---|---|
| Europe Rubber Derived Unrefined Pyrolysis Oil Market Estimated Value in (2025 E) | USD 8.4 million |
| Europe Rubber Derived Unrefined Pyrolysis Oil Market Forecast Value in (2035 F) | USD 14.3 million |
| Forecast CAGR (2025 to 2035) | 5.5% |
The Europe rubber derived unrefined pyrolysis oil market is growing steadily as industries seek sustainable alternatives to fossil fuels and ways to manage rubber waste effectively. Increasing environmental regulations and rising awareness of circular economy principles have encouraged the use of pyrolysis technology for recycling rubber materials. The fast pyrolysis process has gained popularity due to its efficiency in converting rubber waste into usable oil, which can be utilized as a renewable energy source.
Growth in industrial heat and power demand, especially from manufacturing and processing sectors, has supported the adoption of pyrolysis oil as an alternative fuel. Furthermore, initiatives to reduce carbon footprints and increase energy security have accelerated investments in pyrolysis production facilities.
The market outlook is positive with expanding end-use applications and technological advancements improving oil yield and quality. Segmental growth is expected to be driven by the fast pyrolysis production process and heat and power as the primary end-use sector.
The market is segmented by Production Process and End Use and region. By Production Process, the market is divided into Fast Pyrolysis, Slow Pyrolysis, and Flash Pyrolysis. In terms of End Use, the market is classified into Heat & Power and Automotive Fuels. Regionally, the market is classified into North America, Latin America, Western Europe, Eastern Europe, Balkan & Baltic Countries, Russia & Belarus, Central Asia, East Asia, South Asia & Pacific, and the Middle East & Africa.
The fast pyrolysis segment is projected to hold 51.3% of the market revenue in 2025, positioning it as the leading production process. Its growth has been driven by the rapid conversion rate of rubber waste into pyrolysis oil, making it an efficient method for large-scale operations. Fast pyrolysis produces higher yields of liquid oil compared to slower processes, which improves economic viability.
The technology’s ability to process various rubber feedstocks with consistent output quality has made it a preferred choice among producers. Increasing environmental mandates have also favored fast pyrolysis, as it contributes to waste reduction and renewable energy generation.
As demand for sustainable energy sources grows, fast pyrolysis is expected to continue leading the production methods for rubber derived pyrolysis oil.
The heat and power segment is projected to contribute 47.6% of the market revenue in 2025, making it the dominant end-use application. This segment has benefited from the increasing industrial need for cost-effective and environmentally friendly fuel alternatives.
Pyrolysis oil is used extensively in boilers and power generation units due to its high calorific value and ability to reduce dependence on conventional fossil fuels. Rising energy prices and stricter emissions regulations have encouraged industries to adopt pyrolysis oil for heat and power generation.
Furthermore, its role in decarbonization strategies has positioned it as a critical energy source in manufacturing and processing sectors. The heat and power segment is expected to maintain strong growth driven by ongoing industrial modernization and environmental sustainability efforts.
According to Future Market Insights (FMI), the global demand for rubber derived unrefined pyrolysis oil has witnessed year-over-year growth of 1.9% between 2020 to 2024. Growth in the market is projected to surge owing to rising demand for fuel for several industrial processing.
Besides this, rising application of rubber derived unrefined pyrolysis oil in power supply to gas turbines for electricity generation and industrial boilers will propel the growth. Technological advancements for the conversion of waste products into energies are anticipated to boost the pyrolysis production processing.
Backed by these aforementioned factors, the market of unrefined pyrolysis oil derived from tires is projected to grow at a CAGR of 5.5% during the foirecast period.
Waste management is one of the rising concern across the globe and requires attention or else it can affect the future immensely. According to the study, between 1 billion and 1.8 billion used tyres are discarded every year worldwide.
This accounts for about 2% to 3% of all waste materials collected in Europe. Key application of rubber derived unrefined pyrolysis oil is in vehicle tyres; more than 70% of all rubber in the world ends wrapped it around the wheels of cars, bicycles, and lorries.
Moreover, tires composed of around 80% rubber compound, steel, and textiles are built to last, making them a difficult product to recycle. Further, waste-derived pyrolysis oil production process contributes effectively toward waste management.
Through such processes, global waste production concerns can be reduced and generate desired petroleum outputs. Pyrolysis oil is expected to be used to generate electricity and energy to cater to the growing demand for diesel and gasoline.
Increasing raw materials prices (EOL tires, tubes, etc.) within the industry and re-emergence of alternate users like tire pyrolysis might limit the sales in the market. Although the availability of raw materials is high; however, most waste management is highly regulated by government organizations.
The rubber-derived unrefined pyrolysis oil market is difficult to scale up owing to the requirements of a constant source of raw material and a constant customer base. Producing pyrolysis oil at a larger scale can only be effective when the manufacturers could turn other by-products into final profit, generating 45-52% revenue from fuel oil and other 48-55% from by-products.


Adoption of Rubber Derived Unrefined Pyrolysis Oil to Surge Amid Growing Need to Reduce Carbon Footprint
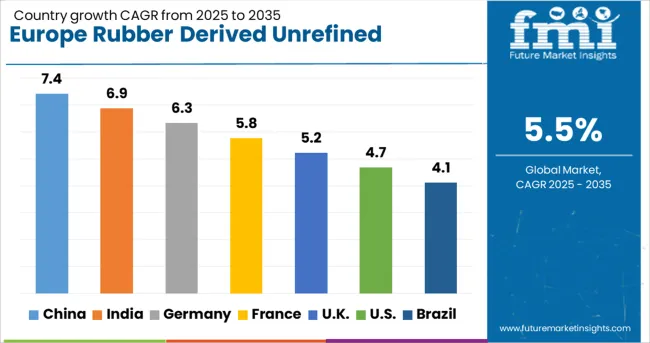
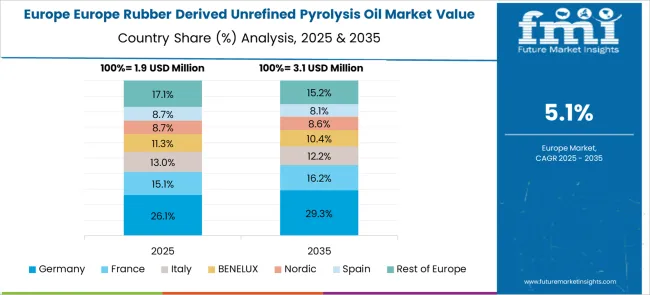
The unrefined pyrolysis oil derived from was rubber sales is antiicpated to create about incremental dollar opportunity of USD 8.4 Mn in 2025. Advent of advanced technology in Germany is expected to boslter the production processes for conversion of waste materials into energy.
Owing to the reduction prospects for carbon emission along with top chemical companies for the waste conversion will remain key growth drivers for the market. Further, preference to utilize the oil associated with less carbon footprint will also augment the growth in the market.
The UK Rubber Derived Unrefined Pyrolysis Oil Market to Gain from Expansion of Industrial Sector
With expansion of industrial sector coupled with rising investment in product will influence the growth in rubber derived unrefined pyrolysis oil market. Growing demand for oil for automotive fuel, demand from industrial boilers, gas turbine and diesel powered engines in the U.K. are propelling the demand.
Government initiatives for decreasing carbon emissions and key players target for achieving net zero emissions are anticipated to drive the demand for pyrolysis oil in the country.
Manufacturers to Choose Fast Pyrolysis Process for Rubber Derived Unrefined Pyrolysis Oil
Production of rubber derived unrefined pyrolysis oil includes slow, fast and flash technology, depending on the temperature and residence time, yield of the final product achieved. Demand for the pyrolysis oil with higher yield and low residence time is expected to boost the fast production process segment in the coming decade.
This production process is expected to ctrae an incremental $ opportunity of USD 2,846.1 Th during the forecast period.
Heat and power segment is expected to account for about 84% of the overall consumption of rubber derived unrefined pyrolysis oil in the Europe market. High demand for the oil is owing to enormous volume consumption of fuel for the processing of the industrial machineries. For instance industrial boliers, diesel engines and power generators like gas turbines requires higher amount of fuel for their processing.
Top players in the market of rubber derived unrefined pyrolysis oil are focusing on increasing their production capacities by collaborating with the local players to enhance their market dominancy. Key market participants are also investing a significant amount in technological development to enhance the capacity to industrial level. Further, top players are entering into the business to increase the dominancy through horizontal integration.
For instance:
| Attributes | Details |
|---|---|
| Estimated Market Value (2025E) | USD 8.4 million |
| Market Projections (2035F) | USD 14.3 million |
| Value CAGR (2025 to 2035) | 5.5% |
| Forecast Period | 2025 to 2035 |
| Historical Data Available for | 2020 to 2024 |
| Market Analysis | USD Thousands for Value and Tons for Volume |
| Key Countries Covered | Germany, Italy, France, the UK, and the Rest of Europe |
| Key Segments Covered | The production process, End-Use, and Country |
| Key Companies Profiled |
SABIC; Fortum Oyj; Twence B.V.; Green Fuel Nordic Corporation; Quantafuel AS; Kartepe Endüstriyel Geri Dönüsüm SAN. ve TIC. A.$.; Pyrum Innovations AG; Tasnee; Others |
| Report Coverage | Market Forecast, Company Share Analysis, Competition Intelligence, DROT Analysis, Market Dynamics and Challenges, and Strategic Growth Initiatives |
The global europe rubber derived unrefined pyrolysis oil market is estimated to be valued at USD 8.4 million in 2025.
The market size for the europe rubber derived unrefined pyrolysis oil market is projected to reach USD 14.3 million by 2035.
The europe rubber derived unrefined pyrolysis oil market is expected to grow at a 5.5% CAGR between 2025 and 2035.
The key product types in europe rubber derived unrefined pyrolysis oil market are fast pyrolysis, slow pyrolysis and flash pyrolysis.
In terms of end use, heat & power segment to command 47.6% share in the europe rubber derived unrefined pyrolysis oil market in 2025.


Our Research Products

The "Full Research Suite" delivers actionable market intel, deep dives on markets or technologies, so clients act faster, cut risk, and unlock growth.

The Leaderboard benchmarks and ranks top vendors, classifying them as Established Leaders, Leading Challengers, or Disruptors & Challengers.

Locates where complements amplify value and substitutes erode it, forecasting net impact by horizon

We deliver granular, decision-grade intel: market sizing, 5-year forecasts, pricing, adoption, usage, revenue, and operational KPIs—plus competitor tracking, regulation, and value chains—across 60 countries broadly.

Spot the shifts before they hit your P&L. We track inflection points, adoption curves, pricing moves, and ecosystem plays to show where demand is heading, why it is changing, and what to do next across high-growth markets and disruptive tech

Real-time reads of user behavior. We track shifting priorities, perceptions of today’s and next-gen services, and provider experience, then pace how fast tech moves from trial to adoption, blending buyer, consumer, and channel inputs with social signals (#WhySwitch, #UX).

Partner with our analyst team to build a custom report designed around your business priorities. From analysing market trends to assessing competitors or crafting bespoke datasets, we tailor insights to your needs.
Supplier Intelligence
Discovery & Profiling
Capacity & Footprint
Performance & Risk
Compliance & Governance
Commercial Readiness
Who Supplies Whom
Scorecards & Shortlists
Playbooks & Docs
Category Intelligence
Definition & Scope
Demand & Use Cases
Cost Drivers
Market Structure
Supply Chain Map
Trade & Policy
Operating Norms
Deliverables
Buyer Intelligence
Account Basics
Spend & Scope
Procurement Model
Vendor Requirements
Terms & Policies
Entry Strategy
Pain Points & Triggers
Outputs
Pricing Analysis
Benchmarks
Trends
Should-Cost
Indexation
Landed Cost
Commercial Terms
Deliverables
Brand Analysis
Positioning & Value Prop
Share & Presence
Customer Evidence
Go-to-Market
Digital & Reputation
Compliance & Trust
KPIs & Gaps
Outputs
Full Research Suite comprises of:
Market outlook & trends analysis
Interviews & case studies
Strategic recommendations
Vendor profiles & capabilities analysis
5-year forecasts
8 regions and 60+ country-level data splits
Market segment data splits
12 months of continuous data updates
DELIVERED AS:
PDF EXCEL ONLINE
Europe Radiotherapy Patient Positioning Market Size and Share Forecast Outlook 2025 to 2035
Europe Polyvinyl Alcohol Industry Analysis Size and Share Forecast Outlook 2025 to 2035
Europe Cruise Market Forecast and Outlook 2025 to 2035
Europe Massage Therapy Service Market Size and Share Forecast Outlook 2025 to 2035
Europe Cement Market Analysis Size and Share Forecast Outlook 2025 to 2035
European Union Tourism Industry Size and Share Forecast Outlook 2025 to 2035
Europe Injection Molding Machines Market Size and Share Forecast Outlook 2025 to 2035
Europe Injection Moulders Market Size and Share Forecast Outlook 2025 to 2035
Europe and MENA Generic Oncology Drug Market Size and Share Forecast Outlook 2025 to 2035
Europe Masking Tapes Market Size and Share Forecast Outlook 2025 to 2035
Europe Liners Market Size and Share Forecast Outlook 2025 to 2035
Europe Dermal Fillers Market Size and Share Forecast Outlook 2025 to 2035
Europe Trolley Bus Market Size and Share Forecast Outlook 2025 to 2035
Europe Protease Market Size and Share Forecast Outlook 2025 to 2035
Europe Luxury Packaging Market Size and Share Forecast Outlook 2025 to 2035
Europe & USA Consumer Electronics Packaging Market Size and Share Forecast Outlook 2025 to 2035
Europe Plant-Based Meal Kit Market Size and Share Forecast Outlook 2025 to 2035
Europe Temperature Controlled Packaging Solutions Market Size and Share Forecast Outlook 2025 to 2035
Europe Pet Food Market Analysis by Nature, Product Type, Source, Pet Type, Packaging, Distribution Channel, and Country - Growth, Trends, and Forecast through 2025 to 2035
Europe's Golden Generation Travel Market Size and Share Forecast Outlook 2025 to 2035

Thank you!
You will receive an email from our Business Development Manager. Please be sure to check your SPAM/JUNK folder too.
Chat With
MaRIA