Reports

- Global Locations -

Headquarters

Future Market Insights, Inc.

Christiana Corporate, 200
Continental Drive, Suite 401,
Newark, Delaware - 19713,
United States

T: +1-845-579-5705

Americas

Future Market Insights, Inc.

616 Corporate Way, Suite 2-9018,
Valley Cottage, NY 10989, United States

T: +1-347-918-3531

MEA

Future Market Insights

1602-6 Jumeirah Bay X2 Tower, Plot No: JLT-PH2-X2A,
Jumeirah Lakes Towers, Dubai,
United Arab Emirates

Europe

Future Market Insights

3rd Floor, 207 Regent Street,
W1B 3HH London
United Kingdom

T: + 44 (0) 20 8123 9659
D: +44 (0) 20 3287 4268

Asia Pacific

Future Market Insights

IndiaLand Global Tech Park, Unit UG-1, Behind Grand HighStreet, Phase 1, Hinjawadi, MH, Pune – 411057, India

Europe Cement Industry Outlook from 2023 to 2033

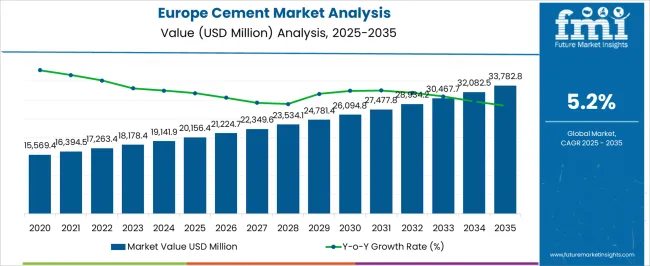
The cement industry size in Europe reached US$ 18,178.4 million in 2022. Over the forecast period, cement demand in Europe is anticipated to rise at 5.3% CAGR. The industry is predicted to increase from US$ 19,026.5 million in 2023 to US$ 31,742.5 million in 2033.

Attributes Key Insights
Base Value (2022) US$ 18,178.4 million
Estimated Europe Cement Industry Size (2023) US$ 19,026.5 million
Projected Europe Cement Revenue (2033) US$ 31,742.5 million
Value-based CAGR (2023 to 2033) 5.3%
Collective Value Share: Top 5 Countries (2023E) 64.2%

The integration of cutting-edge technology in cement manufacturing is bolstering the industry’s expansion. A favorable industry outlook is also being produced by the growing use of green cement in constructing sustainable and eco-friendly structures that lower harmful emissions and promote environmental health.

The cement industry in Europe is largely concentrated, with several medium- and small-sized key firms coexisting alongside leading players who control a sizable share. Key manufacturers in the cement industry are committed to securing a substantial portion of the industry and avoiding several obstacles.

Cement producers in Europe also enter contracts and agreements with other leading industries to secure long-term material supply and increase profits. Leading manufacturers are conducting research & development to innovate and produce new products to meet the rising demand.

Don't pay for what you don't need

Customize your report by selecting specific countries or regions and save 30%!

Key Europe Cement Industry Highlights

  • Industry to Expand Over 1.7X through 2033

Europe’s cement industry is predicted to expand over 1.7X through 2033, amid a 3.2% increase in expected CAGR compared to the historical one. This is due to the rising demand for public infrastructure and non-residential buildings, such as hospitals and healthcare facilities.

The cement industry in Europe is projected to rise due to rapid population growth and increasing government initiatives for infrastructure development. By 2033, the industry is set to reach US$ 31,742.5 million.

The United Kingdom is the Leading Cement Manufacturer

The United Kingdom is expected to retain its dominance in Europe’s cement industry during the forecast period. This is attributed to the following factors:

  • Growth of End-use Industries: The demand for residential buildings has increased as the population is growing. This has surged the demand for cement across Europe. The rising demand for public infrastructure and non-residential buildings, such as hospitals and healthcare facilities, has created a product-consumption industry. As a result, the current trend is rising demand from the expanding construction sector.
  • Growing Government Investment: As the population of the United Kingdom grows, the government is taking several initiatives to develop the country's infrastructure and expanding its budget to improve connectivity and enhance logistics. This is expected to uplift cement demand in Europe through 2033.

Historical Europe Cement Industry Outlook Vs. 2023 to 2033 Forecast

Europe cement industry grew at a CAGR of 2.1% between 2018 and 2022. The industry reached US$ 18,178.4 million in 2022. In the forecast period, the cement industry in Europe is set to thrive at a CAGR of 5.3%.

Historical CAGR (2018 to 2022) 2.1%
Forecast CAGR (2023 to 2033) 5.3%

Europe’s cement industry witnessed moderate growth between 2018 and 2022. This was due to a rising awareness of environment-friendly infrastructure.

The acceleration of industrialization and urbanization was a result of the globalization movement and the expansion of developing economies. Consequently, this increased the need for cement as a basic building ingredient in Europe.

The general quality and safety of cement products were enhanced by the creation and implementation of quality standards & regulatory procedures. Growing consumer awareness of environmental issues has prompted the cement industry to prioritize sustainable methods.

It, in turn, has led to an emphasis on cement's dependability in building. The industry's growth trajectory has been determined by initiatives to lower carbon emissions, adopt energy-efficient technology, and investigate alternative raw materials.

Europe’s cement industry has seen a noticeable change toward more environmentally friendly methods in recent years. This involves utilizing more energy-efficient processes, switching to alternative fuels, and developing low & carbon-neutral cement to lessen carbon emissions.

Nikhil Kaitwade
Nikhil Kaitwade

Principal Consultant

Talk to Analyst

Find your sweet spots for generating winning opportunities in this market.

Future Scope of the Cement Industry

Over the forecast period, the cement industry in Europe is poised to exhibit healthy growth, totaling a valuation of US$ 31,742.5 million in 2033. This is due to a combination of several factors, including the rising use of cement in road construction, civil engineering, and others.

High demand for residential and commercial buildings due to population growth is expected to propel the growth of the cement industry in Europe. Investment in research and development is another crucial factor for the growth of the regional cement industry.

Key participants are investing in research & development to develop advanced and innovative products for sustainable development. They aim to develop advanced technologies to cater to the growing demand from end-use sectors.

Investments in research & development also benefits waste and hazardous waste management, which will help with sustainable development. The above factors, coupled with the increasing people's purchasing power, have led to the growing sales of cement for several applications in Europe.

Europe Cement Industry Trends

  • In Europe’s cement sector, sustainability is becoming very important. Low-carbon and carbon-neutral cement are being developed as a result of increasing efforts to lower carbon emissions.
  • To lessen their reliance on non-renewable resources and improve sustainability, cement producers are progressively utilizing alternative fuels and raw materials, such as waste-derived fuels and industrial by-products.
  • The cement industry in Europe is progressively adopting digital technologies, such as automation, artificial intelligence, and the internet of things. Digital solutions are set to be used to increase operational performance, streamline industrial processes, and boost energy efficiency.
  • By recycling and repurposing leftover concrete, cement manufacturers are looking for methods to support the circular economy. Using recovered aggregates and adopting technology to repurpose concrete leftover from demolished buildings are two examples of this.
  • Concrete with improved strength, durability, and other specific qualities is in high demand. High-rise structures and infrastructure projects are mainly affected by this tendency.

Get the data you need at a Fraction of the cost

Personalize your report by choosing insights you need
and save 40%!

Key Factors Restraining Europe’s Cement Industry Growth

  • Robust environmental laws about the carbon footprint of cement manufacturers are set to prevent the cement industry in Europe from growing. There is constant pressure on the sector to cut emissions and implement more environmentally friendly procedures.
  • The formation of clinker requires high temperatures, which makes cement making an energy-intensive operation. Rising energy prices and the effects of energy usage on the environment are set to constrain cement manufacturers.
  • The price and accessibility of raw materials, such as gypsum, clay, and limestone, is projected to affect the cost of cement production. Changes in the price or scarcity of raw materials are expected to impact the profitability of cement manufacturing.

Comparative View of Adjacent Europe Cement Industries

The following section provides key attributes of the industries related to Europe's cement. These include the fiber cement and construction aggregate industries.

Drivers and trends are thoroughly analyzed to find business opportunities in all these industries. This can provide deeper insights that help develop unique differentiating strategies to pursue growth and opportunity in Europe’s cement industry.

Growth of these mentioned industries is closely tied to industries like building and construction, mining, and agriculture. Hence, the growth or collapse of these industries will ultimately impact sales of cement, fiber cement, and construction aggregate.

Among the mentioned industries, the Europe cement industry is set to expand more than the other two. Demand for cement in Europe is projected to expand at a 5.3% CAGR during the forecast period. This is attributable to the increasing efforts of manufacturers to reduce their carbon footprint.

The fiber cement industry is anticipated to gain traction from increasing infrastructure development projects. The industry is poised to thrive at a 4.7% CAGR through 2033.

Similarly, the construction aggregate industry is projected to expand at a CAGR of 4.86% from 2023 to 2033. The construction aggregate sector is expected to rise due to growing smart city initiatives and increased building activity.

Europe Cement Industry Analysis:

Attributes Industry Analysis of Cement in Europe
CAGR (2023 to 2033) 5.3%
Growth Factor Growing manufacturing industries and rising investment in infrastructure sector is expected to provide impetus for the cement industry growth.
Trends in the Europe Cement Industry Key players are focusing on increasing energy efficiency, switching to lower-carbon fuels, and promoting material efficiency to reduce carbon emissions in cement production.

Fiber Cement Industry Outlook:

Attributes Fiber Cement Demand Outlook
CAGR (2023 to 2033) 4.7%
Growth Factor The evolution of manufacturing technology through continuous research and development has resulted in improved fiber cement products.
Key Trend The need for ecologically friendly building materials has increased as a result of growing awareness of and emphasis on sustainable building practices. Due to its sustainability and durability, fiber cement has become popular in green buildings.

Construction Aggregate Sales Forecast:

Attributes Construction Aggregate Sales Forecast
CAGR (2023 to 2033) 4.86%
Growth Factor The demand for construction aggregates is closely linked to both urbanization and infrastructure development. The need for construction aggregates rises as investments in the construction of roads, bridges, and buildings escalate.
Key Trend The rising popularity of recycled construction aggregates is anticipated to fuel the industry’s expansion.

Country-wise Insights

The table below highlights key countries’ cement industry revenues in 2033. The United Kingdom, Germany, and France are expected to remain the top three consumers of cement in Europe, with expected valuations of US$ 5,795.4 million, US$ 5,177.3 million, and US$ 4,481.8 million, respectively, in 2033.

Countries Cement Revenue (2033)
United Kingdom US$ 5,795.4 million
Germany US$ 5,177.3 million
France US$ 4,481.8 million
Italy US$ 2,811.5 million
Russia US$ 2,186.3 million

The table below shows the estimated growth rates of the top five countries. France, the United Kingdom, and Germany are set to record high CAGRs of 6.2%, 5.8%, and 5.0% respectively, through 2033.

Countries Projected Value-CAGR (2023 to 2033)
France 6.2%
United Kingdom 5.8%
Italy 4.3%
Germany 5.0%
Russia 4.4%

The United Kingdom to Remain at the Epicentre of Cement Manufacturing

The United Kingdom’s cement industry size is projected to reach US$ 5,795.4 million in 2033. Over the assessment period, demand for cement in the United Kingdom is set to rise at a 5.8% CAGR.

The United Kingdom has exhibited an increasing understanding of the environmental impact of cement manufacturing in recent years. The country has been researching sustainable techniques and alternative materials to reduce carbon emissions related to cement making. Blended cement and other eco-friendly options are essential in pursuing more ecologically conscious construction methods.

Key enterprises substantially contribute to meeting the cement needs of the United Kingdom’s construction industry. The performance of the construction sector, driven by factors such as rising housing demand, infrastructure investments, and commercial projects, is influencing cement consumption in the United Kingdom.

Booming Construction Sector to Boost Sales of Cement in Germany

The cement industry in Germany is an important part of the country's building industry. In Germany, cement consumption is tightly linked to economic conditions, infrastructure initiatives, and environmental concerns.

Germany is well-known for its modern construction sector and commitment to environmentally friendly building standards. The country has been at the forefront of implementing environmentally friendly technologies in construction, and this trend is continuing in the cement industry. Cement manufacturers in Germany are actively researching & implementing strategies to reduce carbon emissions and improve sustainability.

Heidelberg Cement, Dyckerhoff AG, and Schwenk are the key competitors in Germany’s cement industry. These firms make substantial contributions to meeting the cement demand in Germany. Cement sales in the country are projected to soar at a CAGR of 5.0% during the assessment period.

Increasing Sustainable Construction Techniques Spurring Growth in France

France has been emphasizing environmentally friendly policies and sustainable practices in the construction sector. Regulations aiming at lowering carbon emissions, encouraging the use of alternative fuels, and implementing more sustainable manufacturing techniques are expected to drive the country’s cement industry.

The degree of urbanization and continuing infrastructure-building initiatives are also the key drivers of cement consumption in France. The country’s government is investing in energy, transportation, and other infrastructure projects, which is driving the cement industry's expansion.

The competitiveness of cement producers in France is influenced by technological advancements in cement manufacturing. This includes the creation of more energy-efficient and environmentally efficient processes. The state of the residential housing sector has a direct impact on cement consumption in France.

Building and remodeling operations in the residential sector are further influenced by variables such as borrowing rates, housing affordability, and demographic shifts in France. Over the forecast period, cement demand in the country is set to increase at a robust CAGR of 6.2%.

Category-wise Insights

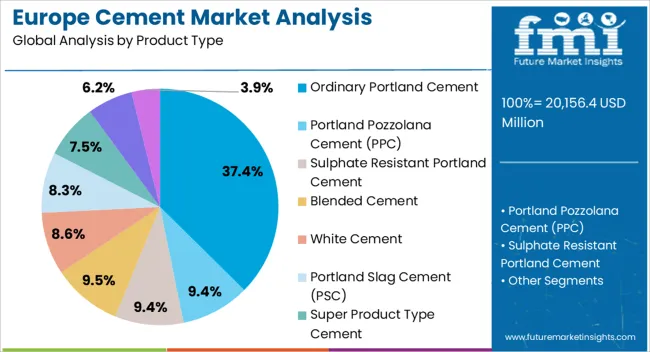
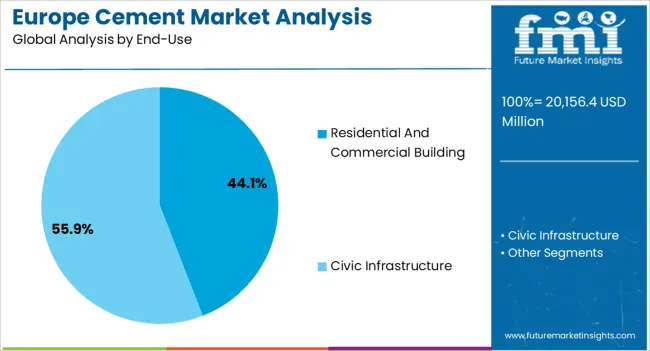
The below section shows the ordinary Portland cement segment-leading in terms of product type. It is estimated to thrive at a 5.2% CAGR between 2023 and 2033. Based on end-use, the residential and commercial building segment is anticipated to hold a dominant share through 2033. It is set to exhibit a CAGR of 5.1% during the forecast period.

Ordinary Portland Cement to Exhibit Exponential Demand in Europe

Top Segment (Product Type) Ordinary Portland Cement
Predicted CAGR (2023 to 2033) 5.2%

Ordinary Portland cement, also known as OPC, is the leading and dominating product type, followed by Portland pozzolana cement (PPC). OPC is the widely consumed cement in several end-use industries in Europe, such as marine and civic infrastructure.

It is also a widely manufactured cement, and because of its high compressive strength, this product is in high demand. Growing end-use industries are favoring OPC as it is suitable for common construction applications. As a result, these factors are likely to boost OPC demand throughout the forecast period.

Demand for Residential and Commercial Buildings to Remain High

Top Segment (End-use) Residential and Commercial Building
Projected CAGR (2023 to 2033) 5.1%

Based on the end-use, the residential and commercial buildings segment is expected to lead, followed by civic infrastructure. Growing demand for residential and commercial buildings due to the rapid population growth is expected to propel Europe’s cement industry.

Cement consumption in this end-user segment is high owing to the increasing urbanization and growing population, which necessitates accommodation. Drainage systems, stairs, roofs & walls, foundations, and others are all considered under this segment. As a result, this segment is expected to surge at a CAGR of 5.1% throughout the forecast period.
Competitive Landscape

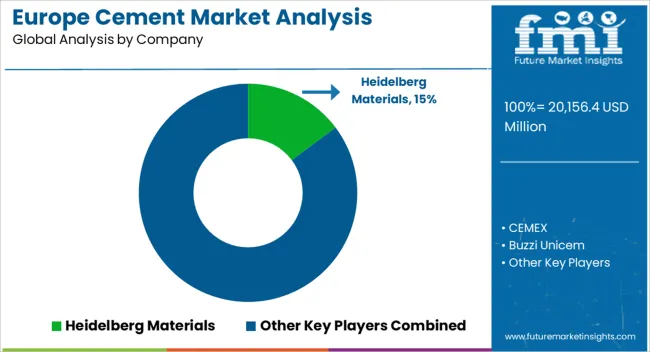
Europe’s cement industry is consolidated, with leading players accounting for 64.2% share. CEMEX, Buzzi Unicem, CRH PLC, Anhui Conch Cement Co. Ltd., Heidelberg Materials, Duna-Drava Cement, Holcim Ltd., Titan Cement Group, and Vicat Group are the leading manufacturers and suppliers of cement listed in the report.

In order to fulfill end-user demand, key cement firms in Europe are investing in research & development to produce new products and increase their manufacturing capacity. To expand their presence, leading players are directed toward implementing growth strategies such as collaborations, acquisitions, mergers, and facility expansions.

Recent Developments

  • In 2022, CRH acquired Barrette Outdoor Living (Barrette), a leading provider of fencing and railing systems for the outdoor living space.
  • In May 2023, The Nevyansk Cement Plant invested in equipment modernization to double the plant's capacity.
  • In 2023, Cemex acquired a factory close to Madrid, with the intention of better meeting the demands of customers.

Scope of the Report

Attribute Details
Estimated Value (2023) US$ 19,026.5 million
Projected Value (2033) US$ 31,742.5 million
Anticipated Growth Rate (2023 to 2033) 5.3%
Historical Data 2018 to 2022
Forecast Period 2023 to 2033
Quantitative Units Value (US$ million) and Volume (metric tons)
Report Coverage Revenue Forecast, Volume Forecast, Company Ranking, Competitive Landscape, Growth Factors, Trends, and Pricing Analysis
Segments Covered
  • Product Type
  • End-use
  • Region
Key Countries Covered
  • Germany
  • Italy
  • France
  • United Kingdom
  • Spain
  • BENELUX
  • Russia
  • Rest of Europe
Key Companies Profiled
  • CEMEX
  • Buzzi Unicem
  • CRH PLC
  • Anhui Conch Cement Co. Ltd.
  • Heidelberg Materials
  • Duna-Drava Cement, Holcim Ltd.
  • Titan Cement Group, Vicat Group
  • UltraTech Cement Ltd.
  • Arabian Cement Company
  • EURO CEMENT, SECIL
  • OYAK Cement

Europe Cement Industry Segmentation by Category

By Product Type:

  • Ordinary Portland Cement
    • OPC 33
    • OPC 43
    • OPC 53
  • Portland Pozzolana Cement (PPC)
  • Sulphate Resistant Portland Cement
  • Blended Cement
  • White Cement
  • Portland Slag Cement (PSC)
  • Super Product Type Cement
  • Hydrophobic Portland Cement
  • De-carbonated Cement

By End-use:

  • Residential and Commercial Building
    • Drainage System
    • Beams and Pillars
    • Stairs
    • Roofs and Walls
    • Foundations
    • Others
  • Civic Infrastructure
    • Dams and Ports
    • Roads
    • Bridges
    • Tunnels
    • Culverts and Sewers
    • Power Plants
  • Industrial and Marine Construction

By Region:

  • Germany
  • Italy
  • France
  • United Kingdom
  • Spain
  • BENELUX
  • Russia
  • Rest of Europe

Frequently Asked Questions

How big is the cement industry in Europe?

Europe's industry is set to reach US$ 19,026.5 million in 2023.

What is the forecast for the cement industry?

Demand in Europe is slated to expand at a 5.3% CAGR through 2033.

What is the outlook for the cement industry in Europe?

The target industry is set to reach US$ 31,742.5 million in 2033.

Which end-use will garner significant value share by 2023?

The residential and commercial building is expected to garner a significant value share by 2023.

What was the value of the cement industry in 2022?

Europe’s cement industry was valued at US$ 18,178.4 million in 2022.

Table of Content

1. Executive Summary

    1.1. Industry Outlook

    1.2. Demand Side Trends

    1.3. Supply Side Trends

    1.4. Technology Roadmap

    1.5. Analysis and Recommendations

2. Industry Overview

    2.1. Industry Coverage / Taxonomy

    2.2. Industry Definition / Scope / Limitations

3. Key Trends

    3.1. Key Trends Impacting the Industry

    3.2. Product Innovation / Development Trends

4. Key Success Factors

    4.1. Product Adoption / Usage Analysis

    4.2. Product USPs / Features

    4.3. Strategic Promotional Strategies

5. Industry Demand Analysis 2018 to 2022 and Forecast, 2023 to 2033

    5.1. Historical Industry Volume (Tons) Analysis, 2018 to 2022

    5.2. Current and Future Industry Volume (Tons) Projections, 2023 to 2033

    5.3. Y-o-Y Growth Trend Analysis

6. Industry - Pricing Analysis

    6.1. Regional Pricing Analysis

    6.2. Average Pricing Analysis Benchmark

    6.3. Factors Impacting Pricing

7. Industry Demand (in Value or Size in US$ million) Analysis 2018 to 2022 and Forecast, 2023 to 2033

    7.1. Historical Industry Value (US$ million) Analysis, 2018 to 2022

    7.2. Current and Future Industry Value (US$ million) Projections, 2023 to 2033

        7.2.1. Y-o-Y Growth Trend Analysis

        7.2.2. Absolute $ Opportunity Analysis

8. Industry Background

    8.1. Macro-Economic Factors

        8.1.1. GDP Growth Outlook

        8.1.2. Macro-Economic Factors: Impact of Economic Slowdown

        8.1.3. Macro-Economic Factors: Real GDP Growth

        8.1.4. Macro-Economic Factors: Region Wise GDP

        8.1.5. Macro-economic Factors: Urbanization Growth

        8.1.6. Growing Urbanization: Urban Population as a Percentage Of Total Population 1990 to 2050

        8.1.7. Macro-Economic Factors: Manufacturing Value Added by Key Countries

        8.1.8. Macro-Economic Factors: Industry Value Added By Key Countries

    8.2. Forecast Factors - Relevance and Impact

        8.2.1. Historical Growth Rate of Companies

        8.2.2. GDP Growth Outlook

        8.2.3. Research and Technology Developments

        8.2.4. Construction Industry Growth Scenario

        8.2.5. New Infrastructure Projects

        8.2.6. Business Climate

        8.2.7. Infrastructure Development

        8.2.8. Construction Industry Growth

        8.2.9. Government Investments

        8.2.10. Sustainable Construction Practices

        8.2.11. Population Growth and Urbanization

        8.2.12. Road Maintenance and Repairs

        8.2.13. Industrial Applications

        8.2.14. Growth in Population

        8.2.15. Collaboration Activities

    8.3. Value Chain

        8.3.1. Avg. Profitability Margins

        8.3.2. Raw Material Suppliers

        8.3.3. Product Manufacturers (Global)

        8.3.4. Product Manufacturers (Europe)

        8.3.5. Product Distributors

        8.3.6. Probable End Users

    8.4. COVID-19 Crisis – Impact Assessment

        8.4.1. Current Statistics

        8.4.2. Short-Mid-Long Term Outlook

        8.4.3. Likely Rebound

    8.5. Industry Dynamics

        8.5.1. Drivers

        8.5.2. Restraints

        8.5.3. Opportunity Analysis

    8.6. Supply Demand Analysis

    8.7. Construction and Infrastructure Projects

    8.8. PEST Analysis

    8.9. Porter’s Five Forces Analysis

    8.10. Industry : Key Developments

9. Industry Analysis 2018 to 2022 and Forecast 2023 to 2033, By Product Type

    9.1. Introduction / Key Findings

    9.2. Historical Size (US$ million) and Volume Analysis By Product Type, 2018 to 2022

    9.3. Current and Future Size (US$ million) and Volume Analysis and Forecast By Product Type, 2023 to 2033

        9.3.1. Ordinary Portland Cement

            9.3.1.1. OPC 33

            9.3.1.2. OPC 43

            9.3.1.3. OPC 53

        9.3.2. Portland Pozzolana (PPC)

        9.3.3. Sulphate Resistant Portland Cement

        9.3.4. Blended Cement

        9.3.5. White Cement

        9.3.6. Portland Slag (PSC

        9.3.7. Super Product Type Cement

        9.3.8. Hydrophobic Portland Cement

        9.3.9. De-carbonated Cement

    9.4. Industry Attractiveness Analysis By Product Type

10. Industry Analysis 2018 to 2022 and Forecast 2023 to 2033, By End Use

    10.1. Introduction / Key Findings

    10.2. Historical Size (US$ million) and Volume Analysis By End Use, 2018 to 2022

    10.3. Current and Future Size (US$ million) and Volume Analysis and Forecast By End Use, 2023 to 2033

        10.3.1. Residential and Commercial Building

            10.3.1.1. Drainage System

            10.3.1.2. Beams and Pillars

            10.3.1.3. Stairs

            10.3.1.4. Roofs and Walls

            10.3.1.5. Foundations

            10.3.1.6. Others

        10.3.2. Civic Infrastructure

            10.3.2.1. Dams and Ports

            10.3.2.2. Roads

            10.3.2.3. Bridges

            10.3.2.4. Tunnels

            10.3.2.5. Culverts and Sewers

            10.3.2.6. Power Plants

        10.3.3. Industrial and Marine Construction

    10.4. Industry Attractiveness Analysis By End Use

11. Industry Analysis 2018 to 2022 and Forecast 2023 to 2033, by Country

    11.1. Introduction

    11.2. Historical Size (US$ million) and Volume Analysis By Country, 2018 to 2022

    11.3. Current and Future Size (US$ million) and Volume Analysis and Forecast By Country, 2023 to 2033

        11.3.1. Germany

        11.3.2. Italy

        11.3.3. France

        11.3.4. United Kingdom

        11.3.5. Spain

        11.3.6. Russia

        11.3.7. BENELUX

        11.3.8. Rest of Europe

    11.4. Industry Attractiveness Analysis By Country

12. Germany Industry Analysis 2018 to 2022 and Forecast 2023 to 2033

    12.1. Introduction

    12.2. Pricing Analysis

    12.3. Historical Size (US$ million) and Volume Trend Analysis By Taxonomy, 2018 to 2022

    12.4. Current and Future Size (US$ million) and Volume Forecast By Taxonomy, 2023 to 2033

        12.4.1. By Product Type

        12.4.2. By End Use

    12.5. Industry Attractiveness Analysis

        12.5.1. By Country

        12.5.2. By Product Type

        12.5.3. By End Use

    12.6. Key Trends

    12.7. Key Participants - Intensity Mapping

    12.8. Drivers and Restraints - Impact Analysis

13. Italy Industry Analysis 2018 to 2022 and Forecast 2023 to 2033

    13.1. Introduction

    13.2. Pricing Analysis

    13.3. Historical Size (US$ million) and Volume Trend Analysis By Taxonomy, 2018 to 2022

    13.4. Current and Future Size (US$ million) and Volume Forecast By Taxonomy, 2023 to 2033

        13.4.1. By Product Type

        13.4.2. By End Use

    13.5. Industry Attractiveness Analysis

        13.5.1. By Product Type

        13.5.2. By End Use

    13.6. Key Trends

    13.7. Key Participants - Intensity Mapping

    13.8. Drivers and Restraints - Impact Analysis

14. France Industry Analysis 2018 to 2022 and Forecast 2023 to 2033

    14.1. Introduction

    14.2. Pricing Analysis

    14.3. Historical Size (US$ million) and Volume Trend Analysis By Taxonomy, 2018 to 2022

    14.4. Current and Future Size (US$ million) and Volume Forecast By Taxonomy, 2023 to 2033

        14.4.1. By Product Type

        14.4.2. By End Use

    14.5. Industry Attractiveness Analysis

        14.5.1. By Product Type

        14.5.2. By End Use

    14.6. Key Trends

    14.7. Key Participants - Intensity Mapping

    14.8. Drivers and Restraints - Impact Analysis

15. United Kingdom Industry Analysis 2018 to 2022 and Forecast 2023 to 2033

    15.1. Introduction

    15.2. Pricing Analysis

    15.3. Historical Size (US$ million) and Volume Trend Analysis By Taxonomy, 2018 to 2022

    15.4. Current and Future Size (US$ million) and Volume Forecast By Taxonomy, 2023 to 2033

        15.4.1. By Product Type

        15.4.2. By End Use

    15.5. Industry Attractiveness Analysis

        15.5.1. By Product Type

        15.5.2. By End Use

    15.6. Key Trends

    15.7. Key Participants - Intensity Mapping

    15.8. Drivers and Restraints - Impact Analysis

16. Spain Industry Analysis 2018 to 2022 and Forecast 2023 to 2033

    16.1. Introduction

    16.2. Pricing Analysis

    16.3. Historical Size (US$ million) and Volume Trend Analysis By Taxonomy, 2018 to 2022

    16.4. Current and Future Size (US$ million) and Volume Forecast By Taxonomy, 2023 to 2033

        16.4.1. By Product Type

        16.4.2. By End Use

    16.5. Industry Attractiveness Analysis

        16.5.1. By Product Type

        16.5.2. By End Use

    16.6. Key Trends

    16.7. Key Participants - Intensity Mapping

    16.8. Drivers and Restraints - Impact Analysis

17. BENELUX Industry Analysis 2018 to 2022 and Forecast 2023 to 2033

    17.1. Introduction

    17.2. Pricing Analysis

    17.3. Historical Size (US$ million) and Volume Trend Analysis By Taxonomy, 2018 to 2022

    17.4. Current and Future Size (US$ million) and Volume Forecast By Taxonomy, 2023 to 2033

        17.4.1. By Product Type

        17.4.2. By End Use

    17.5. Industry Attractiveness Analysis

        17.5.1. By Product Type

        17.5.2. By End Use

    17.6. Key Trends

    17.7. Key Participants - Intensity Mapping

    17.8. Drivers and Restraints - Impact Analysis

18. Russia Industry Analysis 2018 to 2022 and Forecast 2023 to 2033

    18.1. Introduction

    18.2. Pricing Analysis

    18.3. Historical Size (US$ million) and Volume Trend Analysis By Taxonomy, 2018 to 2022

    18.4. Current and Future Size (US$ million) and Volume Forecast By Taxonomy, 2023 to 2033

        18.4.1. By Product Type

        18.4.2. By End Use

    18.5. Industry Attractiveness Analysis

        18.5.1. By Product Type

        18.5.2. By End Use

    18.6. Key Trends

    18.7. Key Participants - Intensity Mapping

    18.8. Drivers and Restraints - Impact Analysis

19. Rest of Industry Analysis 2018 to 2022 and Forecast 2023 to 2033

    19.1. Introduction

    19.2. Pricing Analysis

    19.3. Historical Size (US$ million) and Volume Trend Analysis By Taxonomy, 2018 to 2022

    19.4. Current and Future Size (US$ million) and Volume Forecast By Taxonomy, 2023 to 2033

        19.4.1. By Product Type

        19.4.2. By End Use

    19.5. Industry Attractiveness Analysis

        19.5.1. By Product Type

        19.5.2. By End Use

    19.6. Key Trends

    19.7. Key Participants - Intensity Mapping Drivers and Restraints - Impact Analysis

20. Industry Structure Analysis

    20.1. Industry Analysis by Tier of Companies

    20.2. Industry Concentration

    20.3. Industry Share Analysis of Top Players

    20.4. Production Capacity Analysis

    20.5. Industry Presence Analysis

        20.5.1. By End Use Footprint of Players

        20.5.2. By Regional Footprint of Players

21. Competition Analysis

    21.1. Competition Dashboard

    21.2. Competition Benchmarking

    21.3. Competition Deep Dive

        21.3.1. CEMEX

            21.3.1.1. Overview

            21.3.1.2. Product Portfolio

            21.3.1.3. Profitability by Segments (Product/Channel/Region)

            21.3.1.4. Sales Footprint

            21.3.1.5. Strategy Overview

        21.3.2. Buzzi Unicem

        21.3.3. CRH PLC

        21.3.4. Anhui Conch Co. Ltd.

        21.3.5. Heidelberg Materials

        21.3.6. Duna-Drava Cement

        21.3.7. Holcim Ltd.

        21.3.8. Titan Group

        21.3.9. Vicat Group

        21.3.10. UltraTech Ltd.

        21.3.11. Arabian Company

        21.3.12. EUROCEMENT

        21.3.13. SECIL

        21.3.14. OYAK Cement

22. Primary Insights

23. Assumptions and Acronyms Used

24. Research Methodology

List of Tables

Table 01: Industry Size Volume (KT) Estimated By Product Type, 2018 to 2022

Table 02: Industry Size Volume (KT) Forecast By Product Type, 2023 to 2033

Table 03: Industry Size Value (US$ million) Estimated By Product Type, 2018 to 2022

Table 04: Industry Size Value (US$ million) Forecast By Product Type, 2023 to 2033

Table 05: Industry Size Volume (KT) Estimated By End Use, 2018 to 2022

Table 06: Industry Size Volume (KT) Forecast By End Use, 2023 to 2033

Table 07: Industry Size Value (US$ million) Estimated By End Use, 2018 to 2022

Table 08: Industry Size Value (US$ million) Forecast By End Use, 2023 to 2033

Table 09: Industry Size Volume (KT) & Value (US$ million) Estimated By Country, 2018 to 2022

Table 10: Industry Size Volume (KT) & Value (US$ million) Forecast By Country, 2023 to 2033

Table 11: Germany Industry Size Volume (KT) Estimated By Product Type, 2018 to 2022

Table 12: Germany Industry Size Volume (KT) Forecast By Product Type, 2023 to 2033

Table 13: Germany Industry Size Value (US$ million) Estimated By Product Type, 2018 to 2022

Table 14: Germany Industry Size Value (US$ million) Forecast By Product Type, 2023 to 2033

Table 15: Germany Industry Size Volume (KT) Estimated By End Use, 2018 to 2022

Table 16: Germany Industry Size Volume (KT) Forecast By End Use, 2023 to 2033

Table 17: Germany Industry Size Value (US$ million) Estimated By End Use, 2018 to 2022

Table 18: Germany Industry Size Value (US$ million) Forecast By End Use, 2023 to 2033

Table 19: Italy Industry Size Volume (KT) Estimated By Product Type, 2018 to 2022

Table 20: Italy Industry Size Volume (KT) Forecast By Product Type, 2023 to 2033

Table 21: Italy Industry Size Value (US$ million) Estimated By Product Type, 2018 to 2022

Table 22: Italy Industry Size Value (US$ million) Forecast By Product Type, 2023 to 2033

Table 23: Italy Industry Size Volume (KT) Estimated By End Use, 2018 to 2022

Table 24: Italy Industry Size Volume (KT) Forecast By End Use, 2023 to 2033

Table 25: Italy Industry Size Value (US$ million) Estimated By End Use, 2018 to 2022

Table 26: Italy Industry Size Value (US$ million) Forecast By End Use, 2023 to 2033

Table 27: France Industry Size Volume (KT) Estimated By Product Type, 2018 to 2022

Table 28: France Industry Size Volume (KT) Forecast By Product Type, 2023 to 2033

Table 29: France Industry Size Value (US$ million) Estimated By Product Type, 2018 to 2022

Table 30: France Industry Size Value (US$ million) Forecast By Product Type, 2023 to 2033

Table 31: France Industry Size Volume (KT) Estimated By End Use, 2018 to 2022

Table 32: France Industry Size Volume (KT) Forecast By End Use, 2023 to 2033

Table 33: France Industry Size Value (US$ million) Estimated By End Use, 2018 to 2022

Table 34: France Industry Size Value (US$ million) Forecast By End Use, 2023 to 2033

Table 35: United Kingdom Industry Size Volume (KT) Estimated By Product Type, 2018 to 2022

Table 36: United Kingdom Industry Size Volume (KT) Forecast By Product Type, 2023 to 2033

Table 37: United Kingdom Industry Size Value (US$ million) Estimated By Product Type, 2018 to 2022

Table 38: United Kingdom Industry Size Value (US$ million) Forecast By Product Type, 2023 to 2033

Table 39: United Kingdom Industry Size Volume (KT) Estimated By End Use, 2018 to 2022

Table 40: United Kingdom Industry Size Volume (KT) Forecast By End Use, 2023 to 2033

Table 41: United Kingdom Industry Size Value (US$ million) Estimated By End Use, 2018 to 2022

Table 42: United Kingdom Industry Size Value (US$ million) Forecast By End Use, 2023 to 2033

Table 43: Spain Industry Size Volume (KT) Estimated By Product Type, 2018 to 2022

Table 44: Spain Industry Size Volume (KT) Forecast By Product Type, 2023 to 2033

Table 45: Spain Industry Size Value (US$ million) Estimated By Product Type, 2018 to 2022

Table 46: Spain Industry Size Value (US$ million) Forecast By Product Type, 2023 to 2033

Table 47: Spain Industry Size Volume (KT) Estimated By End Use, 2018 to 2022

Table 48: Spain Industry Size Volume (KT) Forecast By End Use, 2023 to 2033

Table 49: Spain Industry Size Value (US$ million) Estimated By End Use, 2018 to 2022

Table 50: Spain Industry Size Value (US$ million) Forecast By End Use, 2023 to 2033

Table 51: BENELUX Industry Size Volume (KT) Estimated By Product Type, 2018 to 2022

Table 52: BENELUX Industry Size Volume (KT) Forecast By Product Type, 2023 to 2033

Table 53: BENELUX Industry Size Value (US$ million) Estimated By Product Type, 2018 to 2022

Table 54: BENELUX Industry Size Value (US$ million) Forecast By Product Type, 2023 to 2033

Table 55: BENELUX Industry Size Volume (KT) Estimated By End Use, 2018 to 2022

Table 56: BENELUX Industry Size Volume (KT) Forecast By End Use, 2023 to 2033

Table 57: BENELUX Industry Size Value (US$ million) Estimated By End Use, 2018 to 2022

Table 58: BENELUX Industry Size Value (US$ million) Forecast By End Use, 2023 to 2033

Table 59: Russia Industry Size Volume (KT) Estimated By Product Type, 2018 to 2022

Table 60: Russia Industry Size Volume (KT) Forecast By Product Type, 2023 to 2033

Table 61: Russia Industry Size Value (US$ million) Estimated By Product Type, 2018 to 2022

Table 62: Russia Industry Size Value (US$ million) Forecast By Product Type, 2023 to 2033

Table 63: Russia Industry Size Volume (KT) Estimated By End Use, 2018 to 2022

Table 64: Russia Industry Size Volume (KT) Forecast By End Use, 2023 to 2033

Table 65: Russia Industry Size Value (US$ million) Estimated By End Use, 2018 to 2022

Table 66: Russia Industry Size Value (US$ million) Forecast By End Use, 2023 to 2033

Table 67: Rest of Industry Size Volume (KT) Estimated By Product Type, 2018 to 2022

Table 68: Rest of Industry Size Volume (KT) Forecast By Product Type, 2023 to 2033

Table 69: Rest of Industry Size Value (US$ million) Estimated By Product Type, 2018 to 2022

Table 70: Rest of Industry Size Value (US$ million) Forecast By Product Type, 2023 to 2033

Table 71: Rest of Industry Size Volume (KT) Estimated By End Use, 2018 to 2022

Table 72: Rest of Industry Size Volume (KT) Forecast By End Use, 2023 to 2033

Table 73: Rest of Industry Size Value (US$ million) Estimated By End Use, 2018 to 2022

Table 74: Rest of Industry Size Value (US$ million) Forecast By End Use, 2023 to 2033

List of Charts

Figure 01: Industry Historical Volume (KT), 2018 to 2022

Figure 02: Industry Current and Forecast Volume (KT), 2023 to 2033

Figure 03: Industry Historical Value (US$ million), 2018 to 2022

Figure 04: Industry Current and Forecast Value (US$ million), 2023 to 2033

Figure 05: Industry Incremental $ Opportunity (US$ million), 2023 to 2033

Figure 06: Industry Share and BPS Analysis By Product Type– 2023 to 2033

Figure 07: Industry Y-o-Y Growth Projections By Product Type, 2023 to 2033

Figure 08: Industry Attractiveness Analysis By Product Type, 2023 to 2033

Figure 09: Industry Absolute $ Opportunity by Ordinary Portland Segment, 2018 to 2033

Figure 10: Industry Absolute $ Opportunity by Portland Pozzolana (PPC) Segment, 2018 to 2033

Figure 11: Industry Absolute $ Opportunity by Sulphate Resistant Portland Segment, 2018 to 2033

Figure 12: Industry Absolute $ Opportunity by Blended Segment, 2018 to 2033

Figure 13: Industry Absolute $ Opportunity by White Segment, 2018 to 2033

Figure 14: Industry Absolute $ Opportunity by Portland Slag (PSC) Segment, 2018 to 2033

Figure 15: Industry Absolute $ Opportunity by Super Product Type Segment, 2018 to 2033

Figure 16: Industry Absolute $ Opportunity by Hydrophobic Portland Segment, 2018 to 2033

Figure 17: Industry Absolute $ Opportunity by De-carbonated Segment, 2018 to 2033

Figure 18: Industry Share and BPS Analysis By End Use– 2023 to 2033

Figure 19: Industry Y-o-Y Growth Projections By End Use, 2023 to 2033

Figure 20: Industry Attractiveness Analysis By End Use, 2023 to 2033

Figure 21: Industry Absolute $ Opportunity by Residential and Commercial Building Segment, 2018 to 2033

Figure 22: Industry Absolute $ Opportunity by Civic Infrastructure Segment, 2018 to 2033

Figure 23: Industry Absolute $ Opportunity by Industrial & Marine Construction Segment, 2018 to 2033

Figure 24: Industry Share and BPS Analysis By Country– 2023 to 2033

Figure 25: Industry Y-o-Y Growth Projections By Country, 2023 to 2033

Figure 26: Industry Attractiveness Analysis By Country, 2023 to 2033

Figure 27: Industry Absolute $ Opportunity by Germany Segment, 2018 to 2033

Figure 28: Industry Absolute $ Opportunity by Italy Segment, 2018 to 2033

Figure 29: Industry Absolute $ Opportunity by France Segment, 2018 to 2033

Figure 30: Industry Absolute $ Opportunity by United Kingdom Segment, 2018 to 2033

Figure 31: Industry Absolute $ Opportunity by Spain Segment, 2018 to 2033

Figure 32: Industry Absolute $ Opportunity by BENELUX Segment, 2018 to 2033

Figure 33: Industry Absolute $ Opportunity by Russia Segment, 2018 to 2033

Figure 34: Industry Absolute $ Opportunity by Rest of Europe Segment, 2018 to 2033

Figure 35: Germany Industry Share and BPS Analysis By Product Type– 2023 to 2033

Figure 36: Germany Industry Y-o-Y Growth Projections By Product Type, 2023 to 2033

Figure 37: Germany Industry Attractiveness Analysis By Product Type, 2023 to 2033

Figure 38: Germany Industry Share and BPS Analysis By End Use– 2023 to 2033

Figure 39: Germany Industry Y-o-Y Growth Projections By End Use, 2023 to 2033

Figure 40: Germany Industry Attractiveness Analysis By End Use, 2023 to 2033

Figure 41: Italy Industry Share and BPS Analysis By Product Type– 2023 to 2033

Figure 42: Italy Industry Y-o-Y Growth Projections By Product Type, 2023 to 2033

Figure 43: Italy Industry Attractiveness Analysis By Product Type, 2023 to 2033

Figure 44: Italy Industry Share and BPS Analysis By End Use– 2023 to 2033

Figure 45: Italy Industry Y-o-Y Growth Projections By End Use, 2023 to 2033

Figure 46: Italy Industry Attractiveness Analysis By End Use, 2023 to 2033

Figure 47: France Industry Share and BPS Analysis By Product Type– 2023 to 2033

Figure 48: France Industry Y-o-Y Growth Projections By Product Type, 2023 to 2033

Figure 49: France Industry Attractiveness Analysis By Product Type, 2023 to 2033

Figure 50: France Industry Share and BPS Analysis By End Use– 2023 to 2033

Figure 51: France Industry Y-o-Y Growth Projections By End Use, 2023 to 2033

Figure 52: France Industry Attractiveness Analysis By End Use, 2023 to 2033

Figure 53: United Kingdom Industry Share and BPS Analysis By Product Type– 2023 to 2033

Figure 54: United Kingdom Industry Y-o-Y Growth Projections By Product Type, 2023 to 2033

Figure 55: United Kingdom Industry Attractiveness Analysis By Product Type, 2023 to 2033

Figure 56: United Kingdom Industry Share and BPS Analysis By End Use– 2023 to 2033

Figure 57: United Kingdom Industry Y-o-Y Growth Projections By End Use, 2023 to 2033

Figure 58: United Kingdom Industry Attractiveness Analysis By End Use, 2023 to 2033

Figure 59: Spain Industry Share and BPS Analysis By Product Type– 2023 to 2033

Figure 60: Spain Industry Y-o-Y Growth Projections By Product Type, 2023 to 2033

Figure 61: Spain Industry Attractiveness Analysis By Product Type, 2023 to 2033

Figure 62: Spain Industry Share and BPS Analysis By End Use– 2023 to 2033

Figure 63: Spain Industry Y-o-Y Growth Projections By End Use, 2023 to 2033

Figure 64: Spain Industry Attractiveness Analysis By End Use, 2023 to 2033

Figure 65: BENELUX Industry Share and BPS Analysis By Product Type– 2023 to 2033

Figure 66: BENELUX Industry Y-o-Y Growth Projections By Product Type, 2023 to 2033

Figure 67: BENELUX Industry Attractiveness Analysis By Product Type, 2023 to 2033

Figure 68: BENELUX Industry Share and BPS Analysis By End Use– 2023 to 2033

Figure 69: BENELUX Industry Y-o-Y Growth Projections By End Use, 2023 to 2033

Figure 70: BENELUX Industry Attractiveness Analysis By End Use, 2023 to 2033

Figure 71: Russia Industry Share and BPS Analysis By Product Type– 2023 to 2033

Figure 72: Russia Industry Y-o-Y Growth Projections By Product Type, 2023 to 2033

Figure 73: Russia Industry Attractiveness Analysis By Product Type, 2023 to 2033

Figure 74: Russia Industry Share and BPS Analysis By End Use– 2023 to 2033

Figure 75: Russia Industry Y-o-Y Growth Projections By End Use, 2023 to 2033

Figure 76: Russia Industry Attractiveness Analysis By End Use, 2023 to 2033

Figure 77: Rest of Industry Share and BPS Analysis By Product Type– 2023 to 2033

Figure 78: Rest of Industry Y-o-Y Growth Projections By Product Type, 2023 to 2033

Figure 79: Rest of Industry Attractiveness Analysis By Product Type, 2023 to 2033

Figure 80: Rest of Industry Share and BPS Analysis By End Use– 2023 to 2033

Figure 81: Rest of Industry Y-o-Y Growth Projections By End Use, 2023 to 2033

Figure 82: Rest of Industry Attractiveness Analysis By End Use, 2023 to 2033

Recommendations

Chemicals & Materials

Fiber Cement Market

Published : July 2023

Chemicals & Materials

Construction Aggregates Market

Published : June 2023

Chemicals & Materials

India Construction Chemicals Market

Published : January 2023

Explore Chemicals & Materials Insights

View Reports

Cement Industry Analysis in Europe