European Union Tourism Industrial Size and Share Forecast Outlook 2025 to 2035

The European Union Tourism Industry is estimated to be valued at USD 722.9 billion in 2025 and is projected to reach USD 1490.0 billion by 2035, registering a compound annual growth rate (CAGR) of 7.4% over the forecast period.
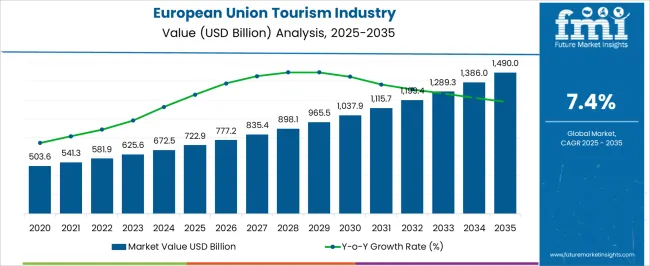
Quick Stats for European Union Tourism Industry

  • European Union Tourism Industry Industry Value (2025): USD 722.9 billion
  • European Union Tourism Industry Forecast Value (2035): USD 1490.0 billion
  • European Union Tourism Industry Forecast CAGR: 7.4%
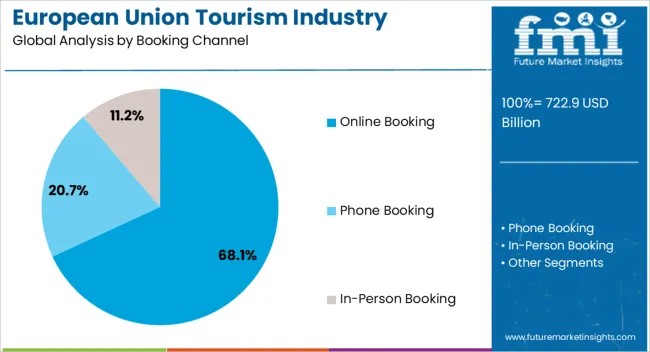
  • Leading Segment in European Union Tourism Industry in 2025: Online Booking (68.1%)
  • Key Growth Region in European Union Tourism Industry: North America, Asia-Pacific, Europe
  • Top Key Players in European Union Tourism Industry: Topdeck, The Natural Adventure Company, G Adventures, Intrepid, Trafalgar, GJ Travel, Shamrocker Adventures, Exodus Travel, On Go Tours, Tauck, Tuckan Travel

European Union Tourism Industry Market Value Analysis

Metric Value
European Union Tourism Industry Estimated Value in (2025 E) USD 722.9 billion
European Union Tourism Industry Forecast Value in (2035 F) USD 1490.0 billion
Forecast CAGR (2025 to 2035) 7.4%

Rationale for Segmental Growth in the European Union Tourism Industry

The European Union tourism industry continues to grow, driven by rising intra-regional travel, digital adoption, and supportive government policies promoting cultural and leisure tourism. The industry benefits from the strong presence of historic attractions, diverse travel offerings, and advanced infrastructure supporting seamless mobility.

Post-pandemic recovery has accelerated the shift toward digital booking platforms, reflecting consumer demand for convenience and customization. The market is also shaped by changing demographics, with younger age groups and urban populations showing higher travel frequency and discretionary spending.

Sustainability-focused tourism initiatives and cross-border collaborations are reinforcing long-term competitiveness. As digital ecosystems integrate artificial intelligence and mobile-first experiences, the outlook remains promising with an emphasis on personalized, value-driven travel experiences.
Segmental Analysis

Insights into the Online Booking Segment

European Union Tourism Industry Analysis By Booking Channel

The online booking segment dominates the booking channel category with approximately 68.1% share, underscoring the digital transformation of travel planning in the European Union. Convenience, price transparency, and widespread smartphone penetration have made online platforms the preferred choice for travelers.

The segment’s growth is supported by aggregator websites, mobile applications, and direct airline and hotel booking platforms offering instant confirmations and dynamic pricing. Integration of AI-driven recommendations and loyalty programs further strengthens consumer engagement.

With younger travelers exhibiting a strong preference for digital-first interactions, online booking is expected to retain its leadership, supported by continuous advancements in user experience and secure payment systems.
Insights into the Men Segment

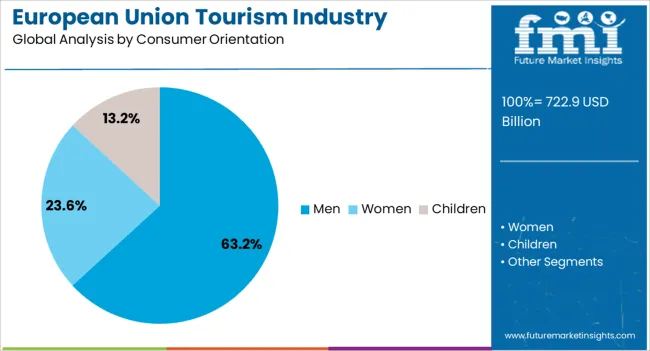
European Union Tourism Industry Analysis By Consumer Orientation

The men segment holds approximately 63.2% share in the consumer orientation category of the tourism industry in the European Union. This segment’s dominance is linked to higher reported participation in international and leisure travel among men, driven by employment-related mobility and discretionary spending.

Male travelers often exhibit a higher inclination toward adventure tourism, sports-related trips, and international travel packages. The segment also benefits from loyalty to digital booking platforms and structured travel itineraries.

With stable income patterns and greater engagement in business-related tourism, the men category is expected to sustain its leading share over the forecast horizon.
Insights into the 26–35 Years Segment

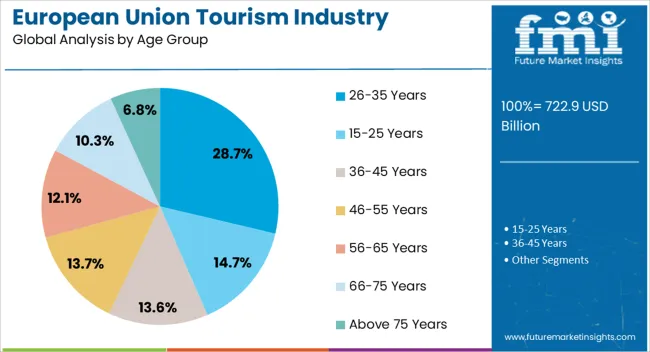
European Union Tourism Industry Analysis By Age Group

The 26–35 years segment accounts for approximately 28.7% share of the age group category, reflecting its significant influence on tourism trends across the European Union. This age group is characterized by higher disposable incomes, strong digital adoption, and a preference for experiential travel.

Frequent use of online platforms, combined with greater flexibility for short-haul and long-haul trips, has boosted demand from this demographic. The segment also demonstrates strong interest in adventure, cultural, and wellness tourism, aligning with evolving industry offerings.

With technology-driven travel solutions increasingly tailored to younger travelers, the 26–35 years age group is anticipated to remain a key driver of growth in the EU tourism market.

Key Industry Highlights

Cultural Kaleidoscope Propelling the European Union Tourism Boom

The European Union tourism sector is its rich cultural diversity and historical heritage. The European Union boasts a wealth of iconic landmarks, museums, and UNESCO World Heritage Sites, attracting millions of visitors each year.

From the ancient ruins of Rome to the vibrant art scene in Paris, the cultural offerings of European Union member states appeal to tourists seeking immersive experiences. The cultural allure serves as a powerful magnet, drawing travelers from around the world and contributing significantly to the industrial growth and sustainability of the tourism sector.

Sustainable Surge in Transformation of the European Union Tourism Landscape

The surge of sustainable and responsible travel practices where travelers are widely prioritizing eco-friendly accommodations, supporting local communities, and seeking authentic cultural experiences while minimizing the environmental impact.

The trend is fueled by growing awareness of environmental issues and a desire for more meaningful travel experiences. European Union destinations are responding by promoting sustainable tourism initiatives, such as eco-tours, green certifications for accommodations, and conservation efforts in natural areas.

As sustainability becomes a central focus, the tourism landscape is reshaping in the European Union, offering both environmental benefits and enriching experiences for travelers.

Striking a Balance by Tackling Overtourism in the European Union

Cities like Venice, Barcelona, and Amsterdam face overcrowding issues, leading to environmental degradation, strain on infrastructure, and negative impacts on the quality of life for residents. Overtourism also threatens the preservation of cultural heritage and authenticity in the destinations.

The sector contributes to an upsurge in housing costs and displacement of residents, exacerbating social inequalities. Addressing overtourism requires sustainable tourism management strategies, including crowd control measures, diversification of tourism offerings, and efforts to promote less-visited destinations within the European Union.

2020 to 2024 European Union Tourism Demand Outlook Compared to Demand Forecast from 2025 to 2035

The European Union's tourism landscape has experienced steady growth from 2020 to 2025, reflected in the historical CAGR of 4.5%. The growth can be attributed to an upsurge in disposable income, improved transportation infrastructure, and marketing efforts to promote European Union destinations. The growth rate during the period can be characterized as moderate compared to other regions or industries.

Looking ahead to the forecast period from 2025 to 2035, the European Union tourism industry is expected to enter a phase of accelerated expansion, with a projected CAGR of 7.5%. Advancements in technology and digitalization are expected to enhance the overall travel experience, making the sector more convenient and accessible for tourists.

The future of tourism investment in the European Union in emerging ecosystems, particularly in Asia and Africa, is anticipated to drive a surge in international tourism to European Union destinations. Efforts promoting sustainable tourism practices and cultural exchange initiatives attract a broader range of travelers seeking authentic and responsible experiences.

External factors such as geopolitical tensions, natural disasters, and health crises can impact travel demand and consumer behavior unpredictably. The landscape must navigate sustainability concerns, including over-tourism in popular destinations and environmental conservation efforts.

To capitalize on the projected growth, stakeholders in the European Union tourism sector must prioritize strategic investments in infrastructure, sustainable tourism initiatives, and marketing efforts to promote lesser-known destinations and ensure inclusive growth across regions.
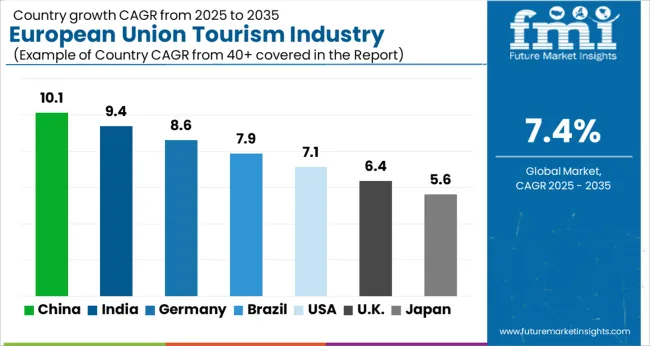
Country-wise Insights

European Union Tourism Industry Cagr Analysis By Country

The table represents the top five countries ranked by revenue, with Spain holding the top position. The industry is led significantly by sales of the European Union tourism industry in Spain, the United Kingdom, and France. Western Europe region emerges as a key industry at a global level.

The Forecast CAGRs from 2025 to 2035

The impact of EU investment on Sustainable Tourism Practices in Spain

Spain's tourism sector serves as a cornerstone of its economy, contributing significantly to GDP, employment, and regional development. The country's diverse attractions, including historic landmarks, vibrant culture, and sun-soaked beaches, draw millions of visitors each year.

In Spain, tourism is deeply ingrained in the fabric of society, with iconic destinations like Barcelona, Madrid, and Andalusia attracting international travelers seeking rich cultural experiences. The allure of Spanish cuisine, renowned for its tapas, paella, and world-class wines, further enhances the tourism appeal.

Spain's natural beauty, from the rugged landscapes of the Pyrenees to the pristine beaches of the Balearic Islands, offers a plethora of outdoor activities for nature enthusiasts and adventure seekers.

The tourism ecosystem in Spain also plays a vital role in regional development, with coastal areas like the Costa del Sol and the Canary Islands heavily reliant on tourism for economic prosperity.

The Development of Wellness Tourism and its potential for Growth within the EU Impresses the United Kingdom Industry

In the United Kingdom, tourism is a multifaceted ecosystem that encompasses cultural heritage, urban attractions, and natural landscapes. Iconic landmarks like Buckingham Palace, the Tower of London, and Stonehenge attract visitors from around the globe, contributing to the United Kingdom's status as a top tourist destination.

London, the capital city, stands out as a cultural and economic hub, drawing tourists with its world-class museums, theaters, and shopping districts. The rich history and cultural heritage of the United Kingdom, exemplified by Shakespearean theater, medieval castles, and picturesque villages, provide a unique draw for international tourists seeking immersive experiences.

The sector benefits from its status as a financial center, attracting business travelers and facilitating MICE (Meetings, Incentives, Conferences, and Exhibitions) tourism.

Visa and Immigration Policies within the EU Impacting Ease of Travel for Tourists in France

Visa and immigration policies within the EU play an important role in shaping the ease of travel for tourists in France. As a Schengen member state, France benefits from the Schengen Agreement's visa-free travel for citizens of many countries, simplifying entry procedures for tourists.

Fluctuations in EU visa policies, such as changes in visa requirements or stricter border controls, can impact tourist flows. Streamlined visa processes and consistent immigration policies within the EU are essential to maintaining France's attractiveness as a tourist destination.

Category-wise Insights

The section contains information about the leading segments in the industry. Based on consumer orientation, the men segment is estimated to account for a share of 63.2% by 2035. By tour type, the independent traveler category is projected to dominate by holding a share of 43.8% in 2035.

Evolving Role of Men in European Union Tourism Management

Attribute Details
Consumer Orientation Men
Industrial Share in 2025 63.2%

Based on the consumer orientation, the men’s segment is accounted to hold an industrial share of 63.2% in 2025.

Changing societal norms may result in more men participating in leisure travel independently or in groups. Targeted marketing strategies tailored to male preferences and interests could also play a role in attracting a larger share of male travelers.

Understanding the specific needs and desires of male tourists, for cultural experiences, sports events, or wellness retreats, will be crucial for businesses and destinations looking to capitalize on this consumer segment's dominance.

Independent Travelers Exploring Destinations by Immersing in Local Culture

Attribute Details
Tour Type Independent Traveler
Industrial Share in 2025 43.8%

Based on tour type, the independent traveler segment is accounted to hold an industrial share of 43.8% in 2025.

Independent travelers seek to explore destinations, allowing for greater immersion in local culture, interactions with residents, and off-the-beaten-path discoveries. Technological advancements, such as online booking platforms, mobile apps, and digital guides, have empowered travelers to plan and manage such trips independently, further fueling the growth of this segment.

The surge of remote work and digital nomadism has enabled more people to embark on extended independent travel adventures, blurring the lines between leisure and work-related tourism.
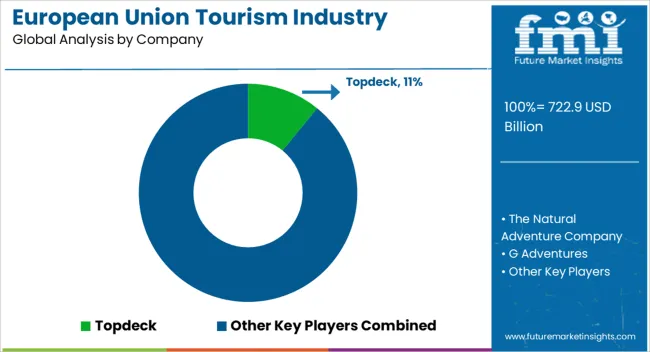
Competition Outlook

European Union Tourism Industry Analysis By Company

The competitive outlook of the European Union tourism industry is marked by a dynamic landscape characterized by both traditional players and innovative startups. Established tourism businesses, including hotels, airlines, and tour operators, compete alongside emerging startups leveraging technology to disrupt the ecosystem.

The startups often focus on niche segments, such as sustainable travel, experiential tourism, or peer-to-peer accommodation platforms, challenging incumbents and reshaping consumer preferences.

Mergers and acquisitions play a significant role in the competitive dynamics of the sector, with larger companies acquiring startups to expand offerings or gain access to new sectors. Startups may merge to consolidate resources and scale such operations more efficiently.

Industry Updates

  • In 2025, Topdeck Travel partnered with leading sustainability organizations to enhance eco-friendly initiatives. The key development reflects Topdeck's commitment to promoting sustainable tourism practices within the European Union, aligning with growing consumer demand for environmentally responsible travel options.
  • In 2025, The Natural Adventure Company introduced a new digital platform aimed at enhancing the customer experience. The platform integrated interactive maps, personalized itineraries, and real-time updates, providing travelers with greater flexibility and convenience while exploring Europe's natural landscapes. The innovative development underscored the company's focus on leveraging technology to offer immersive and seamless travel experiences within the European Union.

Leading European Union Tourism Brands

  • Topdeck
  • The Natural Adventure Company
  • G Adventures
  • Intrepid
  • Trafalgar
  • GJ Travel
  • Shamrocker Adventures
  • Exodus Travel
  • On Go tours
  • Tauck
  • Tuckan Travel

Key Segments

By Booking Channel:

The industry is classified into phone booking, online booking and in-person booking.

By Consumer Orientation:

The report consists of key sourcing, such as men, women and children.

By Age group:

The segment comprises of 15-25 years, 26-35 years, 36-45 years, 46-55 years, 56-65 years and 66-75 years.

By Tour type:

In terms of tour type, the industry is divided into independent traveler, tour group, and package traveller.

By Tourist Type:

A few of the important tourist types are domestic and international.

By Region:

Analysis of the ecosystem has been carried out in key countries of the United Kingdom, Germany, Italy, France and Spain.

Frequently Asked Questions

How big is the European Union tourism industry in 2025?

The global European Union tourism industry is estimated to be valued at USD 722.9 billion in 2025.

What will be the size of European Union tourism industry in 2035?

The market size for the European Union tourism industry is projected to reach USD 1,490.0 billion by 2035.

How much will be the European Union tourism industry growth between 2025 and 2035?

The European Union tourism industry is expected to grow at a 7.4% CAGR between 2025 and 2035.

What are the key product types in the European Union tourism industry?

The key product types in European Union tourism industry are online booking, phone booking and in-person booking.

Which consumer orientation segment to contribute significant share in the European Union tourism industry in 2025?

In terms of consumer orientation, men segment to command 63.2% share in the European Union tourism industry in 2025.

Table of Content

  1. Executive Summary
    • Global Market Outlook
    • Demand-side Trends
    • Supply-side Trends
    • Technology Roadmap Analysis
    • Analysis and Recommendations
  2. Market Overview
    • Market Coverage / Taxonomy
    • Market Definition / Scope / Limitations
  3. Market Background
    • Market Dynamics
      • Drivers
      • Restraints
      • Opportunity
      • Trends
    • Scenario Forecast
      • Demand in Optimistic Scenario
      • Demand in Likely Scenario
      • Demand in Conservative Scenario
    • Opportunity Map Analysis
    • Product Life Cycle Analysis
    • Supply Chain Analysis
    • Investment Feasibility Matrix
    • Value Chain Analysis
    • PESTLE and Porter’s Analysis
    • Regulatory Landscape
    • Regional Parent Market Outlook
    • Production and Consumption Statistics
    • Import and Export Statistics
  4. Global Industry Analysis 2020 to 2024 and Forecast, 2025 to 2035
    • Historical Market Size Value (USD Million) Analysis, 2020 to 2024
    • Current and Future Market Size Value (USD Million) Projections, 2025 to 2035
      • Y-o-Y Growth Trend Analysis
      • Absolute $ Opportunity Analysis
  5. Global Industry Pricing Analysis 2020 to 2024 and Forecast 2025 to 2035
  6. Global Industry Analysis 2020 to 2024 and Forecast 2025 to 2035, By Booking Channel
    • Introduction / Key Findings
    • Historical Market Size Value (USD Million) Analysis By Booking Channel , 2020 to 2024
    • Current and Future Market Size Value (USD Million) Analysis and Forecast By Booking Channel , 2025 to 2035
      • Online Booking
      • Phone Booking
      • In-Person Booking
    • Y-o-Y Growth Trend Analysis By Booking Channel , 2020 to 2024
    • Absolute $ Opportunity Analysis By Booking Channel , 2025 to 2035
  7. Global Industry Analysis 2020 to 2024 and Forecast 2025 to 2035, By Consumer Orientation
    • Introduction / Key Findings
    • Historical Market Size Value (USD Million) Analysis By Consumer Orientation, 2020 to 2024
    • Current and Future Market Size Value (USD Million) Analysis and Forecast By Consumer Orientation, 2025 to 2035
      • Men
      • Women
      • Children
    • Y-o-Y Growth Trend Analysis By Consumer Orientation, 2020 to 2024
    • Absolute $ Opportunity Analysis By Consumer Orientation, 2025 to 2035
  8. Global Industry Analysis 2020 to 2024 and Forecast 2025 to 2035, By Age Group
    • Introduction / Key Findings
    • Historical Market Size Value (USD Million) Analysis By Age Group, 2020 to 2024
    • Current and Future Market Size Value (USD Million) Analysis and Forecast By Age Group, 2025 to 2035
      • 26-35 Years
      • 15-25 Years
      • 36-45 Years
      • 46-55 Years
      • 56-65 Years
      • 66-75 Years
      • Above 75 Years
    • Y-o-Y Growth Trend Analysis By Age Group, 2020 to 2024
    • Absolute $ Opportunity Analysis By Age Group, 2025 to 2035
  9. Global Industry Analysis 2020 to 2024 and Forecast 2025 to 2035, By Tour Type
    • Introduction / Key Findings
    • Historical Market Size Value (USD Million) Analysis By Tour Type, 2020 to 2024
    • Current and Future Market Size Value (USD Million) Analysis and Forecast By Tour Type, 2025 to 2035
      • Independent Traveller
      • Tour Group
      • Package Traveller
    • Y-o-Y Growth Trend Analysis By Tour Type, 2020 to 2024
    • Absolute $ Opportunity Analysis By Tour Type, 2025 to 2035
  10. Global Industry Analysis 2020 to 2024 and Forecast 2025 to 2035, By Tourist Type
    • Introduction / Key Findings
    • Historical Market Size Value (USD Million) Analysis By Tourist Type, 2020 to 2024
    • Current and Future Market Size Value (USD Million) Analysis and Forecast By Tourist Type, 2025 to 2035
      • International Tourist
      • Domestic Tourist
    • Y-o-Y Growth Trend Analysis By Tourist Type, 2020 to 2024
    • Absolute $ Opportunity Analysis By Tourist Type, 2025 to 2035
  11. Global Industry Analysis 2020 to 2024 and Forecast 2025 to 2035, By Region
    • Introduction
    • Historical Market Size Value (USD Million) Analysis By Region, 2020 to 2024
    • Current Market Size Value (USD Million) Analysis and Forecast By Region, 2025 to 2035
      • North America
      • Latin America
      • Western Europe
      • Eastern Europe
      • East Asia
      • South Asia and Pacific
      • Middle East & Africa
    • Market Attractiveness Analysis By Region
  12. North America Industry Analysis 2020 to 2024 and Forecast 2025 to 2035, By Country
    • Historical Market Size Value (USD Million) Trend Analysis By Market Taxonomy, 2020 to 2024
    • Market Size Value (USD Million) Forecast By Market Taxonomy, 2025 to 2035
      • By Country
        • USA
        • Canada
        • Mexico
      • By Booking Channel
      • By Consumer Orientation
      • By Age Group
      • By Tour Type
      • By Tourist Type
    • Market Attractiveness Analysis
      • By Country
      • By Booking Channel
      • By Consumer Orientation
      • By Age Group
      • By Tour Type
      • By Tourist Type
    • Key Takeaways
  13. Latin America Industry Analysis 2020 to 2024 and Forecast 2025 to 2035, By Country
    • Historical Market Size Value (USD Million) Trend Analysis By Market Taxonomy, 2020 to 2024
    • Market Size Value (USD Million) Forecast By Market Taxonomy, 2025 to 2035
      • By Country
        • Brazil
        • Chile
        • Rest of Latin America
      • By Booking Channel
      • By Consumer Orientation
      • By Age Group
      • By Tour Type
      • By Tourist Type
    • Market Attractiveness Analysis
      • By Country
      • By Booking Channel
      • By Consumer Orientation
      • By Age Group
      • By Tour Type
      • By Tourist Type
    • Key Takeaways
  14. Western Europe Industry Analysis 2020 to 2024 and Forecast 2025 to 2035, By Country
    • Historical Market Size Value (USD Million) Trend Analysis By Market Taxonomy, 2020 to 2024
    • Market Size Value (USD Million) Forecast By Market Taxonomy, 2025 to 2035
      • By Country
        • Germany
        • UK
        • Italy
        • Spain
        • France
        • Nordic
        • BENELUX
        • Rest of Western Europe
      • By Booking Channel
      • By Consumer Orientation
      • By Age Group
      • By Tour Type
      • By Tourist Type
    • Market Attractiveness Analysis
      • By Country
      • By Booking Channel
      • By Consumer Orientation
      • By Age Group
      • By Tour Type
      • By Tourist Type
    • Key Takeaways
  15. Eastern Europe Industry Analysis 2020 to 2024 and Forecast 2025 to 2035, By Country
    • Historical Market Size Value (USD Million) Trend Analysis By Market Taxonomy, 2020 to 2024
    • Market Size Value (USD Million) Forecast By Market Taxonomy, 2025 to 2035
      • By Country
        • Russia
        • Poland
        • Hungary
        • Balkan & Baltic
        • Rest of Eastern Europe
      • By Booking Channel
      • By Consumer Orientation
      • By Age Group
      • By Tour Type
      • By Tourist Type
    • Market Attractiveness Analysis
      • By Country
      • By Booking Channel
      • By Consumer Orientation
      • By Age Group
      • By Tour Type
      • By Tourist Type
    • Key Takeaways
  16. East Asia Industry Analysis 2020 to 2024 and Forecast 2025 to 2035, By Country
    • Historical Market Size Value (USD Million) Trend Analysis By Market Taxonomy, 2020 to 2024
    • Market Size Value (USD Million) Forecast By Market Taxonomy, 2025 to 2035
      • By Country
        • China
        • Japan
        • South Korea
      • By Booking Channel
      • By Consumer Orientation
      • By Age Group
      • By Tour Type
      • By Tourist Type
    • Market Attractiveness Analysis
      • By Country
      • By Booking Channel
      • By Consumer Orientation
      • By Age Group
      • By Tour Type
      • By Tourist Type
    • Key Takeaways
  17. South Asia and Pacific Industry Analysis 2020 to 2024 and Forecast 2025 to 2035, By Country
    • Historical Market Size Value (USD Million) Trend Analysis By Market Taxonomy, 2020 to 2024
    • Market Size Value (USD Million) Forecast By Market Taxonomy, 2025 to 2035
      • By Country
        • India
        • ASEAN
        • Australia & New Zealand
        • Rest of South Asia and Pacific
      • By Booking Channel
      • By Consumer Orientation
      • By Age Group
      • By Tour Type
      • By Tourist Type
    • Market Attractiveness Analysis
      • By Country
      • By Booking Channel
      • By Consumer Orientation
      • By Age Group
      • By Tour Type
      • By Tourist Type
    • Key Takeaways
  18. Middle East & Africa Industry Analysis 2020 to 2024 and Forecast 2025 to 2035, By Country
    • Historical Market Size Value (USD Million) Trend Analysis By Market Taxonomy, 2020 to 2024
    • Market Size Value (USD Million) Forecast By Market Taxonomy, 2025 to 2035
      • By Country
        • Kingdom of Saudi Arabia
        • Other GCC Countries
        • Turkiye
        • South Africa
        • Other African Union
        • Rest of Middle East & Africa
      • By Booking Channel
      • By Consumer Orientation
      • By Age Group
      • By Tour Type
      • By Tourist Type
    • Market Attractiveness Analysis
      • By Country
      • By Booking Channel
      • By Consumer Orientation
      • By Age Group
      • By Tour Type
      • By Tourist Type
    • Key Takeaways
  19. Key Countries Industry Analysis
    • USA
      • Pricing Analysis
      • Market Share Analysis, 2024
        • By Booking Channel
        • By Consumer Orientation
        • By Age Group
        • By Tour Type
        • By Tourist Type
    • Canada
      • Pricing Analysis
      • Market Share Analysis, 2024
        • By Booking Channel
        • By Consumer Orientation
        • By Age Group
        • By Tour Type
        • By Tourist Type
    • Mexico
      • Pricing Analysis
      • Market Share Analysis, 2024
        • By Booking Channel
        • By Consumer Orientation
        • By Age Group
        • By Tour Type
        • By Tourist Type
    • Brazil
      • Pricing Analysis
      • Market Share Analysis, 2024
        • By Booking Channel
        • By Consumer Orientation
        • By Age Group
        • By Tour Type
        • By Tourist Type
    • Chile
      • Pricing Analysis
      • Market Share Analysis, 2024
        • By Booking Channel
        • By Consumer Orientation
        • By Age Group
        • By Tour Type
        • By Tourist Type
    • Germany
      • Pricing Analysis
      • Market Share Analysis, 2024
        • By Booking Channel
        • By Consumer Orientation
        • By Age Group
        • By Tour Type
        • By Tourist Type
    • UK
      • Pricing Analysis
      • Market Share Analysis, 2024
        • By Booking Channel
        • By Consumer Orientation
        • By Age Group
        • By Tour Type
        • By Tourist Type
    • Italy
      • Pricing Analysis
      • Market Share Analysis, 2024
        • By Booking Channel
        • By Consumer Orientation
        • By Age Group
        • By Tour Type
        • By Tourist Type
    • Spain
      • Pricing Analysis
      • Market Share Analysis, 2024
        • By Booking Channel
        • By Consumer Orientation
        • By Age Group
        • By Tour Type
        • By Tourist Type
    • France
      • Pricing Analysis
      • Market Share Analysis, 2024
        • By Booking Channel
        • By Consumer Orientation
        • By Age Group
        • By Tour Type
        • By Tourist Type
    • India
      • Pricing Analysis
      • Market Share Analysis, 2024
        • By Booking Channel
        • By Consumer Orientation
        • By Age Group
        • By Tour Type
        • By Tourist Type
    • ASEAN
      • Pricing Analysis
      • Market Share Analysis, 2024
        • By Booking Channel
        • By Consumer Orientation
        • By Age Group
        • By Tour Type
        • By Tourist Type
    • Australia & New Zealand
      • Pricing Analysis
      • Market Share Analysis, 2024
        • By Booking Channel
        • By Consumer Orientation
        • By Age Group
        • By Tour Type
        • By Tourist Type
    • China
      • Pricing Analysis
      • Market Share Analysis, 2024
        • By Booking Channel
        • By Consumer Orientation
        • By Age Group
        • By Tour Type
        • By Tourist Type
    • Japan
      • Pricing Analysis
      • Market Share Analysis, 2024
        • By Booking Channel
        • By Consumer Orientation
        • By Age Group
        • By Tour Type
        • By Tourist Type
    • South Korea
      • Pricing Analysis
      • Market Share Analysis, 2024
        • By Booking Channel
        • By Consumer Orientation
        • By Age Group
        • By Tour Type
        • By Tourist Type
    • Russia
      • Pricing Analysis
      • Market Share Analysis, 2024
        • By Booking Channel
        • By Consumer Orientation
        • By Age Group
        • By Tour Type
        • By Tourist Type
    • Poland
      • Pricing Analysis
      • Market Share Analysis, 2024
        • By Booking Channel
        • By Consumer Orientation
        • By Age Group
        • By Tour Type
        • By Tourist Type
    • Hungary
      • Pricing Analysis
      • Market Share Analysis, 2024
        • By Booking Channel
        • By Consumer Orientation
        • By Age Group
        • By Tour Type
        • By Tourist Type
    • Kingdom of Saudi Arabia
      • Pricing Analysis
      • Market Share Analysis, 2024
        • By Booking Channel
        • By Consumer Orientation
        • By Age Group
        • By Tour Type
        • By Tourist Type
    • Turkiye
      • Pricing Analysis
      • Market Share Analysis, 2024
        • By Booking Channel
        • By Consumer Orientation
        • By Age Group
        • By Tour Type
        • By Tourist Type
    • South Africa
      • Pricing Analysis
      • Market Share Analysis, 2024
        • By Booking Channel
        • By Consumer Orientation
        • By Age Group
        • By Tour Type
        • By Tourist Type
  20. Market Structure Analysis
    • Competition Dashboard
    • Competition Benchmarking
    • Market Share Analysis of Top Players
      • By Regional
      • By Booking Channel
      • By Consumer Orientation
      • By Age Group
      • By Tour Type
      • By Tourist Type
  21. Competition Analysis
    • Competition Deep Dive
      • Topdeck
        • Overview
        • Product Portfolio
        • Profitability by Market Segments (Product/Age /Sales Channel/Region)
        • Sales Footprint
        • Strategy Overview
          • Marketing Strategy
          • Product Strategy
          • Channel Strategy
      • The Natural Adventure Company
      • G Adventures
      • Intrepid
      • Trafalgar
      • GJ Travel
      • Shamrocker Adventures
      • Exodus Travel
      • On Go Tours
      • Tauck
      • Tuckan Travel
  22. Assumptions & Acronyms Used
  23. Research Methodology

List of Tables

  • Table 1: Global Industry Value (USD Million) Forecast by Region, 2020 to 2035
  • Table 2: Global Industry Value (USD Million) Forecast by Booking Channel , 2020 to 2035
  • Table 3: Global Industry Value (USD Million) Forecast by Consumer Orientation, 2020 to 2035
  • Table 4: Global Industry Value (USD Million) Forecast by Age Group, 2020 to 2035
  • Table 5: Global Industry Value (USD Million) Forecast by Tour Type, 2020 to 2035
  • Table 6: Global Industry Value (USD Million) Forecast by Tourist Type, 2020 to 2035
  • Table 7: North America Industry Value (USD Million) Forecast by Country, 2020 to 2035
  • Table 8: North America Industry Value (USD Million) Forecast by Booking Channel , 2020 to 2035
  • Table 9: North America Industry Value (USD Million) Forecast by Consumer Orientation, 2020 to 2035
  • Table 10: North America Industry Value (USD Million) Forecast by Age Group, 2020 to 2035
  • Table 11: North America Industry Value (USD Million) Forecast by Tour Type, 2020 to 2035
  • Table 12: North America Industry Value (USD Million) Forecast by Tourist Type, 2020 to 2035
  • Table 13: Latin America Industry Value (USD Million) Forecast by Country, 2020 to 2035
  • Table 14: Latin America Industry Value (USD Million) Forecast by Booking Channel , 2020 to 2035
  • Table 15: Latin America Industry Value (USD Million) Forecast by Consumer Orientation, 2020 to 2035
  • Table 16: Latin America Industry Value (USD Million) Forecast by Age Group, 2020 to 2035
  • Table 17: Latin America Industry Value (USD Million) Forecast by Tour Type, 2020 to 2035
  • Table 18: Latin America Industry Value (USD Million) Forecast by Tourist Type, 2020 to 2035
  • Table 19: Western Europe Industry Value (USD Million) Forecast by Country, 2020 to 2035
  • Table 20: Western Europe Industry Value (USD Million) Forecast by Booking Channel , 2020 to 2035
  • Table 21: Western Europe Industry Value (USD Million) Forecast by Consumer Orientation, 2020 to 2035
  • Table 22: Western Europe Industry Value (USD Million) Forecast by Age Group, 2020 to 2035
  • Table 23: Western Europe Industry Value (USD Million) Forecast by Tour Type, 2020 to 2035
  • Table 24: Western Europe Industry Value (USD Million) Forecast by Tourist Type, 2020 to 2035
  • Table 25: Eastern Europe Industry Value (USD Million) Forecast by Country, 2020 to 2035
  • Table 26: Eastern Europe Industry Value (USD Million) Forecast by Booking Channel , 2020 to 2035
  • Table 27: Eastern Europe Industry Value (USD Million) Forecast by Consumer Orientation, 2020 to 2035
  • Table 28: Eastern Europe Industry Value (USD Million) Forecast by Age Group, 2020 to 2035
  • Table 29: Eastern Europe Industry Value (USD Million) Forecast by Tour Type, 2020 to 2035
  • Table 30: Eastern Europe Industry Value (USD Million) Forecast by Tourist Type, 2020 to 2035
  • Table 31: East Asia Industry Value (USD Million) Forecast by Country, 2020 to 2035
  • Table 32: East Asia Industry Value (USD Million) Forecast by Booking Channel , 2020 to 2035
  • Table 33: East Asia Industry Value (USD Million) Forecast by Consumer Orientation, 2020 to 2035
  • Table 34: East Asia Industry Value (USD Million) Forecast by Age Group, 2020 to 2035
  • Table 35: East Asia Industry Value (USD Million) Forecast by Tour Type, 2020 to 2035
  • Table 36: East Asia Industry Value (USD Million) Forecast by Tourist Type, 2020 to 2035
  • Table 37: South Asia and Pacific Industry Value (USD Million) Forecast by Country, 2020 to 2035
  • Table 38: South Asia and Pacific Industry Value (USD Million) Forecast by Booking Channel , 2020 to 2035
  • Table 39: South Asia and Pacific Industry Value (USD Million) Forecast by Consumer Orientation, 2020 to 2035
  • Table 40: South Asia and Pacific Industry Value (USD Million) Forecast by Age Group, 2020 to 2035
  • Table 41: South Asia and Pacific Industry Value (USD Million) Forecast by Tour Type, 2020 to 2035
  • Table 42: South Asia and Pacific Industry Value (USD Million) Forecast by Tourist Type, 2020 to 2035
  • Table 43: Middle East & Africa Industry Value (USD Million) Forecast by Country, 2020 to 2035
  • Table 44: Middle East & Africa Industry Value (USD Million) Forecast by Booking Channel , 2020 to 2035
  • Table 45: Middle East & Africa Industry Value (USD Million) Forecast by Consumer Orientation, 2020 to 2035
  • Table 46: Middle East & Africa Industry Value (USD Million) Forecast by Age Group, 2020 to 2035
  • Table 47: Middle East & Africa Industry Value (USD Million) Forecast by Tour Type, 2020 to 2035
  • Table 48: Middle East & Africa Industry Value (USD Million) Forecast by Tourist Type, 2020 to 2035

List of Figures

  • Figure 1: Global Industry Pricing Analysis
  • Figure 2: Global Industry Value (USD Million) Forecast 2020 to 2035
  • Figure 3: Global Industry Value Share and BPS Analysis by Booking Channel , 2025 and 2035
  • Figure 4: Global Industry Y-o-Y Growth Comparison by Booking Channel , 2025 to 2035
  • Figure 5: Global Industry Attractiveness Analysis by Booking Channel
  • Figure 6: Global Industry Value Share and BPS Analysis by Consumer Orientation, 2025 and 2035
  • Figure 7: Global Industry Y-o-Y Growth Comparison by Consumer Orientation, 2025 to 2035
  • Figure 8: Global Industry Attractiveness Analysis by Consumer Orientation
  • Figure 9: Global Industry Value Share and BPS Analysis by Age Group, 2025 and 2035
  • Figure 10: Global Industry Y-o-Y Growth Comparison by Age Group, 2025 to 2035
  • Figure 11: Global Industry Attractiveness Analysis by Age Group
  • Figure 12: Global Industry Value Share and BPS Analysis by Tour Type, 2025 and 2035
  • Figure 13: Global Industry Y-o-Y Growth Comparison by Tour Type, 2025 to 2035
  • Figure 14: Global Industry Attractiveness Analysis by Tour Type
  • Figure 15: Global Industry Value Share and BPS Analysis by Tourist Type, 2025 and 2035
  • Figure 16: Global Industry Y-o-Y Growth Comparison by Tourist Type, 2025 to 2035
  • Figure 17: Global Industry Attractiveness Analysis by Tourist Type
  • Figure 18: Global Industry Value (USD Million) Share and BPS Analysis by Region, 2025 and 2035
  • Figure 19: Global Industry Y-o-Y Growth Comparison by Region, 2025 to 2035
  • Figure 20: Global Industry Attractiveness Analysis by Region
  • Figure 21: North America Industry Incremental Dollar Opportunity, 2025 to 2035
  • Figure 22: Latin America Industry Incremental Dollar Opportunity, 2025 to 2035
  • Figure 23: Western Europe Industry Incremental Dollar Opportunity, 2025 to 2035
  • Figure 24: Eastern Europe Industry Incremental Dollar Opportunity, 2025 to 2035
  • Figure 25: East Asia Industry Incremental Dollar Opportunity, 2025 to 2035
  • Figure 26: South Asia and Pacific Industry Incremental Dollar Opportunity, 2025 to 2035
  • Figure 27: Middle East & Africa Industry Incremental Dollar Opportunity, 2025 to 2035
  • Figure 28: North America Industry Value Share and BPS Analysis by Country, 2025 and 2035
  • Figure 29: North America Industry Value Share and BPS Analysis by Booking Channel , 2025 and 2035
  • Figure 30: North America Industry Y-o-Y Growth Comparison by Booking Channel , 2025 to 2035
  • Figure 31: North America Industry Attractiveness Analysis by Booking Channel
  • Figure 32: North America Industry Value Share and BPS Analysis by Consumer Orientation, 2025 and 2035
  • Figure 33: North America Industry Y-o-Y Growth Comparison by Consumer Orientation, 2025 to 2035
  • Figure 34: North America Industry Attractiveness Analysis by Consumer Orientation
  • Figure 35: North America Industry Value Share and BPS Analysis by Age Group, 2025 and 2035
  • Figure 36: North America Industry Y-o-Y Growth Comparison by Age Group, 2025 to 2035
  • Figure 37: North America Industry Attractiveness Analysis by Age Group
  • Figure 38: North America Industry Value Share and BPS Analysis by Tour Type, 2025 and 2035
  • Figure 39: North America Industry Y-o-Y Growth Comparison by Tour Type, 2025 to 2035
  • Figure 40: North America Industry Attractiveness Analysis by Tour Type
  • Figure 41: North America Industry Value Share and BPS Analysis by Tourist Type, 2025 and 2035
  • Figure 42: North America Industry Y-o-Y Growth Comparison by Tourist Type, 2025 to 2035
  • Figure 43: North America Industry Attractiveness Analysis by Tourist Type
  • Figure 44: Latin America Industry Value Share and BPS Analysis by Country, 2025 and 2035
  • Figure 45: Latin America Industry Value Share and BPS Analysis by Booking Channel , 2025 and 2035
  • Figure 46: Latin America Industry Y-o-Y Growth Comparison by Booking Channel , 2025 to 2035
  • Figure 47: Latin America Industry Attractiveness Analysis by Booking Channel
  • Figure 48: Latin America Industry Value Share and BPS Analysis by Consumer Orientation, 2025 and 2035
  • Figure 49: Latin America Industry Y-o-Y Growth Comparison by Consumer Orientation, 2025 to 2035
  • Figure 50: Latin America Industry Attractiveness Analysis by Consumer Orientation
  • Figure 51: Latin America Industry Value Share and BPS Analysis by Age Group, 2025 and 2035
  • Figure 52: Latin America Industry Y-o-Y Growth Comparison by Age Group, 2025 to 2035
  • Figure 53: Latin America Industry Attractiveness Analysis by Age Group
  • Figure 54: Latin America Industry Value Share and BPS Analysis by Tour Type, 2025 and 2035
  • Figure 55: Latin America Industry Y-o-Y Growth Comparison by Tour Type, 2025 to 2035
  • Figure 56: Latin America Industry Attractiveness Analysis by Tour Type
  • Figure 57: Latin America Industry Value Share and BPS Analysis by Tourist Type, 2025 and 2035
  • Figure 58: Latin America Industry Y-o-Y Growth Comparison by Tourist Type, 2025 to 2035
  • Figure 59: Latin America Industry Attractiveness Analysis by Tourist Type
  • Figure 60: Western Europe Industry Value Share and BPS Analysis by Country, 2025 and 2035
  • Figure 61: Western Europe Industry Value Share and BPS Analysis by Booking Channel , 2025 and 2035
  • Figure 62: Western Europe Industry Y-o-Y Growth Comparison by Booking Channel , 2025 to 2035
  • Figure 63: Western Europe Industry Attractiveness Analysis by Booking Channel
  • Figure 64: Western Europe Industry Value Share and BPS Analysis by Consumer Orientation, 2025 and 2035
  • Figure 65: Western Europe Industry Y-o-Y Growth Comparison by Consumer Orientation, 2025 to 2035
  • Figure 66: Western Europe Industry Attractiveness Analysis by Consumer Orientation
  • Figure 67: Western Europe Industry Value Share and BPS Analysis by Age Group, 2025 and 2035
  • Figure 68: Western Europe Industry Y-o-Y Growth Comparison by Age Group, 2025 to 2035
  • Figure 69: Western Europe Industry Attractiveness Analysis by Age Group
  • Figure 70: Western Europe Industry Value Share and BPS Analysis by Tour Type, 2025 and 2035
  • Figure 71: Western Europe Industry Y-o-Y Growth Comparison by Tour Type, 2025 to 2035
  • Figure 72: Western Europe Industry Attractiveness Analysis by Tour Type
  • Figure 73: Western Europe Industry Value Share and BPS Analysis by Tourist Type, 2025 and 2035
  • Figure 74: Western Europe Industry Y-o-Y Growth Comparison by Tourist Type, 2025 to 2035
  • Figure 75: Western Europe Industry Attractiveness Analysis by Tourist Type
  • Figure 76: Eastern Europe Industry Value Share and BPS Analysis by Country, 2025 and 2035
  • Figure 77: Eastern Europe Industry Value Share and BPS Analysis by Booking Channel , 2025 and 2035
  • Figure 78: Eastern Europe Industry Y-o-Y Growth Comparison by Booking Channel , 2025 to 2035
  • Figure 79: Eastern Europe Industry Attractiveness Analysis by Booking Channel
  • Figure 80: Eastern Europe Industry Value Share and BPS Analysis by Consumer Orientation, 2025 and 2035
  • Figure 81: Eastern Europe Industry Y-o-Y Growth Comparison by Consumer Orientation, 2025 to 2035
  • Figure 82: Eastern Europe Industry Attractiveness Analysis by Consumer Orientation
  • Figure 83: Eastern Europe Industry Value Share and BPS Analysis by Age Group, 2025 and 2035
  • Figure 84: Eastern Europe Industry Y-o-Y Growth Comparison by Age Group, 2025 to 2035
  • Figure 85: Eastern Europe Industry Attractiveness Analysis by Age Group
  • Figure 86: Eastern Europe Industry Value Share and BPS Analysis by Tour Type, 2025 and 2035
  • Figure 87: Eastern Europe Industry Y-o-Y Growth Comparison by Tour Type, 2025 to 2035
  • Figure 88: Eastern Europe Industry Attractiveness Analysis by Tour Type
  • Figure 89: Eastern Europe Industry Value Share and BPS Analysis by Tourist Type, 2025 and 2035
  • Figure 90: Eastern Europe Industry Y-o-Y Growth Comparison by Tourist Type, 2025 to 2035
  • Figure 91: Eastern Europe Industry Attractiveness Analysis by Tourist Type
  • Figure 92: East Asia Industry Value Share and BPS Analysis by Country, 2025 and 2035
  • Figure 93: East Asia Industry Value Share and BPS Analysis by Booking Channel , 2025 and 2035
  • Figure 94: East Asia Industry Y-o-Y Growth Comparison by Booking Channel , 2025 to 2035
  • Figure 95: East Asia Industry Attractiveness Analysis by Booking Channel
  • Figure 96: East Asia Industry Value Share and BPS Analysis by Consumer Orientation, 2025 and 2035
  • Figure 97: East Asia Industry Y-o-Y Growth Comparison by Consumer Orientation, 2025 to 2035
  • Figure 98: East Asia Industry Attractiveness Analysis by Consumer Orientation
  • Figure 99: East Asia Industry Value Share and BPS Analysis by Age Group, 2025 and 2035
  • Figure 100: East Asia Industry Y-o-Y Growth Comparison by Age Group, 2025 to 2035
  • Figure 101: East Asia Industry Attractiveness Analysis by Age Group
  • Figure 102: East Asia Industry Value Share and BPS Analysis by Tour Type, 2025 and 2035
  • Figure 103: East Asia Industry Y-o-Y Growth Comparison by Tour Type, 2025 to 2035
  • Figure 104: East Asia Industry Attractiveness Analysis by Tour Type
  • Figure 105: East Asia Industry Value Share and BPS Analysis by Tourist Type, 2025 and 2035
  • Figure 106: East Asia Industry Y-o-Y Growth Comparison by Tourist Type, 2025 to 2035
  • Figure 107: East Asia Industry Attractiveness Analysis by Tourist Type
  • Figure 108: South Asia and Pacific Industry Value Share and BPS Analysis by Country, 2025 and 2035
  • Figure 109: South Asia and Pacific Industry Value Share and BPS Analysis by Booking Channel , 2025 and 2035
  • Figure 110: South Asia and Pacific Industry Y-o-Y Growth Comparison by Booking Channel , 2025 to 2035
  • Figure 111: South Asia and Pacific Industry Attractiveness Analysis by Booking Channel
  • Figure 112: South Asia and Pacific Industry Value Share and BPS Analysis by Consumer Orientation, 2025 and 2035
  • Figure 113: South Asia and Pacific Industry Y-o-Y Growth Comparison by Consumer Orientation, 2025 to 2035
  • Figure 114: South Asia and Pacific Industry Attractiveness Analysis by Consumer Orientation
  • Figure 115: South Asia and Pacific Industry Value Share and BPS Analysis by Age Group, 2025 and 2035
  • Figure 116: South Asia and Pacific Industry Y-o-Y Growth Comparison by Age Group, 2025 to 2035
  • Figure 117: South Asia and Pacific Industry Attractiveness Analysis by Age Group
  • Figure 118: South Asia and Pacific Industry Value Share and BPS Analysis by Tour Type, 2025 and 2035
  • Figure 119: South Asia and Pacific Industry Y-o-Y Growth Comparison by Tour Type, 2025 to 2035
  • Figure 120: South Asia and Pacific Industry Attractiveness Analysis by Tour Type
  • Figure 121: South Asia and Pacific Industry Value Share and BPS Analysis by Tourist Type, 2025 and 2035
  • Figure 122: South Asia and Pacific Industry Y-o-Y Growth Comparison by Tourist Type, 2025 to 2035
  • Figure 123: South Asia and Pacific Industry Attractiveness Analysis by Tourist Type
  • Figure 124: Middle East & Africa Industry Value Share and BPS Analysis by Country, 2025 and 2035
  • Figure 125: Middle East & Africa Industry Value Share and BPS Analysis by Booking Channel , 2025 and 2035
  • Figure 126: Middle East & Africa Industry Y-o-Y Growth Comparison by Booking Channel , 2025 to 2035
  • Figure 127: Middle East & Africa Industry Attractiveness Analysis by Booking Channel
  • Figure 128: Middle East & Africa Industry Value Share and BPS Analysis by Consumer Orientation, 2025 and 2035
  • Figure 129: Middle East & Africa Industry Y-o-Y Growth Comparison by Consumer Orientation, 2025 to 2035
  • Figure 130: Middle East & Africa Industry Attractiveness Analysis by Consumer Orientation
  • Figure 131: Middle East & Africa Industry Value Share and BPS Analysis by Age Group, 2025 and 2035
  • Figure 132: Middle East & Africa Industry Y-o-Y Growth Comparison by Age Group, 2025 to 2035
  • Figure 133: Middle East & Africa Industry Attractiveness Analysis by Age Group
  • Figure 134: Middle East & Africa Industry Value Share and BPS Analysis by Tour Type, 2025 and 2035
  • Figure 135: Middle East & Africa Industry Y-o-Y Growth Comparison by Tour Type, 2025 to 2035
  • Figure 136: Middle East & Africa Industry Attractiveness Analysis by Tour Type
  • Figure 137: Middle East & Africa Industry Value Share and BPS Analysis by Tourist Type, 2025 and 2035
  • Figure 138: Middle East & Africa Industry Y-o-Y Growth Comparison by Tourist Type, 2025 to 2035
  • Figure 139: Middle East & Africa Industry Attractiveness Analysis by Tourist Type
  • Figure 140: Global Industry – Tier Structure Analysis
  • Figure 141: Global Industry – Company Share Analysis
Dashboard
Dashboard
Dashboard
Dashboard
Dashboard
Dashboard

Full Research Suite comprises of:

Market outlook & trends analysis

Market outlook & trends analysis

Interviews & case studies

Interviews & case studies

Strategic recommendations

Strategic recommendations

Vendor profiles & capabilities analysis

Vendor profiles & capabilities analysis

5-year forecasts

5-year forecasts

8 regions and 60+ country-level data splits

8 regions and 60+ country-level data splits

Market segment data splits

Market segment data splits

12 months of continuous data updates

12 months of continuous data updates

DELIVERED AS:

PDF EXCEL ONLINE

Full Research Suite


$2000

$3500

$5000

Buy Report Now
Similar Industry Reports

Similar Industry Reports

European Quillaia Extract Market

Market Trends Driving Positive Growth in European Quillaia Extract Sales

European Union Cross-Border Healthcare Market

European Union Cross-Border Healthcare Market Analysis 2025 to 2035

Demand of MFGM-enriched Powders & RTDs in European Union

Demand of MFGM-enriched Powders & RTDs in European Union Size and Share Forecast Outlook 2025 to 2035

Industry Analysis of Syringe and Needle in GCC

Industry Analysis of Syringe and Needle in GCC Size and Share Forecast Outlook 2025 to 2035

Industry Analysis Non-commercial Acrylic Paint in the United States

Industry Analysis Non-commercial Acrylic Paint in the United States Size and Share Forecast Outlook 2025 to 2035

Industry Analysis of Medical Device Packaging in Southeast Asia

Industry Analysis of Medical Device Packaging in Southeast Asia Size and Share Forecast Outlook 2025 to 2035

Industry Analysis of Paper Bag in North America

Industry Analysis of Paper Bag in North America Size and Share Forecast Outlook 2025 to 2035

Industry Analysis of Lidding Film in the United States

Industry Analysis of Lidding Film in the United States Size and Share Forecast Outlook 2025 to 2035

Industry Analysis of Last-mile Delivery Software in Japan

Industry Analysis of Last-mile Delivery Software in Japan Size and Share Forecast Outlook 2025 to 2035

Industry Analysis of Automotive Lightweight Body Panel in the United States

Industry Analysis of Automotive Lightweight Body Panel in the United States Size and Share Forecast Outlook 2025 to 2035

Industry Analysis of Electronic Skin in Japan

Industry Analysis of Electronic Skin in Japan Size and Share Forecast Outlook 2025 to 2035

Industry Analysis of Electronic Skin in Korea

Industry Analysis of Electronic Skin in Korea Size and Share Forecast Outlook 2025 to 2035

Industry Analysis of Electronic Skin in Western Europe

Industry Analysis of Electronic Skin in Western Europe Size and Share Forecast Outlook 2025 to 2035

Industry 4.0 Market
Industry 4.0 Market

Industry 4.0 Market

Industry Analysis of Second-hand Apparel in Europe

Europe Second-hand Apparel Market Growth – Trends & Forecast 2024-2034

DOAS Industry Analysis in the United States

DOAS Industry Analysis in the United States Forecast and Outlook 2025 to 2035

FIBC Industry Analysis in Japan

FIBC Industry Analysis in Japan Size and Share Forecast Outlook 2025 to 2035

Pectin Industry Analysis in Japan

Pectin Industry Analysis in Japan Size and Share Forecast Outlook 2025 to 2035

Mezcal Industry Analysis in Japan

Mezcal Industry Analysis in Japan - Consumer Demand & Industry Trends in 2025

Mezcal Industry Analysis in Korea

Mezcal Industry Analysis in Korea – Trends, Demand & Industry Growth

Future Market Insights

European Union Tourism Industry

Chat With MaRIA

Chat With

MaRIA

Hi There, I am MaRIA, Your Market Research Intelligence Assistant. How may I help you?