Coconut Derived Surfactants Market Outlook and Forecast 2025 to 2035

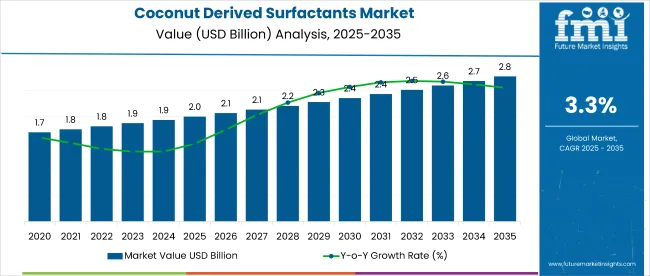
The global coconut derived surfactants market is valued at USD 2.0 billion in 2025 and is slated to reach USD 2.8 billion by 2035, reflecting a CAGR of 3.3%. Growth in the market is expected to be driven by increasing consumer demand for bio-based and environmentally friendly ingredients in cosmetic and detergent formulations.
Quick Stats Of Coconut Derived Surfactants Market

  • Market Value (2025): USD 2.0 billion
  • Forecast Value (2035): USD 2.8 billion
  • Forecast CAGR: 3.3%
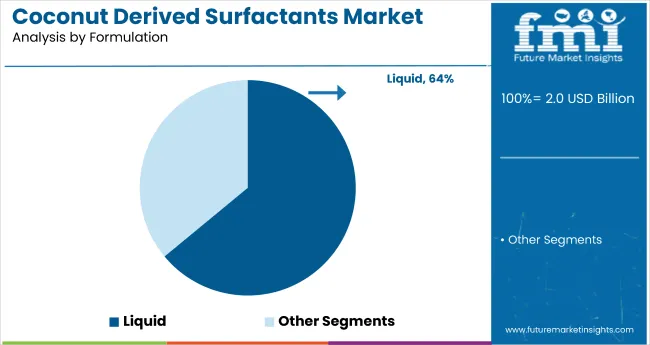
  • Formulation Leader in 2025: Liquid Formulations (64% Market Share)
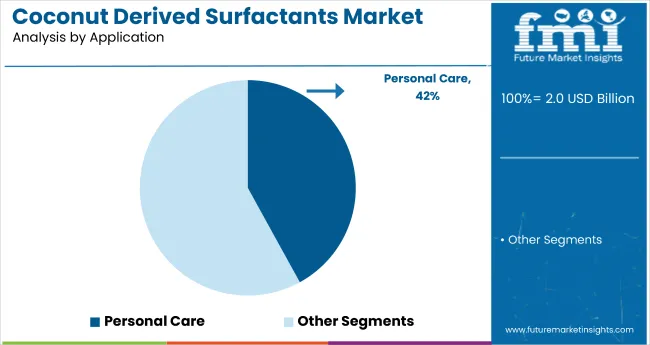
  • Top Application Segment: Personal Care (42% Market Share in 2025)
  • Key Growth Region: North America (USA is the fastest-growing market with 3.6% CAGR)

Coconut Derived Surfactants Market

Metric Value
Market Size (2025) USD 2.0 billion
Market Size (2035) USD 2.8 billion
CAGR (2025 to 2035) 3.3%

Expanding awareness about the harmful effects of conventional surfactants and the shift toward sustainable alternatives is also anticipated to boost market adoption. Government regulations promoting green chemistry are further likely to support industry expansion globally.

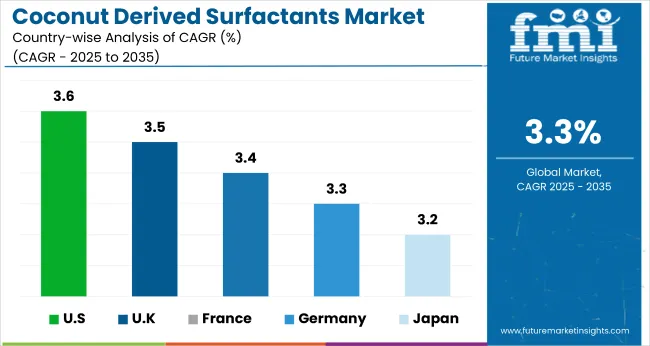
The USA leads the market among top countries, with a projected CAGR of 3.6% from 2025 to 2035, primarily due to growing consumer demand for clean-label, bio-based products and supportive regulations. The UK, following closely with a 3.5% CAGR, benefits from the popularity of sulfate-free and eco-friendly personal care formulations.

Germany shows strong growth at 3.4%, driven by the country’s focus on biodegradable ingredients and dermatology-friendly products. Liquid formulations will dominate the formulation segment with a 64% share in 2025, while personal care leads applications segment with a 42% share, driven by demand in cosmetics and skincare.

Recent innovations in the coconut derived surfactants market have been centered around green chemistry, sustainability, and enhanced performance. Companies like BASF and Evonik have introduced ultra-mild surfactant blends derived from coconut oil, targeting sensitive skin formulations in baby care and dermatological products.

Sironix Renewables, a start-up, has developed Eosix technology that uses renewable biomass to create high-performance, non-toxic surfactants. Additionally, advancements in enzymatic extraction and bio-fermentation processes are being adopted to increase yield and purity. These innovations are not only reducing environmental impact but also enhancing biodegradability, foaming efficiency, and skin compatibility across personal care and home care applications.

The market holds a modest but growing share within its parent markets. Within the global surfactants market, it accounts for approximately 5% to 7%, driven by rising demand for natural and biodegradable alternatives. In the broader bio-based chemicals market, its share is estimated at around 2% to 3%, reflecting its niche but expanding role.

In the personal care ingredients market, coconut-derived surfactants contribute nearly 4%, owing to their widespread use in shampoos, cleansers, and skincare products. As consumer preference shifts toward sustainable formulations, the market's share in these segments is expected to grow steadily over the forecast period.

Coconut Derived Surfactants Market Analysis by Top Investment Segments

The coconut derived surfactants market segments include application, formulation, and region. By application, the market covers household, detergent, personal care, food processing, agricultural chemicals, textiles, and institutional applications. By formulation, the market includes liquid, bar, and powdered forms. The regional segment comprises North America, Latin America, Western Europe, Eastern Europe, South Asia and Pacific, East Asia, and the Middle East & Africa.
Personal Care to Lead the Application Segment with 42% Market Share in 2025

Coconut Derived Surfactants Market Analysis By Application

The most lucrative segment in the market is personal care, accounting for the highest share in 2025 at 42%. This dominance is driven by the rising demand for natural, skin-friendly ingredients in shampoos, facial cleansers, body washes, and baby care products.
  • Increasing consumer awareness about chemical-free formulations and the growing popularity of organic cosmetics are further fueling this trend.
  • Major manufacturers are focusing on coconut-derived surfactants in personal care products due to their mildness, biodegradability, and strong foaming properties, making it the most profitable segment globally.

Liquid Formulations to Dominate the Formulation Segment with 64% Market Share in 2025

Coconut Derived Surfactants Market Analysis By Formulation

Liquid formulations are projected to be the most lucrative segment in the coconut-derived surfactants market, accounting for approximately 64% of the total market share in 2025.

  • This dominance is driven by their extensive application in shampoos, liquid soaps, facial cleansers, and household detergents. Their ease of formulation, superior solubility, and consistent performance make them the preferred choice for manufacturers and consumers alike.
  • As demand for sustainable and natural personal care products rises, liquid formats continue to gain traction across both developed and emerging markets, reinforcing their profitability and leading position in the overall coconut-derived surfactants industry.

Top Coconut Derived Surfactants Market Dynamics

The global coconut derived surfactants market is expanding steadily, driven by growing demand for natural and biodegradable surfactants, increasing preference for chemical-free personal care products, and advancements in green chemistry and bio-based formulation technologies.

Recent Trends in the Coconut Derived Surfactants Market
  • Growing use of sulfate-free and natural surfactants in premium personal care products.
  • Expansion of green surfactant portfolios by major manufacturers to meet clean-label demand.
  • Increased R&D investments in enzymatic and mild extraction processes for sustainability.
  • Rising incorporation of coconut surfactants in solid bar and waterless formulations.

Key Challenges in the Coconut Derived Surfactants Market

  • High cost of raw coconut oil compared to synthetic alternatives.
  • Limited supply chain reliability in major coconut-producing regions.
  • Lower foaming efficiency compared to traditional chemical surfactants.
  • Regulatory hurdles for natural claims in different countries.

Analyzing Top Countries Supplying and Utilizing Coconut Derived Surfactants

Coconut Derived Surfactants Market Cagr Analysis By Country

Among the top five countries, the USA leads the market with the highest projected CAGR of 3.6% from 2025 to 2035, driven by consumer demand for clean-label formulations and favorable bio-based regulations. The UK follows closely with a CAGR of 3.5%, fueled by sulfate-free product adoption.

Germany and France are expected to grow at 3.4% and 3.3% respectively, backed by their strong cosmetic and dermatology sectors. Japan holds the lowest projected CAGR of 3.2%, although it continues to innovate in hypoallergenic and eco-conscious formulations. Overall, steady growth is seen across mature markets prioritizing natural surfactant adoption.

The report covers an in-depth analysis of 40+ countries; five top-performing OECD countries are highlighted below. 
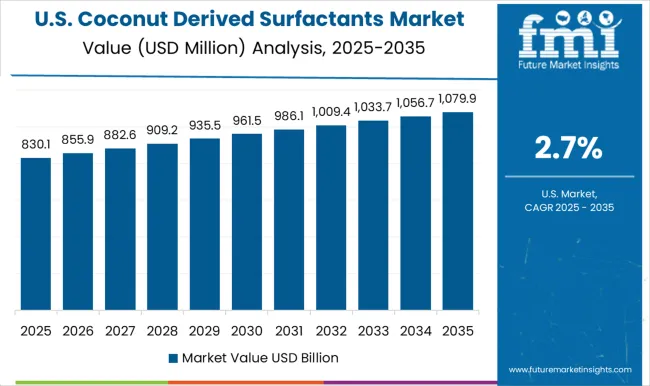
USA Coconut Derived Surfactants Analysis

The USA coconut derived surfactants market is projected to expand at a CAGR of 3.6% from 2025 to 2035. Market growth is being driven by rising consumer preference for clean-label personal care products and strong regulatory pressure to phase out synthetic surfactants.

  • Growing preference for chemical-free, skin-friendly personal care items.
  • Expansion of sustainable product lines by key players like Stepan Company.
  • Regulatory support for bio-based chemical adoption across states.
  • High consumption of liquid detergents and facial cleansers.

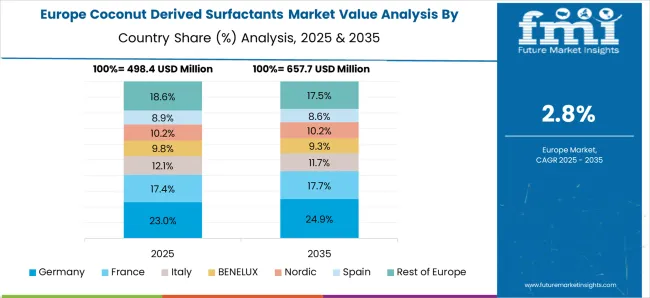
Coconut Derived Surfactants Demand Analysis in the UK

Sales of coconut-derived surfactants in the UK are anticipated to grow at a CAGR of 3.5% between 2025 and 2035. The growth is supported by consumer awareness regarding toxic ingredients and the rapid shift toward biodegradable formulations in the cosmetics and cleaning sectors.
  • Rising demand for sulfate-free and paraben-free beauty products.
  • Strategic focus on eco-label certifications and sustainable packaging.
  • Increased formulation of coconut-based surfactants in skincare.
  • Strong retail presence of organic and vegan-certified brands.

Coconut Derived Surfactants Demand Analysis in Germany

The Germany coconut derived surfactants revenue is projected to register a CAGR of 3.4% during the forecast period. The country remains a hub for natural ingredient sourcing and innovative product development.

  • High awareness of biodegradable and non-toxic ingredients.
  • Expanding use of coconut surfactants in baby care and dermatology.
  • Industry shift from petrochemical to plant-based surfactants.
  • Leadership in EU sustainability initiatives for green chemistry.

France Coconut Derived Surfactants Analysis

France coconut derived surfactants revenue is expected to grow at a CAGR of 3.3% in the market between 2025 and 2035. The market benefits from a sophisticated cosmetics industry, where demand for botanical and natural ingredients continues to rise. Increased R&D in natural emulsifiers and cleansers.

  • Growth in artisanal and eco-luxury cosmetic formulations.
  • Influence of ethical beauty trends on ingredient sourcing.
  • Expanding export of coconut-derived surfactant formulations.
  • Support from the French government for green supply chains.

Japan Coconut Derived Surfactants Analysis

The Japan coconut derived surfactants revenue is expected to expand at a CAGR of 3.2% from 2025 to 2035. Growth is driven by consumer trust in high-quality, natural formulations and the rising demand for hypoallergenic skincare.
  • Preference for ultra-mild cleansers and foaming agents.
  • Expansion of eco-conscious cosmetic and hair care brands.
  • Integration of coconut surfactants in baby and elderly care products.
  • Increasing product innovation by brands like Kao Corporation.

Leading Coconut Derived Surfactants Manufacturers and Suppliers

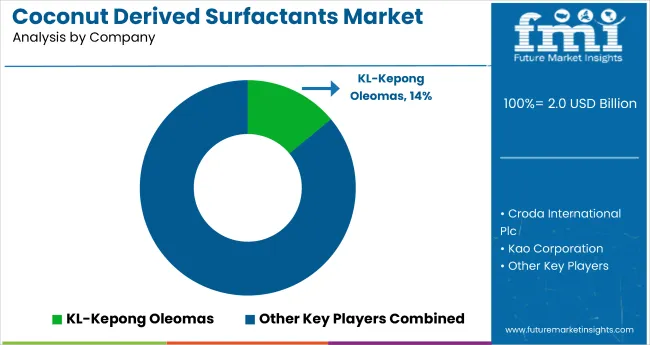
Coconut Derived Surfactants Market Analysis By Company

The market remains moderately fragmented, with both multinational corporations and regional players competing based on product innovation, pricing, sustainability, and regional expansion.

Top-tier companies such as BASF, Kao Corporation, Croda International, AkzoNobel, and The Dow Chemical Company dominate the global landscape through innovation in green chemistry, strategic acquisitions, and collaborations. These firms are heavily investing in R&D to develop high-performance, biodegradable surfactants derived from coconut oil. A major focus lies in replacing petrochemical-based ingredients in personal care and home care products with milder, sustainable alternatives.

Coconut Derived Surfactants Market Report Scope

Report Attributes Details
Current Total Market Size (2025) USD 2.0 billion
Projected Market Size (2035) USD 2.8 billion
CAGR (2025 to 2035) 3.3%
Base Year for Estimation 2024
Historical Period 2020 to 2024
Projections Period 2025 to 2035
Market Analysis Parameters Revenue in USD billions/Volume in Metric Tons
By Application Household, Detergent, Personal Care, Food Processing, Agricultural Chemicals, Textiles, Institutional Applications
By Formulations Liquid, Bar, Powdered
Regions Covered North America, Latin America, Western Europe, Eastern Europe, East Asia, South Asia & Pacific, Middle East & Africa
Countries Covered United States, Canada, United Kingdom, Germany, France, China, Japan, South Korea, Brazil, Australia, and 40+ countries
Key Players Haiquing Biotechnology, KL-Kepong Oleomas, Croda International, BASF, The Dow Chemical Company, AkzoNobel, 3M, Kao Corporation, F. Hoffmann-La Roche Ltd., Sysmex Corporation
Additional Attributes Dollar sales by value, market share analysis by region, and country-wise analysis.

Key Segments

By Application:

  • Household
  • Detergent
  • Personal Care
  • Food Processing
  • Agricultural Chemicals
  • Textiles
  • Institutional Applications

By Formulations:

  • Liquid
  • Bar
  • Powdered

By Region:

  • North America
  • Latin America
  • Asia Pacific
  • Middle East and Africa
  • Europe

Table of Content

  1. Executive Summary
    • Global Market Outlook
    • Demand-side Trends
    • Supply-side Trends
    • Technology Roadmap Analysis
    • Analysis and Recommendations
  2. Market Overview
    • Market Coverage / Taxonomy
    • Market Definition / Scope / Limitations
  3. Market Background
    • Market Dynamics
      • Drivers
      • Restraints
      • Opportunity
      • Trends
    • Scenario Forecast
      • Demand in Optimistic Scenario
      • Demand in Likely Scenario
      • Demand in Conservative Scenario
    • Opportunity Map Analysis
    • Product Life Cycle Analysis
    • Supply Chain Analysis
      • Supply Side Participants and their Roles
        • Producers
        • Mid-Level Participants (Traders/ Agents/ Brokers)
        • Wholesalers and Distributors
      • Value Added and Value Created at Node in the Supply Chain
      • List of Raw Material Suppliers
      • List of Existing and Potential Buyer’s
    • Investment Feasibility Matrix
    • Value Chain Analysis
      • Profit Margin Analysis
      • Wholesalers and Distributors
      • Retailers
    • PESTLE and Porter’s Analysis
    • Regulatory Landscape
      • By Key Regions
      • By Key Countries
    • Regional Parent Market Outlook
    • Production and Consumption Statistics
    • Import and Export Statistics
  4. Global Market Analysis 2020 to 2024 and Forecast, 2025 to 2035
    • Historical Market Size Value (USD Billion) & Volume (Metric Tons) Analysis, 2020 to 2024
    • Current and Future Market Size Value (USD Billion) & Volume (Metric Tons) Projections, 2025 to 2035
      • Y-o-Y Growth Trend Analysis
      • Absolute $ Opportunity Analysis
  5. Global Market Pricing Analysis 2020 to 2024 and Forecast 2025 to 2035
  6. Global Market Analysis 2020 to 2024 and Forecast 2025 to 2035, By Application
    • Introduction / Key Findings
    • Historical Market Size Value (USD Billion) & Volume (Metric Tons) Analysis By Application, 2020 to 2024
    • Current and Future Market Size Value (USD Billion) & Volume (Metric Tons) Analysis and Forecast By Application, 2025 to 2035
      • Household
      • Detergent
      • Personal Care
      • Food Processing
      • Agricultural Chemicals
      • Textiles
      • Institutional Applications
    • Y-o-Y Growth Trend Analysis By Application, 2020 to 2024
    • Absolute $ Opportunity Analysis By Application, 2025 to 2035
  7. Global Market Analysis 2020 to 2024 and Forecast 2025 to 2035, By Formulations
    • Introduction / Key Findings
    • Historical Market Size Value (USD Billion) & Volume (Metric Tons) Analysis By Formulations, 2020 to 2024
    • Current and Future Market Size Value (USD Billion) & Volume (Metric Tons) Analysis and Forecast By Formulations, 2025 to 2035
      • Liquid
      • Bar
      • Powdered
    • Y-o-Y Growth Trend Analysis By Formulations, 2020 to 2024
    • Absolute $ Opportunity Analysis By Formulations, 2025 to 2035
  8. Global Market Analysis 2020 to 2024 and Forecast 2025 to 2035, By Region
    • Introduction
    • Historical Market Size Value (USD Billion) & Volume (Metric Tons) Analysis By Region, 2020 to 2024
    • Current Market Size Value (USD Billion) & Volume (Metric Tons) Analysis and Forecast By Region, 2025 to 2035
      • North America
      • Latin America
      • Western Europe
      • Eastern Europe
      • East Asia
      • South Asia & Pacific
      • Middle East and Africa
    • Market Attractiveness Analysis By Region
  9. North America Market Analysis 2020 to 2024 and Forecast 2025 to 2035, By Country
    • Historical Market Size Value (USD Billion) & Volume (Metric Tons) Trend Analysis By Market Taxonomy, 2020 to 2024
    • Market Size Value (USD Billion) & Volume (Metric Tons) Forecast By Market Taxonomy, 2025 to 2035
      • By Country
        • USA
        • Canada
        • Mexico
      • By Application
      • By Formulations
    • Market Attractiveness Analysis
      • By Country
      • By Application
      • By Formulations
    • Key Takeaways
  10. Latin America Market Analysis 2020 to 2024 and Forecast 2025 to 2035, By Country
    • Historical Market Size Value (USD Billion) & Volume (Metric Tons) Trend Analysis By Market Taxonomy, 2020 to 2024
    • Market Size Value (USD Billion) & Volume (Metric Tons) Forecast By Market Taxonomy, 2025 to 2035
      • By Country
        • Brazil
        • Argentina
        • Rest of LATAM
      • By Application
      • By Formulations
    • Market Attractiveness Analysis
      • By Country
      • By Application
      • By Formulations
    • Key Takeaways
  11. Western Europe Market Analysis 2020 to 2024 and Forecast 2025 to 2035, By Country
    • Historical Market Size Value (USD Billion) & Volume (Metric Tons) Trend Analysis By Market Taxonomy, 2020 to 2024
    • Market Size Value (USD Billion) & Volume (Metric Tons) Forecast By Market Taxonomy, 2025 to 2035
      • By Country
        • Germany
        • Italy
        • France
        • UK
        • Spain
        • BENELUX
        • Nordica
        • Rest of W.Europe
      • By Application
      • By Formulations
    • Market Attractiveness Analysis
      • By Country
      • By Application
      • By Formulations
    • Key Takeaways
  12. Eastern Europe Market Analysis 2020 to 2024 and Forecast 2025 to 2035, By Country
    • Historical Market Size Value (USD Billion) & Volume (Metric Tons) Trend Analysis By Market Taxonomy, 2020 to 2024
    • Market Size Value (USD Billion) & Volume (Metric Tons) Forecast By Market Taxonomy, 2025 to 2035
      • By Country
        • Russia
        • Hungary
        • Poland
        • Balkan & Baltics
        • Rest of E. Europe
      • By Application
      • By Formulations
    • Market Attractiveness Analysis
      • By Country
      • By Application
      • By Formulations
    • Key Takeaways
  13. East Asia Market Analysis 2020 to 2024 and Forecast 2025 to 2035, By Country
    • Historical Market Size Value (USD Billion) & Volume (Metric Tons) Trend Analysis By Market Taxonomy, 2020 to 2024
    • Market Size Value (USD Billion) & Volume (Metric Tons) Forecast By Market Taxonomy, 2025 to 2035
      • By Country
        • China
        • Japan
        • South Korea
      • By Application
      • By Formulations
    • Market Attractiveness Analysis
      • By Country
      • By Application
      • By Formulations
    • Key Takeaways
  14. South Asia & Pacific Market Analysis 2020 to 2024 and Forecast 2025 to 2035, By Country
    • Historical Market Size Value (USD Billion) & Volume (Metric Tons) Trend Analysis By Market Taxonomy, 2020 to 2024
    • Market Size Value (USD Billion) & Volume (Metric Tons) Forecast By Market Taxonomy, 2025 to 2035
      • By Country
        • India
        • Australia & New Zealand
        • ASEAN
        • Rest of SAP
      • By Application
      • By Formulations
    • Market Attractiveness Analysis
      • By Country
      • By Application
      • By Formulations
    • Key Takeaways
  15. Middle East and Africa Market Analysis 2020 to 2024 and Forecast 2025 to 2035, By Country
    • Historical Market Size Value (USD Billion) & Volume (Metric Tons) Trend Analysis By Market Taxonomy, 2020 to 2024
    • Market Size Value (USD Billion) & Volume (Metric Tons) Forecast By Market Taxonomy, 2025 to 2035
      • By Country
        • GCC Countries
        • Northern Africa
        • South Africa
        • Turkiye
        • Rest of MEA
      • By Application
      • By Formulations
    • Market Attractiveness Analysis
      • By Country
      • By Application
      • By Formulations
    • Key Takeaways
  16. Key Countries Market Analysis
    • USA
      • Pricing Analysis
      • Market Share Analysis, 2024
        • By Application
        • By Formulations
    • Canada
      • Pricing Analysis
      • Market Share Analysis, 2024
        • By Application
        • By Formulations
    • Brazil
      • Pricing Analysis
      • Market Share Analysis, 2024
        • By Application
        • By Formulations
    • Mexico
      • Pricing Analysis
      • Market Share Analysis, 2024
        • By Application
        • By Formulations
    • Argentina
      • Pricing Analysis
      • Market Share Analysis, 2024
        • By Application
        • By Formulations
  17. Market Structure Analysis
    • Competition Dashboard
    • Competition Benchmarking
    • Market Share Analysis of Top Players
      • By Regional
      • By Application
      • By Formulations
  18. Competition Analysis
    • Competition Deep Dive
      • Haiquing Biotechnology
        • Overview
        • Product Portfolio
        • Profitability by Market Segments (Product/Age /Sales Channel/Region)
        • Sales Footprint
        • Strategy Overview
          • Marketing Strategy
          • Product Strategy
          • Channel Strategy
      • KL-Kepong Oleomas
        • Overview
        • Product Portfolio
        • Profitability by Market Segments (Product/Age /Sales Channel/Region)
        • Sales Footprint
        • Strategy Overview
          • Marketing Strategy
          • Product Strategy
          • Channel Strategy
      • Croda International
        • Overview
        • Product Portfolio
        • Profitability by Market Segments (Product/Age /Sales Channel/Region)
        • Sales Footprint
        • Strategy Overview
          • Marketing Strategy
          • Product Strategy
          • Channel Strategy
      • BASF
        • Overview
        • Product Portfolio
        • Profitability by Market Segments (Product/Age /Sales Channel/Region)
        • Sales Footprint
        • Strategy Overview
          • Marketing Strategy
          • Product Strategy
          • Channel Strategy
      • The Dow Chemical Company
        • Overview
        • Product Portfolio
        • Profitability by Market Segments (Product/Age /Sales Channel/Region)
        • Sales Footprint
        • Strategy Overview
          • Marketing Strategy
          • Product Strategy
          • Channel Strategy
      • AkzoNobel
        • Overview
        • Product Portfolio
        • Profitability by Market Segments (Product/Age /Sales Channel/Region)
        • Sales Footprint
        • Strategy Overview
          • Marketing Strategy
          • Product Strategy
          • Channel Strategy
      • 3M
        • Overview
        • Product Portfolio
        • Profitability by Market Segments (Product/Age /Sales Channel/Region)
        • Sales Footprint
        • Strategy Overview
          • Marketing Strategy
          • Product Strategy
          • Channel Strategy
      • Kao Corporation
        • Overview
        • Product Portfolio
        • Profitability by Market Segments (Product/Age /Sales Channel/Region)
        • Sales Footprint
        • Strategy Overview
          • Marketing Strategy
          • Product Strategy
          • Channel Strategy
      • F. Hoffmann-La Roche Ltd.
        • Overview
        • Product Portfolio
        • Profitability by Market Segments (Product/Age /Sales Channel/Region)
        • Sales Footprint
        • Strategy Overview
          • Marketing Strategy
          • Product Strategy
          • Channel Strategy
      • Sysmex Corporation
        • Overview
        • Product Portfolio
        • Profitability by Market Segments (Product/Age /Sales Channel/Region)
        • Sales Footprint
        • Strategy Overview
          • Marketing Strategy
          • Product Strategy
          • Channel Strategy
  19. Assumptions & Acronyms Used
  20. Research Methodology

List of Tables

  • Table 1: Global Market Value (USD Billion) Forecast by Region, 2020 to 2035
  • Table 2: Global Market Volume (Metric Tons) Forecast by Region, 2020 to 2035
  • Table 3: Global Market Value (USD Billion) Forecast by Application, 2020 to 2035
  • Table 4: Global Market Volume (Metric Tons) Forecast by Application, 2020 to 2035
  • Table 5: Global Market Value (USD Billion) Forecast by Formulations, 2020 to 2035
  • Table 6: Global Market Volume (Metric Tons) Forecast by Formulations, 2020 to 2035
  • Table 7: North America Market Value (USD Billion) Forecast by Country, 2020 to 2035
  • Table 8: North America Market Volume (Metric Tons) Forecast by Country, 2020 to 2035
  • Table 9: North America Market Value (USD Billion) Forecast by Application, 2020 to 2035
  • Table 10: North America Market Volume (Metric Tons) Forecast by Application, 2020 to 2035
  • Table 11: North America Market Value (USD Billion) Forecast by Formulations, 2020 to 2035
  • Table 12: North America Market Volume (Metric Tons) Forecast by Formulations, 2020 to 2035
  • Table 13: Latin America Market Value (USD Billion) Forecast by Country, 2020 to 2035
  • Table 14: Latin America Market Volume (Metric Tons) Forecast by Country, 2020 to 2035
  • Table 15: Latin America Market Value (USD Billion) Forecast by Application, 2020 to 2035
  • Table 16: Latin America Market Volume (Metric Tons) Forecast by Application, 2020 to 2035
  • Table 17: Latin America Market Value (USD Billion) Forecast by Formulations, 2020 to 2035
  • Table 18: Latin America Market Volume (Metric Tons) Forecast by Formulations, 2020 to 2035
  • Table 19: Western Europe Market Value (USD Billion) Forecast by Country, 2020 to 2035
  • Table 20: Western Europe Market Volume (Metric Tons) Forecast by Country, 2020 to 2035
  • Table 21: Western Europe Market Value (USD Billion) Forecast by Application, 2020 to 2035
  • Table 22: Western Europe Market Volume (Metric Tons) Forecast by Application, 2020 to 2035
  • Table 23: Western Europe Market Value (USD Billion) Forecast by Formulations, 2020 to 2035
  • Table 24: Western Europe Market Volume (Metric Tons) Forecast by Formulations, 2020 to 2035
  • Table 25: Eastern Europe Market Value (USD Billion) Forecast by Country, 2020 to 2035
  • Table 26: Eastern Europe Market Volume (Metric Tons) Forecast by Country, 2020 to 2035
  • Table 27: Eastern Europe Market Value (USD Billion) Forecast by Application, 2020 to 2035
  • Table 28: Eastern Europe Market Volume (Metric Tons) Forecast by Application, 2020 to 2035
  • Table 29: Eastern Europe Market Value (USD Billion) Forecast by Formulations, 2020 to 2035
  • Table 30: Eastern Europe Market Volume (Metric Tons) Forecast by Formulations, 2020 to 2035
  • Table 31: East Asia Market Value (USD Billion) Forecast by Country, 2020 to 2035
  • Table 32: East Asia Market Volume (Metric Tons) Forecast by Country, 2020 to 2035
  • Table 33: East Asia Market Value (USD Billion) Forecast by Application, 2020 to 2035
  • Table 34: East Asia Market Volume (Metric Tons) Forecast by Application, 2020 to 2035
  • Table 35: East Asia Market Value (USD Billion) Forecast by Formulations, 2020 to 2035
  • Table 36: East Asia Market Volume (Metric Tons) Forecast by Formulations, 2020 to 2035
  • Table 37: South Asia & Pacific Market Value (USD Billion) Forecast by Country, 2020 to 2035
  • Table 38: South Asia & Pacific Market Volume (Metric Tons) Forecast by Country, 2020 to 2035
  • Table 39: South Asia & Pacific Market Value (USD Billion) Forecast by Application, 2020 to 2035
  • Table 40: South Asia & Pacific Market Volume (Metric Tons) Forecast by Application, 2020 to 2035
  • Table 41: South Asia & Pacific Market Value (USD Billion) Forecast by Formulations, 2020 to 2035
  • Table 42: South Asia & Pacific Market Volume (Metric Tons) Forecast by Formulations, 2020 to 2035
  • Table 43: Middle East and Africa Market Value (USD Billion) Forecast by Country, 2020 to 2035
  • Table 44: Middle East and Africa Market Volume (Metric Tons) Forecast by Country, 2020 to 2035
  • Table 45: Middle East and Africa Market Value (USD Billion) Forecast by Application, 2020 to 2035
  • Table 46: Middle East and Africa Market Volume (Metric Tons) Forecast by Application, 2020 to 2035
  • Table 47: Middle East and Africa Market Value (USD Billion) Forecast by Formulations, 2020 to 2035
  • Table 48: Middle East and Africa Market Volume (Metric Tons) Forecast by Formulations, 2020 to 2035

List of Figures

  • Figure 1: Global Market Volume (Metric Tons) Forecast 2020 to 2035
  • Figure 2: Global Market Pricing Analysis
  • Figure 3: Global Market Value (USD Billion) Forecast 2020 to 2035
  • Figure 4: Global Market Value Share and BPS Analysis by Application, 2025 and 2035
  • Figure 5: Global Market Y-o-Y Growth Comparison by Application, 2025 to 2035
  • Figure 6: Global Market Attractiveness Analysis by Application
  • Figure 7: Global Market Value Share and BPS Analysis by Formulations, 2025 and 2035
  • Figure 8: Global Market Y-o-Y Growth Comparison by Formulations, 2025 to 2035
  • Figure 9: Global Market Attractiveness Analysis by Formulations
  • Figure 10: Global Market Value (USD Billion) Share and BPS Analysis by Region, 2025 and 2035
  • Figure 11: Global Market Y-o-Y Growth Comparison by Region, 2025 to 2035
  • Figure 12: Global Market Attractiveness Analysis by Region
  • Figure 13: North America Market Incremental $ Opportunity, 2025 to 2035
  • Figure 14: Latin America Market Incremental $ Opportunity, 2025 to 2035
  • Figure 15: Western Europe Market Incremental $ Opportunity, 2025 to 2035
  • Figure 16: Eastern Europe Market Incremental $ Opportunity, 2025 to 2035
  • Figure 17: East Asia Market Incremental $ Opportunity, 2025 to 2035
  • Figure 18: South Asia & Pacific Market Incremental $ Opportunity, 2025 to 2035
  • Figure 19: Middle East and Africa Market Incremental $ Opportunity, 2025 to 2035
  • Figure 20: North America Market Value Share and BPS Analysis by Country, 2025 and 2035
  • Figure 21: North America Market Value Share and BPS Analysis by Application, 2025 and 2035
  • Figure 22: North America Market Y-o-Y Growth Comparison by Application, 2025 to 2035
  • Figure 23: North America Market Attractiveness Analysis by Application
  • Figure 24: North America Market Value Share and BPS Analysis by Formulations, 2025 and 2035
  • Figure 25: North America Market Y-o-Y Growth Comparison by Formulations, 2025 to 2035
  • Figure 26: North America Market Attractiveness Analysis by Formulations
  • Figure 27: Latin America Market Value Share and BPS Analysis by Country, 2025 and 2035
  • Figure 28: Latin America Market Value Share and BPS Analysis by Application, 2025 and 2035
  • Figure 29: Latin America Market Y-o-Y Growth Comparison by Application, 2025 to 2035
  • Figure 30: Latin America Market Attractiveness Analysis by Application
  • Figure 31: Latin America Market Value Share and BPS Analysis by Formulations, 2025 and 2035
  • Figure 32: Latin America Market Y-o-Y Growth Comparison by Formulations, 2025 to 2035
  • Figure 33: Latin America Market Attractiveness Analysis by Formulations
  • Figure 34: Western Europe Market Value Share and BPS Analysis by Country, 2025 and 2035
  • Figure 35: Western Europe Market Value Share and BPS Analysis by Application, 2025 and 2035
  • Figure 36: Western Europe Market Y-o-Y Growth Comparison by Application, 2025 to 2035
  • Figure 37: Western Europe Market Attractiveness Analysis by Application
  • Figure 38: Western Europe Market Value Share and BPS Analysis by Formulations, 2025 and 2035
  • Figure 39: Western Europe Market Y-o-Y Growth Comparison by Formulations, 2025 to 2035
  • Figure 40: Western Europe Market Attractiveness Analysis by Formulations
  • Figure 41: Eastern Europe Market Value Share and BPS Analysis by Country, 2025 and 2035
  • Figure 42: Eastern Europe Market Value Share and BPS Analysis by Application, 2025 and 2035
  • Figure 43: Eastern Europe Market Y-o-Y Growth Comparison by Application, 2025 to 2035
  • Figure 44: Eastern Europe Market Attractiveness Analysis by Application
  • Figure 45: Eastern Europe Market Value Share and BPS Analysis by Formulations, 2025 and 2035
  • Figure 46: Eastern Europe Market Y-o-Y Growth Comparison by Formulations, 2025 to 2035
  • Figure 47: Eastern Europe Market Attractiveness Analysis by Formulations
  • Figure 48: East Asia Market Value Share and BPS Analysis by Country, 2025 and 2035
  • Figure 49: East Asia Market Value Share and BPS Analysis by Application, 2025 and 2035
  • Figure 50: East Asia Market Y-o-Y Growth Comparison by Application, 2025 to 2035
  • Figure 51: East Asia Market Attractiveness Analysis by Application
  • Figure 52: East Asia Market Value Share and BPS Analysis by Formulations, 2025 and 2035
  • Figure 53: East Asia Market Y-o-Y Growth Comparison by Formulations, 2025 to 2035
  • Figure 54: East Asia Market Attractiveness Analysis by Formulations
  • Figure 55: South Asia & Pacific Market Value Share and BPS Analysis by Country, 2025 and 2035
  • Figure 56: South Asia & Pacific Market Value Share and BPS Analysis by Application, 2025 and 2035
  • Figure 57: South Asia & Pacific Market Y-o-Y Growth Comparison by Application, 2025 to 2035
  • Figure 58: South Asia & Pacific Market Attractiveness Analysis by Application
  • Figure 59: South Asia & Pacific Market Value Share and BPS Analysis by Formulations, 2025 and 2035
  • Figure 60: South Asia & Pacific Market Y-o-Y Growth Comparison by Formulations, 2025 to 2035
  • Figure 61: South Asia & Pacific Market Attractiveness Analysis by Formulations
  • Figure 62: Middle East and Africa Market Value Share and BPS Analysis by Country, 2025 and 2035
  • Figure 63: Middle East and Africa Market Value Share and BPS Analysis by Application, 2025 and 2035
  • Figure 64: Middle East and Africa Market Y-o-Y Growth Comparison by Application, 2025 to 2035
  • Figure 65: Middle East and Africa Market Attractiveness Analysis by Application
  • Figure 66: Middle East and Africa Market Value Share and BPS Analysis by Formulations, 2025 and 2035
  • Figure 67: Middle East and Africa Market Y-o-Y Growth Comparison by Formulations, 2025 to 2035
  • Figure 68: Middle East and Africa Market Attractiveness Analysis by Formulations
  • Figure 69: Global Market - Tier Structure Analysis
  • Figure 70: Global Market - Company Share Analysis

Frequently Asked Questions

What is the projected size of the coconut derived surfactants market in 2025?

The market is valued at USD 2.0 billion in 2025.

What is the expected market size of coconut derived surfactants by 2035?

The market is forecasted to reach USD 2.8 billion by 2035.

What is the CAGR for coconut-derived surfactants market from 2025 to 2035?

The market is anticipated to expand at a CAGR of 3.3% during 2025 to 2035.

Which application segment dominates the coconut-derived surfactants market?

Personal care is projected to lead the application segment in 2025, accounting for 42% of the total market.

Which country is likely to be the most lucrative for coconut-derived surfactants?

USA is expected to remain the most lucrative with a CAGR at 3.6% during 2025 to 2035.

Explore Similar Insights

Future Market Insights

Coconut Derived Surfactants Market