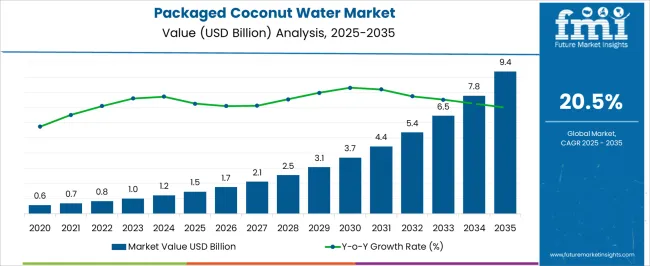
The Packaged Coconut Water Market is estimated to be valued at USD 1.5 billion in 2025 and is projected to reach USD 9.4 billion by 2035, registering a compound annual growth rate (CAGR) of 20.5% over the forecast period.

| Metric | Value |
|---|---|
| Packaged Coconut Water Market Estimated Value in (2025 E) | USD 1.5 billion |
| Packaged Coconut Water Market Forecast Value in (2035 F) | USD 9.4 billion |
| Forecast CAGR (2025 to 2035) | 20.5% |
The packaged coconut water market is expanding steadily as consumer preferences shift towards healthier and natural beverage options. Increasing awareness of organic products and a growing focus on wellness have driven demand, particularly in urban and health-conscious demographics. Sustainability concerns and convenience factors have influenced packaging innovations, allowing for longer shelf life and easier consumption.
Market dynamics reveal a preference for packaging solutions that maintain product freshness while enhancing portability. Future growth is expected to be supported by expanding distribution networks, especially in emerging markets, and by the introduction of value-added variants targeting diverse consumer needs.
Partnerships between producers and retailers are fostering better market penetration, while investments in supply chain efficiency contribute to cost optimization. These combined factors are creating favorable conditions for sustained market growth and product diversification.
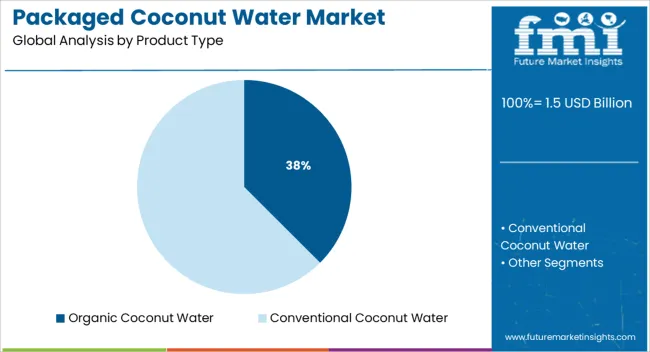
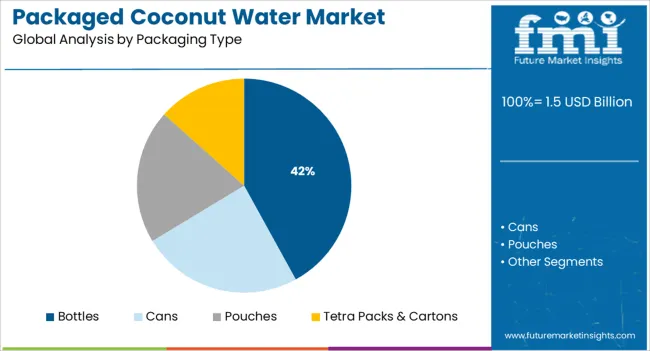
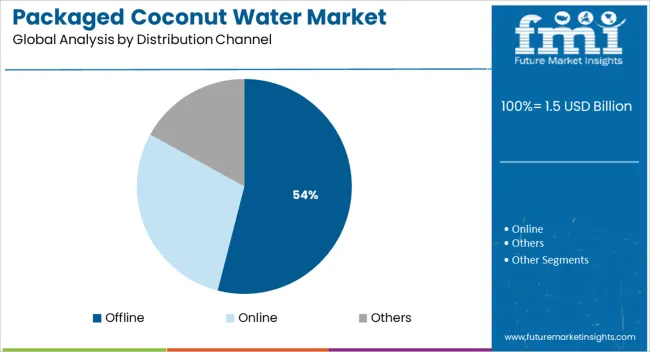
The market is segmented by Product Type, Packaging Type, and Distribution Channel and region. By Product Type, the market is divided into Organic Coconut Water and Conventional Coconut Water. In terms of Packaging Type, the market is classified into Bottles, Cans, Pouches, and Tetra Packs & Cartons. Based on Distribution Channel, the market is segmented into Offline, Online, and Others. Regionally, the market is classified into North America, Latin America, Western Europe, Eastern Europe, Balkan & Baltic Countries, Russia & Belarus, Central Asia, East Asia, South Asia & Pacific, and the Middle East & Africa.

The organic coconut water product type segment is anticipated to capture 37.5% of the total market revenue in 2025, establishing itself as a key growth driver. This segment’s leadership is attributed to increasing consumer preference for products perceived as natural and free from synthetic additives.
Demand has been propelled by heightened health awareness and preference for beverages aligned with wellness lifestyles. Retailers and manufacturers have been focusing on organic certification and transparent sourcing practices, enhancing consumer trust and willingness to pay a premium.
The segment’s growth is further enabled by regulatory encouragement for organic farming and clean-label products, which has facilitated broader market acceptance and penetration. These factors combined have reinforced organic coconut water as a preferred choice among discerning consumers.

Within packaging types, bottles are projected to hold 42.0% of the market revenue share in 2025, positioning them as the dominant packaging format. The leadership of bottled packaging is explained by its superior convenience, portability, and ability to maintain product freshness over longer periods.
Retail and consumer preferences for single-serve, ready-to-drink options have bolstered this segment’s growth. Packaging innovations focusing on sustainability, such as lightweight and recyclable bottles, have also contributed to increasing acceptance.
Bottled formats facilitate ease of distribution and merchandising across offline and online channels, providing a competitive edge. These advantages have collectively established bottles as the preferred packaging choice in the packaged coconut water market.

The offline distribution channel segment is expected to account for 54.0% of the market revenue in 2025, retaining its position as the leading distribution method. This prominence is driven by consumers’ continued reliance on supermarkets, convenience stores, and traditional retail outlets for purchasing beverages.
The widespread presence of offline retail networks provides extensive accessibility and visibility, making it easier for packaged coconut water brands to reach diverse consumer bases. Retailers’ investment in cold storage infrastructure and strategic shelf placements have supported impulse and planned purchases alike.
Although online sales are growing, offline remains the preferred channel for many consumers seeking immediate availability and product assurance. These factors have solidified the offline segment’s leadership in the distribution landscape.
Global demand for packaged coconut water is projected to be driven by the retail industry's rapid change and rising consumer knowledge of the beverage's health advantages. Essentially eaten as a cool beverage, packaged coconut water offers a number of health advantages.
The market for packaged coconut water is anticipated to be significantly driven by rising health concerns among consumers. Nowadays, consumers favor natural and organic items. Coconut water is the perfect replacement for high-calorie juices and fizzy beverages due to its many health advantages and low-calorie content.
To increase the product appeal and broaden the global client base for packaged coconut water, businesses are putting a lot of effort into the product's design and packaging.
The use of preservatives in packaged coconut water has been limited due to consumer desire for organic foods and the shortening of the product's shelf life. One of the main challenges impeding the market expansion for packaged coconut water is the higher prices of the product due to the convenient packaging and complicated processing techniques.
The market for packaged coconut water is expected to develop, but there are significant obstacles to that expansion, including the price volatility of coconut water and greater production costs. The primary obstacle to market expansion is thought to be the conflicting statements made during marketing.
The packaged coconut water manufacturers are attempting to provide packaged coconut water in a variety of flavors. The growing popularity of ready-to-go products, as well as expanding urbanization, is driving up demand for a variety of packaged products, which is expected to benefit the packaged coconut water market.
Health-related concerns are becoming more widely known, and doctors are increasingly recommending coconut water as a treatment for metabolic disorders like obesity, kidney stones, liver damage, hypertension, and other serious conditions.
These factors are creating lucrative opportunities for the market for packaged coconut water to expand. Additionally, packaged coconut water is being consumed and added to diverse diets by athletes and fitness enthusiasts.
Additionally, the expansion of social media is having a significant impact on a large population's desire for a healthy diet, which is anticipated to generate profitable prospects for the packaged coconut water market's overall growth during the projection period.
During the projected period, favorable government rules regarding coconut farming, rising investments to expand coconut cultivation, and rising labor costs for productive farming provide lucrative prospects for the market's overall expansion.
In the past, offline retailers anticipated higher demand for packaged coconut water because they catered to the major dietary needs of the urbanized population. In recent years, online retailers have outpaced demand and are providing discounts and making it convenient for potential customers, which is anticipated to spur the growth of the packaged coconut water market during the forecast period.
According to type, the pure coconut water segment led the global medical packaged coconut water market in 2025 and is predicted to continue to do so for the duration of the market's forecast period. The consumer's top concerns are fitness and health.
Nowadays, health-conscious consumers who are active prefer natural energy drink alternatives to ones that contain caffeine and sugar. Pure coconut water is becoming more and more well-liked as a natural sports beverage due to its nutritional characteristics, including its electrolytes and minerals.
The market for packaged coconut water worldwide is dominated by the traditional segment. Chemical fertilizers and insecticides are used in conventional coconut cultivation to promote healthy growth and production from the trees by warding off diseases and preventing pest infestations.
On a global scale, the packaged coconut water market, the tetra packs category, is growing at the fastest rate. One of the elements that contributed to this packaging's quick acceptance is its recyclable nature.
Additionally, only FSC-certified wood has been used by the producers in order to make it sustainable. Due to its paper-based packaging, which is also exceptionally easy to open and handle, it has a good environmental profile.
How is Japan Aiding Market Growth?
With the greatest market share for packaged coconut water over the projection period, Asia-Pacific dominated the industry. In several Asian countries, products made from coconut water are widely used in the food and beverage industries. With more people in the area becoming aware of coconut water as a sports or refreshment drink, the market is growing rapidly.
How Does India Support Market Expansion?
As consumers become more aware of the advantages of consuming healthy beverages, there has been a growth in the demand for coconut water on a global scale. Coconut water is a rich source of the minerals and antioxidants the body need.
Increased investments and pro-government legislation are driving the market for coconut agriculture. The market for packaged coconut water is also being helped by increased urbanisation and altering eating trends.
How is the Market Progressing in the USA?
The demand for packaged coconut water and other beverages derived from coconut has been rising in the past due to the rise of vegan and health-conscious consumers. These goods are often produced with coconut milk and water.
Milkshakes, energy drinks, and refreshment drinks, among other beverages, can be made by players using coconut water and milk with enhanced flavour and taste. Drinks can be flavoured with novel ingredients, leading to product innovation.
What is the state of the Canadian Market?
Food and beverage companies have been spending money on research and development to enhance the characteristics, flavour, or nutritional value of coconut products and food and beverage items that use coconut. This draws in additional clients by raising demand. Soon, more customers would join the new flavour and taste.
In contrast, Europe is anticipated to rise steadily and post a CAGR of 17.6% over the course of the projection period due to the region's high concentration of multinational corporations and rising demand for health beverages.
Is Germany the Top Consumer of Packaged Coconut Water?
The product launches are centred on the consumers' diverse palate preferences, and efforts are being made to naturally include tastes in packaged coconut water. These goods offer significant prospects for the commercial expansion of packaged coconut water.
During the projected period, lucrative opportunities for the market's overall growth are being presented by the implementation of pro-coconut farming government legislation, increasing investments to expand coconut cultivation and rising labour for efficient farming.
Why are Suppliers of Packaged Coconut Water Queuing Up in the UK?
As they met the primary dietary requirements of the urbanised population, offline retailers previously projected a stronger demand for packaged coconut water.
The rise of the packaged coconut water market is anticipated to be aided throughout the forecast period by online merchants, who have recently exceeded demand, and are offering discounts and making it convenient for potential customers.
Harmless Harvest
The company Harmless Harvest, which created the original fair-trade, organic, raw coconut water, is attempting to alter the status quo and surge the packaged coconut water market trends.
The business solely uses one type of coconut harvested in Thailand. It costs more since it's more difficult to grow and produces less coconut water than other types. However, according to the founders, it was the best-tasting coconut they could locate.
Although Vita Coco and other rivals dwarf Harmless Harvest, which had two employees in 2010 and now has about 300, the company is expanding swiftly. Due to the fact that Harmless Harvest only employs one variety of low-yield coconut and heavily invests in its relationships with farmers.
The company's creators think that if consumers exert enough pressure, the industry might change. They responded yes when asked if coconut farming could meet the rapidly increasing demand.
To raise their packaged coconut water market share, boost profitability, and maintain market competition, major companies in the market have employed product launches, company expansions, and mergers & acquisitions as key strategies.
Recent Development:
Product Launch
| Date | 2024 |
|---|---|
| Company | Vita COCO |
| Details | A sparkling variety of coconut water introduced by Vita COCO effectively displaced the region's sugar-heavy energy beverages. Later, the company introduced a variety of flavor pairings, including pineapple and passion fruit, lemon and lime, and a number of others. This product is appropriate for use in restaurants and bars as a drink. |
| Date | 2024 |
|---|---|
| Company | TAJA Coconut Company |
| Details | A non-GMO, sugar-free, and cold-filtered three-part coconut water product had been introduced by the TAJA coconut company. Despite the challenging extraction process, coconut water is prized for its superior purity. As a result, the finished item had a balanced flavor profile and a clear look. |
The global packaged coconut water market is estimated to be valued at USD 1.5 billion in 2025.
The market size for the packaged coconut water market is projected to reach USD 9.4 billion by 2035.
The packaged coconut water market is expected to grow at a 20.5% CAGR between 2025 and 2035.
The key product types in packaged coconut water market are organic coconut water and conventional coconut water.
In terms of packaging type, bottles segment to command 42.0% share in the packaged coconut water market in 2025.


Full Research Suite comprises of:
Market outlook & trends analysis
Interviews & case studies
Strategic recommendations
Vendor profiles & capabilities analysis
5-year forecasts
8 regions and 60+ country-level data splits
Market segment data splits
12 months of continuous data updates
DELIVERED AS:
PDF EXCEL ONLINE
Packaged Food Market Growth - Consumer Preferences & Industry Trends 2025 to 2035
Packaged Currants Market Analysis by Type, Sales Channel, and Region through 2035
Packaged Milkshake Market Analysis by Flavor, Packaging Material, and Region through 2035
Packaged Fresh Fruits Market Analysis by Berries, Citrus, Tropical Fruits, Stone Fruits, and Others Through 2035
Packaged Bread Market Trends - Shelf-Stable Bakery Innovations 2025 to 2035
Packaged Sunflower Seeds Market – Growth, Demand & Consumer Trends
Pre-Packaged Medical Supplies Market
Reduced Salt Packaged Foods Market - Health-Conscious Eating Trends 2025 to 2035
Carbon Labeled Packaged Meal Market Analysis - Size and Share Forecast Outlook 2025 to 2035
Coconut Derived Surfactants Market Size and Share Forecast Outlook 2025 to 2035
Coconut Oil Moisturizing Creams Market Analysis - Size, Share, and Forecast Outlook 2025 to 2035
Coconut Milk Powder Market Size and Share Forecast Outlook 2025 to 2035
Coconut Milk Products Market Trends – Size, Demand & Forecast 2025-2035
Coconut Milk Market Analysis – Size, Share & Forecast Outlook 2025 to 2035
Coconut Butter Market Analysis by End-use Application Sales Channel Through 2025 to 2035
Coconut Sugar Market By Form, Nature, Application and Region - Forecast from 2025 to 2035
Coconut Flour Market Analysis by End-Use, Application, Product Form, Technology, Nature, and Region from 2025 to 2035
Coconut Wraps Market Outlook – Growth, Demand & Forecast 2025 to 2035
Coconut Oil Market Insights - Growing Applications & Industry Expansion 2025 to 2035
Competitive Overview of Coconut Syrup Industry Share

Thank you!
You will receive an email from our Business Development Manager. Please be sure to check your SPAM/JUNK folder too.
Chat With
MaRIA