Reports

- Global Locations -

Headquarters

Future Market Insights, Inc.

Christiana Corporate, 200
Continental Drive, Suite 401,
Newark, Delaware - 19713,
United States

T: +1-845-579-5705

Americas

Future Market Insights, Inc.

616 Corporate Way, Suite 2-9018,
Valley Cottage, NY 10989, United States

T: +1-347-918-3531

MEA

Future Market Insights

1602-6 Jumeirah Bay X2 Tower, Plot No: JLT-PH2-X2A,
Jumeirah Lakes Towers, Dubai,
United Arab Emirates

Europe

Future Market Insights

3rd Floor, 207 Regent Street,
W1B 3HH London
United Kingdom

T: + 44 (0) 20 8123 9659
D: +44 (0) 20 3287 4268

Asia Pacific

Future Market Insights

IndiaLand Global Tech Park, Unit UG-1, Behind Grand HighStreet, Phase 1, Hinjawadi, MH, Pune – 411057, India

Natural Disaster Detection IoT Market Snapshot from 2024 to 2034

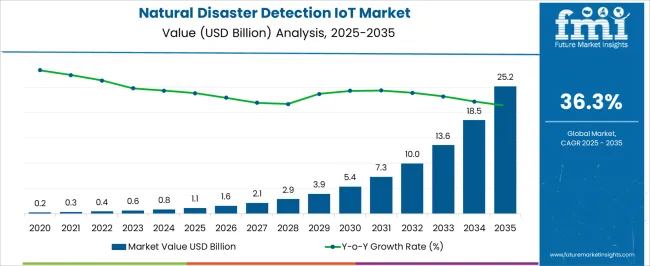
The natural disaster detection IoT market had an estimated market share worth US$ 600 million in 2023, and it is predicted to reach a global market valuation of US$ 18.5 billion by 2034, growing at a CAGR of 36.3% from 2024 to 2034.

Demand Analysis of Natural Disaster Detection IoT

Companies can advance with natural disaster detection IoT by:

  • Utilizing artificial intelligence algorithms to evaluate sensor data and produce forecasts that allow for early disaster risk identification and preemptive mitigation.
  • Enhancing data transfer and communication between IoT devices by leveraging innovative networking technology, guaranteeing smooth integration and rapid reaction times.
  • Putting in place cloud computing infrastructure to handle and store massive amounts of sensor data, allowing for scalable and affordable disaster recovery plans.
Report Attribute Details
Estimated Market Value in 2023 US$ 600 million
Expected Market Value in 2024 US$ 835.8 million
Projected Forecast Value in 2034 US$ 18.5 billion
Anticipated Growth Rate from 2024 to 2034 36.3%

Don't pay for what you don't need

Customize your report by selecting specific countries or regions and save 30%!

Natural Disaster Detection IoT Market Historical Analysis from 2019 to 2023 vs. Forecast Outlook from 2024 to 2034

The global demand for the natural disaster detection IoT market was estimated to reach a valuation of US$ 200 million in 2019, according to a report from Future Market Insights (FMI). From 2019 to 2023, the natural disaster detection IoT market experienced astounding growth, registering a CAGR of 41.4%.

Historical CAGR from 2019 to 2023 41.4%
Forecast CAGR from 2024 to 2034 36.3%

The increasing focus on preventive approaches to disaster management is another important driver. Governments and companies are prioritizing investments in modern technologies such as IoT in order to achieve early warning, fast reaction, and effective disaster mitigation.

This change from reactive to proactive approaches is driving the development of IoT solutions for natural disaster detection. The market for natural disaster detection IoT is expected to grow in the future due to these factors:

  • IoT sensors offer constant environmental condition monitoring, making it possible to identify changes in real time and respond quickly to developing emergency scenarios.
  • These systems enable quick decision-making and response actions from any location by enabling people to view data and get warnings remotely via mobile devices or online interfaces.
  • IoT solutions ensure flexibility and adaptation to changing demands since they can be readily scaled up or down to fit diverse geographic regions, from tiny towns to major urban areas.
  • IoT platforms can improve overall preparedness and response capabilities for disasters by integrating with existing technologies including emergency communication systems, weather forecasting tools, and geographic information systems (GIS).

Key Factors Driving the Natural Disaster Detection IoT Market

Proactive and Effective Disaster Detection Strategies to Enhance Market Growth

The growing frequency and intensity of natural disasters throughout the world is a major factor propelling the natural disaster detection IoT market. The need for IoT-based detection systems is fueled by governments, corporations, and communities investing in cutting-edge technological solutions for early detection, prediction, and mitigation as a result of this elevated risk perception.

The capability of IoT systems for detecting natural disasters to enable dynamic risk modeling is one of its distinctive features. These systems can produce dynamic risk models that adjust to shifting environmental conditions and offer precise insights into changing disaster scenarios by continuously gathering and analyzing real-time data from sensors. This allows for the improvement of preparedness and response efforts with previously unheard-of accuracy and effectiveness.

Sudip Saha
Sudip Saha

Principal Consultant

Talk to Analyst

Find your sweet spots for generating winning opportunities in this market.

Factors that can impede the Market Growth

High Initial Deployment Costs to Impede the Market Growth

The significant initial expenses associated with implementing and maintaining IoT infrastructure are a major barrier to adoption, especially for smaller businesses with tighter budgets.

Since sensitive data is sent and kept, concerns about data privacy and security impede trust and adoption. Compatibility problems caused by interoperability problems across various IoT systems impede smooth integration and the achievement of the technology's full potential.

Comparative View of Adjacent Markets

In this section, analysis will be drawn among three relevant markets. These are the natural disaster detection IoT market, disaster recovery-as-a-service market and internet of things (IoT) security product market.

The common drivers for the above mentioned markets are increased risk awareness, technical improvements, regulatory requirements, and the increasing frequency and severity of catastrophes. All of these elements work together to drive the market for innovative solutions and encourage the development of novel technologies that improve reaction, readiness, and resilience in a variety of industries.

Natural Disaster Detection IoT Market:

Market Name Natural Disaster Detection IoT Market
CAGR from 2024 to 2034 36.3%
Growth Factor Extreme weather events brought on by climate change are a major factor driving the global IoT market for natural disaster detection as they call for the use of cutting-edge technology for early detection and mitigation.
Future Opportunities Extreme weather events brought on by climate change are a major factor driving the global IoT market for natural disaster detection as they call for the use of cutting-edge technology for early detection and mitigation.

Disaster Recovery-as-a-Service Market:

Market Name Disaster Recovery-as-a-Service Market
CAGR from 2024 to 2034 24.8%
Growth Factor DRaaS solutions are extensively utilized in a variety of industries, including banking, financial services and insurance (BFSI), IT & communications, healthcare, and others, because of their affordability and flexibility.
Future Opportunities Technological developments in data storage and replication, together with the general growth of the communications industry, are making it possible for more businesses to obtain affordable resilience solutions for vital business operations.

Internet of Things (IoT) Security Product Market:

Market Name Internet of Things (IoT) Security Product Market
CAGR from 2024 to 2034 14.9%
Growth Factor The market is anticipated to grow as a result of the entry of new competitors and the increase in IoT security product launches. The sector is growing faster as a result of the growing number of service providers.
Future Opportunities It is projected that the smart grid market will expand at the fastest rate over the study period. The market is anticipated to grow as smart grid applications continue to be developed.

Get the data you need at a Fraction of the cost

Personalize your report by choosing insights you need
and save 40%!

Category wise Insights

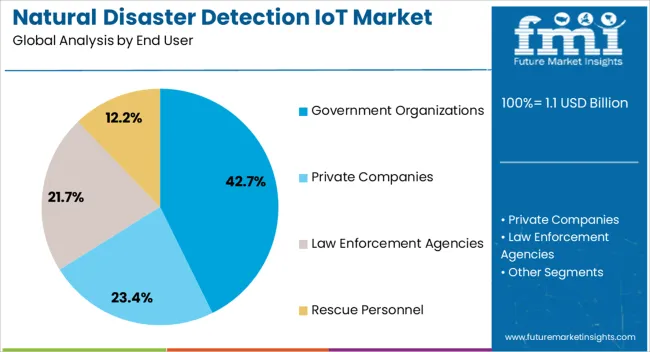
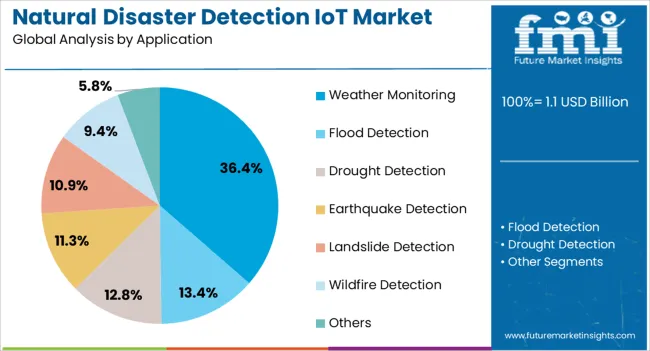
This section focuses on providing detailed analysis of two particular market segments for natural disaster detection IoT, the dominant end user and the significant application. The two main segments discussed below are the private companies and flood detection segments.

Private Companies to Deploy Natural Disaster Detection IoT on a Wide Scale

End User Private Companies
CAGR from 2024 to 2034 36.1%

During the forecast period, the private companies segment is forecast to expand with a 36.1% CAGR. IoT technologies for detecting natural disasters are being widely used by private companies for a number of reasons. By protecting staff, infrastructure, and corporate assets from the damaging effects of disasters, these technologies provide business continuity and reduce financial losses.

Companies may improve their image and gain the confidence of stakeholders by investing in these technologies as a way to show their dedication to Sustainability and community resilience. Progressive risk management is made possible by the predictive powers of IoT devices, which lowers long-term liabilities and insurance costs.

Flood Detection can be effectively done with the Aid of Natural Disaster Detection IoT

Application Flood Detection
CAGR from 2024 to 2034 35.8%

Through 2034, the flood detection segment is anticipated to register a 35.8% CAGR. Since this technology may give early warning signals and real-time monitoring, which are essential for reducing the destructive effects of floods, it is widely used for flood detection. IoT sensors have the ability to identify variations in water levels, which allows for early warnings to authorities and locals, enabling efficient resource allocation and evacuation.

Predictive modeling and advanced data analytics improve flood risk assessment, allowing for improved preparedness and response tactics that ultimately reduce property loss and save lives.

Region wise Analysis

This section will go into detail on the natural disaster detection IoT markets in a few key countries, including the United States, the United Kingdom, China, Japan and South Korea. This part will focus on the key factors that are driving up demand in these countries for natural disaster detection IoT.

Countries CAGR from 2024 to 2034
The United States 36.6%
The United Kingdom 37%
China 36.9%
Japan 37.6%
South Korea 38.1%

Large Scale Private Sector Investments in IoT Technology in the United States to Accelerate Demand

The United States natural disaster detection IoT ecosystem is anticipated to gain a CAGR of 36.6% through 2034. The United States is a center of technical innovation, notably in data analytics, artificial intelligence, and sensor technologies. Continuous improvements in these domains propel the development of increasingly complex and efficient IoT solutions for the detection and response to natural disasters, hence enhancing market expansion and competitiveness.

In addition to government funding, American private sector organizations, such as technology firms, insurers, and infrastructure developers, are investing more in IoT solutions for natural disaster detection. This investment is motivated by the realization that IoT technology has the ability to promote business continuity during natural catastrophes, lower damages, and improve risk management.

Public Safety Regulations in the United Kingdom to Accelerate Demand

The natural disaster detection IoT market in the United Kingdom is expected to expand with a 37% CAGR through 2034. The need for advanced IoT solutions for natural disaster identification and mitigation is being driven by increased knowledge of climate change and its possible effects on extreme weather occurrences. Increased investment in technology and innovation is prompted by this awareness in order to improve early warning systems and disaster resilience.

Strict laws and guidelines pertaining to emergency preparedness and public safety promote the usage of IoT-based detection devices in the United Kingdom. The market may rise as a result of government efforts and industry standards mandating the use of modern technologies for better monitoring and response to catastrophic events.

Infrastructure Development and Urbanization to Bolster Growth in China

The natural disaster detection IoT ecosystem in China is anticipated to develop with a 36.9% CAGR from 2024 to 2034. The emphasis of the Chinese government on disaster risk reduction and response approaches has boosted investment in IoT technologies for natural disaster detection.

Opportunities for the development and implementation of IoT solutions across the nation are created by policies targeted at improving early warning systems and disaster preparation.

The rapidly expanding infrastructure and urbanization in the country make its densely inhabited areas more susceptible to natural disasters. The market is expanding as a consequence of the rising need for sophisticated IoT-based detection systems to reduce hazards and enhance urban disaster response capabilities.
Preparedness of Japan towards Enhanced Disaster Management Systems to Accelerate Demand

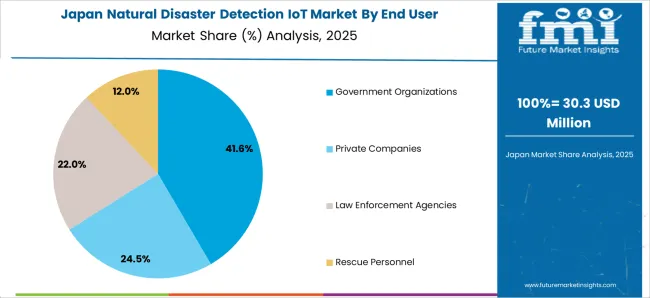
The natural disaster detection IoT industry in Japan is anticipated to reach a 37.6% CAGR from 2024 to 2034. Japan is well known for its advanced technology industry, which involves developing innovative IoT disaster detection systems. The acceptance and ongoing development of IoT-based early warning and disaster management systems are fueled by this innovation-focused approach.

Strong detection and warning systems are vital, as demonstrated by Japan's history of frequent and catastrophic natural catastrophes including typhoons, tsunamis, and earthquakes. The national proactive approach to disaster preparedness creates an atmosphere that is favorable for the growth and expansion of the IoT market for natural catastrophe detection.
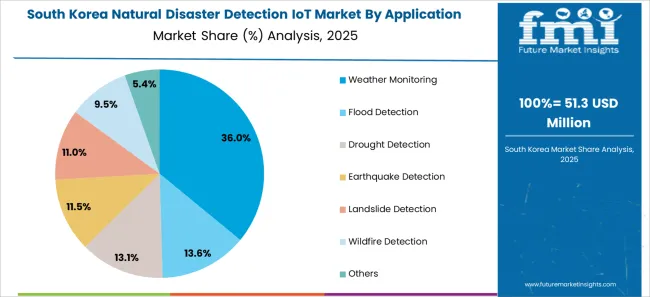
Vulnerability of South Korea towards natural Hazards to Enhance Demand

The natural disaster detection IoT ecosystem in South Korea is likely to evolve with a 38.1% CAGR during the forecast period. Adoption and progress of IoT technologies for natural disaster detection and management are driven by strong government support and investment in technology infrastructure and catastrophe resilience initiatives.

The susceptibility of the region to natural catastrophes like earthquakes, typhoons, and landslides necessitates the development of advanced IoT-based detection systems to increase early warning capabilities and lessen the effect of these occurrences.
Market Competition

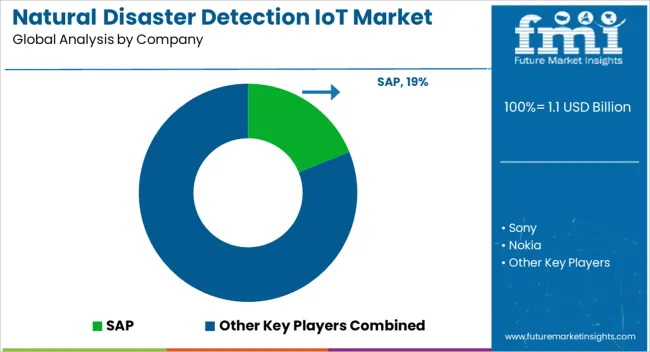
Key companies in the global natural disaster detection IoT market are actively involved in a number of strategic initiatives. Along with the development of sophisticated algorithms for real-time risk assessment as well as early warning systems, they place a high priority on the improvement of sensor technologies to maximize data collecting and processing.

While significant expenditures in research and development fuel innovation in disaster warning approaches, cooperative efforts with governments and non-governmental organizations are crucial to the implementation of IoT solutions in susceptible locations.

In order to support international disaster management efforts, these businesses are expanding their geographic presence to include additional disaster-prone areas and providing full-service solutions including data analytics and consulting. The key players in this market include:

  • SAP
  • Sony
  • Nokia
  • Blackberry
  • NEC Corporation
  • Intel
  • Venti LLC
  • One Concern
  • Sadeem Technology
  • OgoXe

Significant advancements in the natural disaster detection IoT market are being made by key market participants, and these include:

  • In 2023, Sony Corporation has announced the development of an immersive spatial content creation system that consists of two controllers that are optimized for precise pointing and intuitive interaction with 3D objects, as well as an XR head-mounted display that features high-quality 4K OLED Microdisplays*2 and a video see-through function. The technology is designed to assist content makers in producing complex 3D material.
  • Sony intends to work with companies in the entertainment and industrial design sectors that provide a range of 3D production software. Using software from the Siemens Xcelerator open digital business platform, Sony is launching a new solution for immersive design and collaborative product engineering in an exclusive partnership with Siemens, a leader in industrial technology.

Key Coverage in the Natural Disaster Detection IoT Market Report

  • IoT Based Disaster Detection and Early Warning Device
  • Wireless sensor networks for disaster detection market
  • IoT sensors for environmental monitoring market
  • Soaring Natural Disaster Detection IoT Market Growth
  • IoT-based disaster monitoring market
  • Sales of Natural Disaster Detection IoT

Report Scope

Report Attribute Details
Growth Rate CAGR of 36.3% from 2024 to 2034
Market value in 2024 US$ 835.8 million
Market value in 2034 US$ 18.5 billion
Base Year for Estimation 2023
Historical Data 2019 to 2023
Forecast Period 2024 to 2034
Quantitative Units US$ million/billion for value
Report Coverage Revenue Forecast, Company Ranking, Competitive Landscape, Growth Factors, Trends, and Pricing Analysis
Segments Covered
  • End User
  • Application
  • Region
Region Covered
  • North America
  • Latin America
  • Western Europe
  • Eastern Europe
  • South Asia and Pacific
  • East Asia
  • The Middle East & Africa
Countries Profiled
  • The United States
  • Canada
  • Brazil
  • Mexico
  • Germany
  • The United Kingdom
  • France
  • Spain
  • Italy
  • Poland
  • Russia
  • Czech Republic
  • Romania
  • India
  • Bangladesh
  • Australia
  • New Zealand
  • China
  • Japan
  • South Korea
  • GCC Countries
  • South Africa
  • Israel
Key Companies Profiled
  • SAP
  • Sony
  • Nokia
  • Blackberry
  • NEC Corporation
  • Intel
  • Venti LLC
  • One Concern
  • Sadeem Technology
  • OgoXe
Customization Scope Available on Request

Key Segments Profiled in the Natural Disaster Detection IoT Market

By End User:

  • Private Companies
  • Government Organizations
  • Law Enforcement Agencies
  • Rescue Personnel

By Application:

  • Flood Detection
  • Drought Detection
  • Earthquake Detection
  • Landslide Detection
  • Wildfire Detection
  • Weather Monitoring
  • Others

By Region:

  • North America
  • Latin America
  • Western Europe
  • Eastern Europe
  • South Asia and Pacific
  • East Asia
  • The Middle East & Africa

Frequently Asked Questions

What is the anticipated growth rate of the natural disaster detection IoT market from 2024 to 2034?

The natural disaster detection IoT market is expected to garner a 36.3% CAGR from 2024 to 2034.

What will be the global market outlook for natural disaster detection IoT through 2024?

By 2024, the global natural disaster detection IoT market is likely to gain US$ 835.8 million.

What is the expected global market valuation for natural disaster detection IoT by 2034?

By 2034, the natural disaster detection IoT market valuation is likely to reach a sum of US$ 18.5 billion.

How will the demand for natural disaster detection IoT develop in the United States?

The natural disaster detection IoT industry in the United States is likely to garner a 36.6% CAGR during the forecast period.

Which category of end users will be deploying natural disaster detection IoT systems on a wide scale?

The private companies are likely to greatly opt for natural disaster detection IoT, and garner a 36.1% CAGR through 2034.

What will the natural disaster detection IoT systems be highly used for?

The natural disaster detection IoT systems will be highly used for flood detection and garner a 35.8% CAGR through 2034.

Table of Content

1. Executive Summary

    1.1. Global Market Outlook

    1.2. Demand-side Trends

    1.3. Supply-side Trends

    1.4. Technology Roadmap Analysis

    1.5. Analysis and Recommendations

2. Market Overview

    2.1. Market Coverage / Taxonomy

    2.2. Market Definition / Scope / Limitations

3. Market Background

    3.1. Market Dynamics

        3.1.1. Drivers

        3.1.2. Restraints

        3.1.3. Opportunity

        3.1.4. Trends

    3.2. Scenario Forecast

        3.2.1. Demand in Optimistic Scenario

        3.2.2. Demand in Likely Scenario

        3.2.3. Demand in Conservative Scenario

    3.3. Opportunity Map Analysis

    3.4. Investment Feasibility Matrix

    3.5. PESTLE and Porter’s Analysis

    3.6. Regulatory Landscape

        3.6.1. By Key Regions

        3.6.2. By Key Countries

    3.7. Regional Parent Market Outlook

4. Global Market Analysis 2019 to 2023 and Forecast, 2024 to 2034

    4.1. Historical Market Size Value (US$ Million) Analysis, 2019 to 2023

    4.2. Current and Future Market Size Value (US$ Million) Projections, 2024 to 2034

        4.2.1. Y-o-Y Growth Trend Analysis

        4.2.2. Absolute $ Opportunity Analysis

5. Global Market Analysis 2019 to 2023 and Forecast 2024 to 2034, By End User

    5.1. Introduction / Key Findings

    5.2. Historical Market Size Value (US$ Million) Analysis By End User, 2019 to 2023

    5.3. Current and Future Market Size Value (US$ Million) Analysis and Forecast By End User, 2024 to 2034

        5.3.1. Private Companies

        5.3.2. Government Organizations

        5.3.3. Law Enforcement Agencies

        5.3.4. Rescue Personnel

    5.4. Y-o-Y Growth Trend Analysis By End User, 2019 to 2023

    5.5. Absolute $ Opportunity Analysis By End User, 2024 to 2034

6. Global Market Analysis 2019 to 2023 and Forecast 2024 to 2034, By Application

    6.1. Introduction / Key Findings

    6.2. Historical Market Size Value (US$ Million) Analysis By Application, 2019 to 2023

    6.3. Current and Future Market Size Value (US$ Million) Analysis and Forecast By Application, 2024 to 2034

        6.3.1. Flood Detection

        6.3.2. Drought Detection

        6.3.3. Earthquake Detection

        6.3.4. Landslide Detection

        6.3.5. Wildfire Detection

        6.3.6. Weather Monitoring

        6.3.7. Others

    6.4. Y-o-Y Growth Trend Analysis By Application, 2019 to 2023

    6.5. Absolute $ Opportunity Analysis By Application, 2024 to 2034

7. Global Market Analysis 2019 to 2023 and Forecast 2024 to 2034, By Region

    7.1. Introduction

    7.2. Historical Market Size Value (US$ Million) Analysis By Region, 2019 to 2023

    7.3. Current Market Size Value (US$ Million) Analysis and Forecast By Region, 2024 to 2034

        7.3.1. North America

        7.3.2. Latin America

        7.3.3. Western Europe

        7.3.4. Eastern Europe

        7.3.5. South Asia and Pacific

        7.3.6. East Asia

        7.3.7. Middle East and Africa

    7.4. Market Attractiveness Analysis By Region

8. North America Market Analysis 2019 to 2023 and Forecast 2024 to 2034, By Country

    8.1. Historical Market Size Value (US$ Million) Trend Analysis By Market Taxonomy, 2019 to 2023

    8.2. Market Size Value (US$ Million) Forecast By Market Taxonomy, 2024 to 2034

        8.2.1. By Country

            8.2.1.1. USA

            8.2.1.2. Canada

        8.2.2. By End User

        8.2.3. By Application

    8.3. Market Attractiveness Analysis

        8.3.1. By Country

        8.3.2. By End User

        8.3.3. By Application

    8.4. Key Takeaways

9. Latin America Market Analysis 2019 to 2023 and Forecast 2024 to 2034, By Country

    9.1. Historical Market Size Value (US$ Million) Trend Analysis By Market Taxonomy, 2019 to 2023

    9.2. Market Size Value (US$ Million) Forecast By Market Taxonomy, 2024 to 2034

        9.2.1. By Country

            9.2.1.1. Brazil

            9.2.1.2. Mexico

            9.2.1.3. Rest of Latin America

        9.2.2. By End User

        9.2.3. By Application

    9.3. Market Attractiveness Analysis

        9.3.1. By Country

        9.3.2. By End User

        9.3.3. By Application

    9.4. Key Takeaways

10. Western Europe Market Analysis 2019 to 2023 and Forecast 2024 to 2034, By Country

    10.1. Historical Market Size Value (US$ Million) Trend Analysis By Market Taxonomy, 2019 to 2023

    10.2. Market Size Value (US$ Million) Forecast By Market Taxonomy, 2024 to 2034

        10.2.1. By Country

            10.2.1.1. Germany

            10.2.1.2. UK

            10.2.1.3. France

            10.2.1.4. Spain

            10.2.1.5. Italy

            10.2.1.6. Rest of Western Europe

        10.2.2. By End User

        10.2.3. By Application

    10.3. Market Attractiveness Analysis

        10.3.1. By Country

        10.3.2. By End User

        10.3.3. By Application

    10.4. Key Takeaways

11. Eastern Europe Market Analysis 2019 to 2023 and Forecast 2024 to 2034, By Country

    11.1. Historical Market Size Value (US$ Million) Trend Analysis By Market Taxonomy, 2019 to 2023

    11.2. Market Size Value (US$ Million) Forecast By Market Taxonomy, 2024 to 2034

        11.2.1. By Country

            11.2.1.1. Poland

            11.2.1.2. Russia

            11.2.1.3. Czech Republic

            11.2.1.4. Romania

            11.2.1.5. Rest of Eastern Europe

        11.2.2. By End User

        11.2.3. By Application

    11.3. Market Attractiveness Analysis

        11.3.1. By Country

        11.3.2. By End User

        11.3.3. By Application

    11.4. Key Takeaways

12. South Asia and Pacific Market Analysis 2019 to 2023 and Forecast 2024 to 2034, By Country

    12.1. Historical Market Size Value (US$ Million) Trend Analysis By Market Taxonomy, 2019 to 2023

    12.2. Market Size Value (US$ Million) Forecast By Market Taxonomy, 2024 to 2034

        12.2.1. By Country

            12.2.1.1. India

            12.2.1.2. Bangladesh

            12.2.1.3. Australia

            12.2.1.4. New Zealand

            12.2.1.5. Rest of South Asia and Pacific

        12.2.2. By End User

        12.2.3. By Application

    12.3. Market Attractiveness Analysis

        12.3.1. By Country

        12.3.2. By End User

        12.3.3. By Application

    12.4. Key Takeaways

13. East Asia Market Analysis 2019 to 2023 and Forecast 2024 to 2034, By Country

    13.1. Historical Market Size Value (US$ Million) Trend Analysis By Market Taxonomy, 2019 to 2023

    13.2. Market Size Value (US$ Million) Forecast By Market Taxonomy, 2024 to 2034

        13.2.1. By Country

            13.2.1.1. China

            13.2.1.2. Japan

            13.2.1.3. South Korea

        13.2.2. By End User

        13.2.3. By Application

    13.3. Market Attractiveness Analysis

        13.3.1. By Country

        13.3.2. By End User

        13.3.3. By Application

    13.4. Key Takeaways

14. Middle East and Africa Market Analysis 2019 to 2023 and Forecast 2024 to 2034, By Country

    14.1. Historical Market Size Value (US$ Million) Trend Analysis By Market Taxonomy, 2019 to 2023

    14.2. Market Size Value (US$ Million) Forecast By Market Taxonomy, 2024 to 2034

        14.2.1. By Country

            14.2.1.1. GCC Countries

            14.2.1.2. South Africa

            14.2.1.3. Israel

            14.2.1.4. Rest of MEA

        14.2.2. By End User

        14.2.3. By Application

    14.3. Market Attractiveness Analysis

        14.3.1. By Country

        14.3.2. By End User

        14.3.3. By Application

    14.4. Key Takeaways

15. Key Countries Market Analysis

    15.1. USA

        15.1.1. Pricing Analysis

        15.1.2. Market Share Analysis, 2023

            15.1.2.1. By End User

            15.1.2.2. By Application

    15.2. Canada

        15.2.1. Pricing Analysis

        15.2.2. Market Share Analysis, 2023

            15.2.2.1. By End User

            15.2.2.2. By Application

    15.3. Brazil

        15.3.1. Pricing Analysis

        15.3.2. Market Share Analysis, 2023

            15.3.2.1. By End User

            15.3.2.2. By Application

    15.4. Mexico

        15.4.1. Pricing Analysis

        15.4.2. Market Share Analysis, 2023

            15.4.2.1. By End User

            15.4.2.2. By Application

    15.5. Germany

        15.5.1. Pricing Analysis

        15.5.2. Market Share Analysis, 2023

            15.5.2.1. By End User

            15.5.2.2. By Application

    15.6. UK

        15.6.1. Pricing Analysis

        15.6.2. Market Share Analysis, 2023

            15.6.2.1. By End User

            15.6.2.2. By Application

    15.7. France

        15.7.1. Pricing Analysis

        15.7.2. Market Share Analysis, 2023

            15.7.2.1. By End User

            15.7.2.2. By Application

    15.8. Spain

        15.8.1. Pricing Analysis

        15.8.2. Market Share Analysis, 2023

            15.8.2.1. By End User

            15.8.2.2. By Application

    15.9. Italy

        15.9.1. Pricing Analysis

        15.9.2. Market Share Analysis, 2023

            15.9.2.1. By End User

            15.9.2.2. By Application

    15.10. Poland

        15.10.1. Pricing Analysis

        15.10.2. Market Share Analysis, 2023

            15.10.2.1. By End User

            15.10.2.2. By Application

    15.11. Russia

        15.11.1. Pricing Analysis

        15.11.2. Market Share Analysis, 2023

            15.11.2.1. By End User

            15.11.2.2. By Application

    15.12. Czech Republic

        15.12.1. Pricing Analysis

        15.12.2. Market Share Analysis, 2023

            15.12.2.1. By End User

            15.12.2.2. By Application

    15.13. Romania

        15.13.1. Pricing Analysis

        15.13.2. Market Share Analysis, 2023

            15.13.2.1. By End User

            15.13.2.2. By Application

    15.14. India

        15.14.1. Pricing Analysis

        15.14.2. Market Share Analysis, 2023

            15.14.2.1. By End User

            15.14.2.2. By Application

    15.15. Bangladesh

        15.15.1. Pricing Analysis

        15.15.2. Market Share Analysis, 2023

            15.15.2.1. By End User

            15.15.2.2. By Application

    15.16. Australia

        15.16.1. Pricing Analysis

        15.16.2. Market Share Analysis, 2023

            15.16.2.1. By End User

            15.16.2.2. By Application

    15.17. New Zealand

        15.17.1. Pricing Analysis

        15.17.2. Market Share Analysis, 2023

            15.17.2.1. By End User

            15.17.2.2. By Application

    15.18. China

        15.18.1. Pricing Analysis

        15.18.2. Market Share Analysis, 2023

            15.18.2.1. By End User

            15.18.2.2. By Application

    15.19. Japan

        15.19.1. Pricing Analysis

        15.19.2. Market Share Analysis, 2023

            15.19.2.1. By End User

            15.19.2.2. By Application

    15.20. South Korea

        15.20.1. Pricing Analysis

        15.20.2. Market Share Analysis, 2023

            15.20.2.1. By End User

            15.20.2.2. By Application

    15.21. GCC Countries

        15.21.1. Pricing Analysis

        15.21.2. Market Share Analysis, 2023

            15.21.2.1. By End User

            15.21.2.2. By Application

    15.22. South Africa

        15.22.1. Pricing Analysis

        15.22.2. Market Share Analysis, 2023

            15.22.2.1. By End User

            15.22.2.2. By Application

    15.23. Israel

        15.23.1. Pricing Analysis

        15.23.2. Market Share Analysis, 2023

            15.23.2.1. By End User

            15.23.2.2. By Application

16. Market Structure Analysis

    16.1. Competition Dashboard

    16.2. Competition Benchmarking

    16.3. Market Share Analysis of Top Players

        16.3.1. By Regional

        16.3.2. By End User

        16.3.3. By Application

17. Competition Analysis

    17.1. Competition Deep Dive

        17.1.1. SAP

            17.1.1.1. Overview

            17.1.1.2. Product Portfolio

            17.1.1.3. Profitability by Market Segments

            17.1.1.4. Sales Footprint

            17.1.1.5. Strategy Overview

                17.1.1.5.1. Marketing Strategy

        17.1.2. Sony

            17.1.2.1. Overview

            17.1.2.2. Product Portfolio

            17.1.2.3. Profitability by Market Segments

            17.1.2.4. Sales Footprint

            17.1.2.5. Strategy Overview

                17.1.2.5.1. Marketing Strategy

        17.1.3. Nokia

            17.1.3.1. Overview

            17.1.3.2. Product Portfolio

            17.1.3.3. Profitability by Market Segments

            17.1.3.4. Sales Footprint

            17.1.3.5. Strategy Overview

                17.1.3.5.1. Marketing Strategy

        17.1.4. Blackberry

            17.1.4.1. Overview

            17.1.4.2. Product Portfolio

            17.1.4.3. Profitability by Market Segments

            17.1.4.4. Sales Footprint

            17.1.4.5. Strategy Overview

                17.1.4.5.1. Marketing Strategy

        17.1.5. NEC Corporation

            17.1.5.1. Overview

            17.1.5.2. Product Portfolio

            17.1.5.3. Profitability by Market Segments

            17.1.5.4. Sales Footprint

            17.1.5.5. Strategy Overview

                17.1.5.5.1. Marketing Strategy

        17.1.6. Intel

            17.1.6.1. Overview

            17.1.6.2. Product Portfolio

            17.1.6.3. Profitability by Market Segments

            17.1.6.4. Sales Footprint

            17.1.6.5. Strategy Overview

                17.1.6.5.1. Marketing Strategy

        17.1.7. Venti LLC

            17.1.7.1. Overview

            17.1.7.2. Product Portfolio

            17.1.7.3. Profitability by Market Segments

            17.1.7.4. Sales Footprint

            17.1.7.5. Strategy Overview

                17.1.7.5.1. Marketing Strategy

        17.1.8. One Concern

            17.1.8.1. Overview

            17.1.8.2. Product Portfolio

            17.1.8.3. Profitability by Market Segments

            17.1.8.4. Sales Footprint

            17.1.8.5. Strategy Overview

                17.1.8.5.1. Marketing Strategy

        17.1.9. Sadeem Technology

            17.1.9.1. Overview

            17.1.9.2. Product Portfolio

            17.1.9.3. Profitability by Market Segments

            17.1.9.4. Sales Footprint

            17.1.9.5. Strategy Overview

                17.1.9.5.1. Marketing Strategy

        17.1.10. OgoXe

            17.1.10.1. Overview

            17.1.10.2. Product Portfolio

            17.1.10.3. Profitability by Market Segments

            17.1.10.4. Sales Footprint

            17.1.10.5. Strategy Overview

                17.1.10.5.1. Marketing Strategy

18. Assumptions & Acronyms Used

19. Research Methodology

List of Tables

Table 1: Global Market Value (US$ Million) Forecast by Region, 2019 to 2034

Table 2: Global Market Value (US$ Million) Forecast by End User, 2019 to 2034

Table 3: Global Market Value (US$ Million) Forecast by Application, 2019 to 2034

Table 4: North America Market Value (US$ Million) Forecast by Country, 2019 to 2034

Table 5: North America Market Value (US$ Million) Forecast by End User, 2019 to 2034

Table 6: North America Market Value (US$ Million) Forecast by Application, 2019 to 2034

Table 7: Latin America Market Value (US$ Million) Forecast by Country, 2019 to 2034

Table 8: Latin America Market Value (US$ Million) Forecast by End User, 2019 to 2034

Table 9: Latin America Market Value (US$ Million) Forecast by Application, 2019 to 2034

Table 10: Western Europe Market Value (US$ Million) Forecast by Country, 2019 to 2034

Table 11: Western Europe Market Value (US$ Million) Forecast by End User, 2019 to 2034

Table 12: Western Europe Market Value (US$ Million) Forecast by Application, 2019 to 2034

Table 13: Eastern Europe Market Value (US$ Million) Forecast by Country, 2019 to 2034

Table 14: Eastern Europe Market Value (US$ Million) Forecast by End User, 2019 to 2034

Table 15: Eastern Europe Market Value (US$ Million) Forecast by Application, 2019 to 2034

Table 16: South Asia and Pacific Market Value (US$ Million) Forecast by Country, 2019 to 2034

Table 17: South Asia and Pacific Market Value (US$ Million) Forecast by End User, 2019 to 2034

Table 18: South Asia and Pacific Market Value (US$ Million) Forecast by Application, 2019 to 2034

Table 19: East Asia Market Value (US$ Million) Forecast by Country, 2019 to 2034

Table 20: East Asia Market Value (US$ Million) Forecast by End User, 2019 to 2034

Table 21: East Asia Market Value (US$ Million) Forecast by Application, 2019 to 2034

Table 22: Middle East and Africa Market Value (US$ Million) Forecast by Country, 2019 to 2034

Table 23: Middle East and Africa Market Value (US$ Million) Forecast by End User, 2019 to 2034

Table 24: Middle East and Africa Market Value (US$ Million) Forecast by Application, 2019 to 2034

List of Charts

Figure 1: Global Market Value (US$ Million) by End User, 2024 to 2034

Figure 2: Global Market Value (US$ Million) by Application, 2024 to 2034

Figure 3: Global Market Value (US$ Million) by Region, 2024 to 2034

Figure 4: Global Market Value (US$ Million) Analysis by Region, 2019 to 2034

Figure 5: Global Market Value Share (%) and BPS Analysis by Region, 2024 to 2034

Figure 6: Global Market Y-o-Y Growth (%) Projections by Region, 2024 to 2034

Figure 7: Global Market Value (US$ Million) Analysis by End User, 2019 to 2034

Figure 8: Global Market Value Share (%) and BPS Analysis by End User, 2024 to 2034

Figure 9: Global Market Y-o-Y Growth (%) Projections by End User, 2024 to 2034

Figure 10: Global Market Value (US$ Million) Analysis by Application, 2019 to 2034

Figure 11: Global Market Value Share (%) and BPS Analysis by Application, 2024 to 2034

Figure 12: Global Market Y-o-Y Growth (%) Projections by Application, 2024 to 2034

Figure 13: Global Market Attractiveness by End User, 2024 to 2034

Figure 14: Global Market Attractiveness by Application, 2024 to 2034

Figure 15: Global Market Attractiveness by Region, 2024 to 2034

Figure 16: North America Market Value (US$ Million) by End User, 2024 to 2034

Figure 17: North America Market Value (US$ Million) by Application, 2024 to 2034

Figure 18: North America Market Value (US$ Million) by Country, 2024 to 2034

Figure 19: North America Market Value (US$ Million) Analysis by Country, 2019 to 2034

Figure 20: North America Market Value Share (%) and BPS Analysis by Country, 2024 to 2034

Figure 21: North America Market Y-o-Y Growth (%) Projections by Country, 2024 to 2034

Figure 22: North America Market Value (US$ Million) Analysis by End User, 2019 to 2034

Figure 23: North America Market Value Share (%) and BPS Analysis by End User, 2024 to 2034

Figure 24: North America Market Y-o-Y Growth (%) Projections by End User, 2024 to 2034

Figure 25: North America Market Value (US$ Million) Analysis by Application, 2019 to 2034

Figure 26: North America Market Value Share (%) and BPS Analysis by Application, 2024 to 2034

Figure 27: North America Market Y-o-Y Growth (%) Projections by Application, 2024 to 2034

Figure 28: North America Market Attractiveness by End User, 2024 to 2034

Figure 29: North America Market Attractiveness by Application, 2024 to 2034

Figure 30: North America Market Attractiveness by Country, 2024 to 2034

Figure 31: Latin America Market Value (US$ Million) by End User, 2024 to 2034

Figure 32: Latin America Market Value (US$ Million) by Application, 2024 to 2034

Figure 33: Latin America Market Value (US$ Million) by Country, 2024 to 2034

Figure 34: Latin America Market Value (US$ Million) Analysis by Country, 2019 to 2034

Figure 35: Latin America Market Value Share (%) and BPS Analysis by Country, 2024 to 2034

Figure 36: Latin America Market Y-o-Y Growth (%) Projections by Country, 2024 to 2034

Figure 37: Latin America Market Value (US$ Million) Analysis by End User, 2019 to 2034

Figure 38: Latin America Market Value Share (%) and BPS Analysis by End User, 2024 to 2034

Figure 39: Latin America Market Y-o-Y Growth (%) Projections by End User, 2024 to 2034

Figure 40: Latin America Market Value (US$ Million) Analysis by Application, 2019 to 2034

Figure 41: Latin America Market Value Share (%) and BPS Analysis by Application, 2024 to 2034

Figure 42: Latin America Market Y-o-Y Growth (%) Projections by Application, 2024 to 2034

Figure 43: Latin America Market Attractiveness by End User, 2024 to 2034

Figure 44: Latin America Market Attractiveness by Application, 2024 to 2034

Figure 45: Latin America Market Attractiveness by Country, 2024 to 2034

Figure 46: Western Europe Market Value (US$ Million) by End User, 2024 to 2034

Figure 47: Western Europe Market Value (US$ Million) by Application, 2024 to 2034

Figure 48: Western Europe Market Value (US$ Million) by Country, 2024 to 2034

Figure 49: Western Europe Market Value (US$ Million) Analysis by Country, 2019 to 2034

Figure 50: Western Europe Market Value Share (%) and BPS Analysis by Country, 2024 to 2034

Figure 51: Western Europe Market Y-o-Y Growth (%) Projections by Country, 2024 to 2034

Figure 52: Western Europe Market Value (US$ Million) Analysis by End User, 2019 to 2034

Figure 53: Western Europe Market Value Share (%) and BPS Analysis by End User, 2024 to 2034

Figure 54: Western Europe Market Y-o-Y Growth (%) Projections by End User, 2024 to 2034

Figure 55: Western Europe Market Value (US$ Million) Analysis by Application, 2019 to 2034

Figure 56: Western Europe Market Value Share (%) and BPS Analysis by Application, 2024 to 2034

Figure 57: Western Europe Market Y-o-Y Growth (%) Projections by Application, 2024 to 2034

Figure 58: Western Europe Market Attractiveness by End User, 2024 to 2034

Figure 59: Western Europe Market Attractiveness by Application, 2024 to 2034

Figure 60: Western Europe Market Attractiveness by Country, 2024 to 2034

Figure 61: Eastern Europe Market Value (US$ Million) by End User, 2024 to 2034

Figure 62: Eastern Europe Market Value (US$ Million) by Application, 2024 to 2034

Figure 63: Eastern Europe Market Value (US$ Million) by Country, 2024 to 2034

Figure 64: Eastern Europe Market Value (US$ Million) Analysis by Country, 2019 to 2034

Figure 65: Eastern Europe Market Value Share (%) and BPS Analysis by Country, 2024 to 2034

Figure 66: Eastern Europe Market Y-o-Y Growth (%) Projections by Country, 2024 to 2034

Figure 67: Eastern Europe Market Value (US$ Million) Analysis by End User, 2019 to 2034

Figure 68: Eastern Europe Market Value Share (%) and BPS Analysis by End User, 2024 to 2034

Figure 69: Eastern Europe Market Y-o-Y Growth (%) Projections by End User, 2024 to 2034

Figure 70: Eastern Europe Market Value (US$ Million) Analysis by Application, 2019 to 2034

Figure 71: Eastern Europe Market Value Share (%) and BPS Analysis by Application, 2024 to 2034

Figure 72: Eastern Europe Market Y-o-Y Growth (%) Projections by Application, 2024 to 2034

Figure 73: Eastern Europe Market Attractiveness by End User, 2024 to 2034

Figure 74: Eastern Europe Market Attractiveness by Application, 2024 to 2034

Figure 75: Eastern Europe Market Attractiveness by Country, 2024 to 2034

Figure 76: South Asia and Pacific Market Value (US$ Million) by End User, 2024 to 2034

Figure 77: South Asia and Pacific Market Value (US$ Million) by Application, 2024 to 2034

Figure 78: South Asia and Pacific Market Value (US$ Million) by Country, 2024 to 2034

Figure 79: South Asia and Pacific Market Value (US$ Million) Analysis by Country, 2019 to 2034

Figure 80: South Asia and Pacific Market Value Share (%) and BPS Analysis by Country, 2024 to 2034

Figure 81: South Asia and Pacific Market Y-o-Y Growth (%) Projections by Country, 2024 to 2034

Figure 82: South Asia and Pacific Market Value (US$ Million) Analysis by End User, 2019 to 2034

Figure 83: South Asia and Pacific Market Value Share (%) and BPS Analysis by End User, 2024 to 2034

Figure 84: South Asia and Pacific Market Y-o-Y Growth (%) Projections by End User, 2024 to 2034

Figure 85: South Asia and Pacific Market Value (US$ Million) Analysis by Application, 2019 to 2034

Figure 86: South Asia and Pacific Market Value Share (%) and BPS Analysis by Application, 2024 to 2034

Figure 87: South Asia and Pacific Market Y-o-Y Growth (%) Projections by Application, 2024 to 2034

Figure 88: South Asia and Pacific Market Attractiveness by End User, 2024 to 2034

Figure 89: South Asia and Pacific Market Attractiveness by Application, 2024 to 2034

Figure 90: South Asia and Pacific Market Attractiveness by Country, 2024 to 2034

Figure 91: East Asia Market Value (US$ Million) by End User, 2024 to 2034

Figure 92: East Asia Market Value (US$ Million) by Application, 2024 to 2034

Figure 93: East Asia Market Value (US$ Million) by Country, 2024 to 2034

Figure 94: East Asia Market Value (US$ Million) Analysis by Country, 2019 to 2034

Figure 95: East Asia Market Value Share (%) and BPS Analysis by Country, 2024 to 2034

Figure 96: East Asia Market Y-o-Y Growth (%) Projections by Country, 2024 to 2034

Figure 97: East Asia Market Value (US$ Million) Analysis by End User, 2019 to 2034

Figure 98: East Asia Market Value Share (%) and BPS Analysis by End User, 2024 to 2034

Figure 99: East Asia Market Y-o-Y Growth (%) Projections by End User, 2024 to 2034

Figure 100: East Asia Market Value (US$ Million) Analysis by Application, 2019 to 2034

Figure 101: East Asia Market Value Share (%) and BPS Analysis by Application, 2024 to 2034

Figure 102: East Asia Market Y-o-Y Growth (%) Projections by Application, 2024 to 2034

Figure 103: East Asia Market Attractiveness by End User, 2024 to 2034

Figure 104: East Asia Market Attractiveness by Application, 2024 to 2034

Figure 105: East Asia Market Attractiveness by Country, 2024 to 2034

Figure 106: Middle East and Africa Market Value (US$ Million) by End User, 2024 to 2034

Figure 107: Middle East and Africa Market Value (US$ Million) by Application, 2024 to 2034

Figure 108: Middle East and Africa Market Value (US$ Million) by Country, 2024 to 2034

Figure 109: Middle East and Africa Market Value (US$ Million) Analysis by Country, 2019 to 2034

Figure 110: Middle East and Africa Market Value Share (%) and BPS Analysis by Country, 2024 to 2034

Figure 111: Middle East and Africa Market Y-o-Y Growth (%) Projections by Country, 2024 to 2034

Figure 112: Middle East and Africa Market Value (US$ Million) Analysis by End User, 2019 to 2034

Figure 113: Middle East and Africa Market Value Share (%) and BPS Analysis by End User, 2024 to 2034

Figure 114: Middle East and Africa Market Y-o-Y Growth (%) Projections by End User, 2024 to 2034

Figure 115: Middle East and Africa Market Value (US$ Million) Analysis by Application, 2019 to 2034

Figure 116: Middle East and Africa Market Value Share (%) and BPS Analysis by Application, 2024 to 2034

Figure 117: Middle East and Africa Market Y-o-Y Growth (%) Projections by Application, 2024 to 2034

Figure 118: Middle East and Africa Market Attractiveness by End User, 2024 to 2034

Figure 119: Middle East and Africa Market Attractiveness by Application, 2024 to 2034

Figure 120: Middle East and Africa Market Attractiveness by Country, 2024 to 2034

Recommendations

Technology

Disaster Recovery-as-a-Service Market

Published : April 2024

Industrial Automation

Terrain Awareness and Warning System Market

Published : June 2023

Industrial Automation

Airborne Warning and Control System Market

Published : November 2022

Technology

Internet of Things (IoT) Security Product Market

Published : July 2017

Explore Technology Insights

View Reports

Natural Disaster Detection IoT Market