The cigarette butt market is expanding steadily due to increasing global cigarette consumption and the growing focus on waste management and environmental recycling. Market dynamics are being influenced by the widespread use of filter-tipped cigarettes, urbanization trends, and the need for cost-effective and biodegradable materials.
Current demand is supported by consistent production volumes across major tobacco-producing regions, while regulatory attention toward cigarette litter management is prompting innovation in eco-friendly disposal and recycling processes. The future outlook indicates gradual adoption of sustainable materials in filter design, supported by collaboration between tobacco manufacturers and environmental solution providers.
Growth rationale is driven by the dominance of disposable products, high usage of standard cigarettes, and extensive reliance on acetate cellulose fiber as the primary material for filters Ongoing research in biodegradable alternatives and waste repurposing technologies is expected to enhance sustainability profiles and maintain the market’s relevance across the global tobacco supply chain.
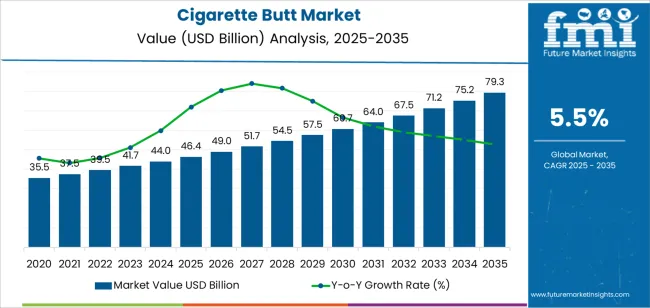
| Metric | Value |
|---|---|
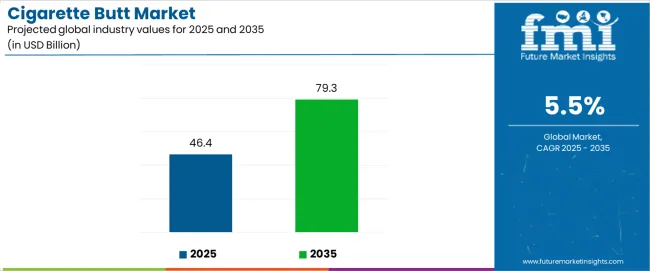
| Cigarette Butt Market Estimated Value in (2025 E) | USD 46.4 billion |
| Cigarette Butt Market Forecast Value in (2035 F) | USD 79.3 billion |
| Forecast CAGR (2025 to 2035) | 5.5% |
The market is segmented by Product, Application, and Material and region. By Product, the market is divided into Disposable and Reusable. In terms of Application, the market is classified into Standard Cigarette and E-Cigarettes. Based on Material, the market is segmented into Acetate Cellulose Fiber and Plastic. Regionally, the market is classified into North America, Latin America, Western Europe, Eastern Europe, Balkan & Baltic Countries, Russia & Belarus, Central Asia, East Asia, South Asia & Pacific, and the Middle East & Africa.
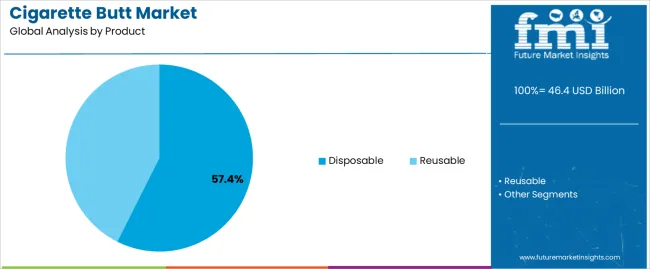
The disposable segment, holding 57.40% of the product category, has been leading the cigarette butt market due to the widespread use of single-use cigarette filters in mass-produced tobacco products. Its dominance is supported by manufacturing efficiency, affordability, and ease of disposal in large-scale cigarette production.
Market preference for disposable filters remains strong as they align with consumer convenience and standardized production processes. Regulatory developments addressing litter management are prompting innovation in biodegradable versions, but conventional disposable filters continue to capture the majority share.
The segment’s growth is further reinforced by stable demand from major tobacco brands and consistent raw material availability, ensuring ongoing production scalability and cost optimization across key regions.
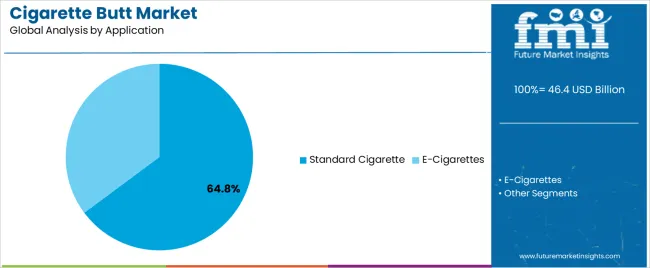
The standard cigarette segment, representing 64.80% of the application category, dominates the market owing to the high prevalence of conventional cigarette consumption worldwide. This segment benefits from standardized manufacturing processes, strong distribution networks, and brand-driven loyalty within the global tobacco industry.
Its continued growth is supported by large-scale demand in developing economies, where smoking rates remain elevated. Technological enhancements in filter performance and product uniformity are sustaining manufacturer preference for standard formats.
Despite regulatory pressures encouraging reduced smoking, market stability is being maintained through premiumization and diversification within traditional cigarette offerings The segment’s scale and production consistency are expected to preserve its leadership position within the market over the forecast period.
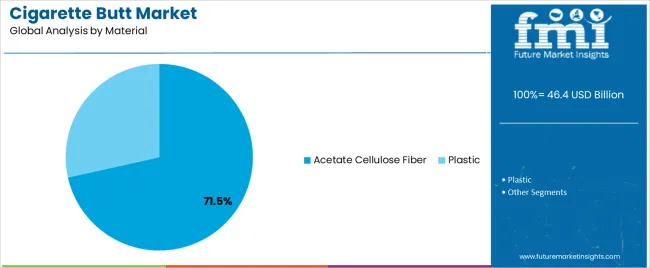
The acetate cellulose fiber segment, accounting for 71.50% of the material category, has retained dominance due to its established performance characteristics, cost efficiency, and compatibility with high-speed cigarette manufacturing lines. Its widespread usage is attributed to its effective filtration capability and adaptability in shaping and bonding processes.
Despite environmental concerns over slow biodegradability, acetate cellulose fiber remains the preferred material for filter production due to its stability, comfort, and reliable supply chain availability. Research initiatives aimed at developing modified or biodegradable acetate-based fibers are reinforcing its long-term market position.
Continuous investment in recycling technology and sustainable material alternatives is expected to complement, rather than replace, acetate cellulose fiber’s role in the market, ensuring its sustained share within the global cigarette butt production landscape.
Many businesses are incorporating environmental sustainability into their corporate social responsibility initiatives. Supporting programs and technologies aimed at reducing cigarette butt litter can enhance the reputation of a company and contribute to positive social and environmental outcomes.
The scope for cigarette butt rose at a 4.9% CAGR between 2020 and 2025. The global market is anticipated to grow at a moderate CAGR of 5.5% over the forecast period 2025 to 2035.
Increasing environmental awareness led to greater recognition of the harmful effects of cigarette butt litter on ecosystems and public health, during the historical period. Governments worldwide implemented stricter regulations and fines for improper cigarette butt disposal, driving demand for innovative waste management solutions.
Advancements in waste management technologies, such as smart bins and recycling processes, improved efficiency and effectiveness in handling cigarette butt waste. Changing consumer attitudes towards sustainability and environmental responsibility influenced purchasing decisions, encouraging the adoption of eco-friendly cigarette disposal methods.
Innovations in waste management technologies and materials are expected to drive the development of more efficient and sustainable solutions for cigarette butt collection, recycling, and disposal, during the forecast period. Increased international cooperation and standardization efforts could facilitate knowledge sharing and best practices in cigarette butt waste management across different regions and markets.
Governments are anticipated to introduce additional measures to combat cigarette butt litter, such as implementing deposit refund systems or launching public awareness campaigns, creating opportunities for businesses in the waste management sector.
Increasing awareness about the environmental impact of cigarette butt litter is driving demand for solutions to address this issue. Cigarette butts are a significant source of pollution, containing harmful chemicals that can leach into soil and waterways.
Increasingly strict regulations governing tobacco consumption and waste disposal could pose challenges for the cigarette butt market. Governments may impose higher taxes, bans on smoking in public places, and fines for littering, discouraging cigarette consumption and leading to reduced demand for related products.
The below table showcases revenues in terms of the top 5 leading countries, spearheaded by India and China. The countries are expected to lead the market through 2035.
| Countries | Forecast CAGRs from 2025 to 2035 |
|---|---|
| The United States | 4.9% |
| The United Kingdom | 3.7% |
| China | 6.4% |
| Japan | 5.9% |
| India | 6.7% |
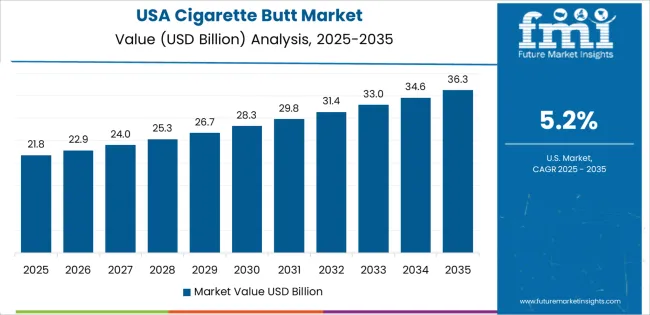
The cigarette butt market in the United States expected to expand at a CAGR of 4.9% through 2035. The United States has a large population, and despite declining smoking rates, there remains a significant number of smokers in the country. The sheer size of the smoker population contributes to the volume of cigarette butt waste generated.
Stricter regulations and policies regarding cigarette butt disposal and environmental protection can drive the demand for innovative solutions in the country. Local ordinances and state regulations may impose fines for littering, encouraging smokers to adopt responsible disposal practices and prompting investment in waste management infrastructure.
The cigarette butt market in the United Kingdom is anticipated to expand at a CAGR of 3.7% through 2035. Despite declining smoking rates, there remains a significant number of smokers in the United Kingdom. The prevalence of smoking contributes to the demand for cigarettes and, consequently, the generation of cigarette butt waste.
The country is highly urbanized, with dense population centers in cities and metropolitan areas. Urbanization increases the concentration of smokers and the volume of cigarette butt litter in public spaces, driving the need for effective waste management solutions.
Cigarette butt trends in China are taking a turn for the better. A 6.4% CAGR is forecast for the country from 2025 to 2035. China has one of the largest populations of smokers in the world, with millions of people regularly consuming tobacco products. The sheer size of the smoking population contributes to the demand for cigarettes and, consequently, the generation of cigarette butt waste.
Smoking is deeply ingrained in Chinese culture and social traditions. It is widely accepted in many social settings and is often associated with socializing, business interactions, and ceremonial occasions, contributing to sustained demand for tobacco products.
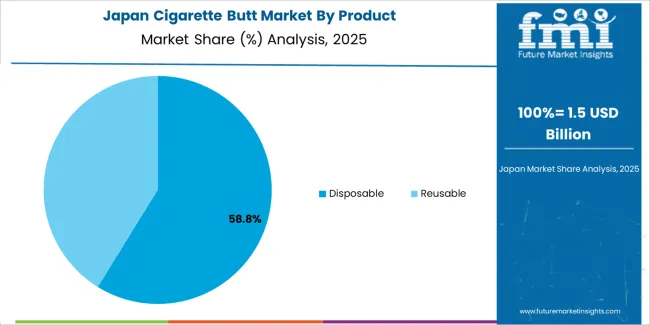
The cigarette butt market in Japan is poised to expand at a CAGR of 5.9% through 2035. Japan is known for its advanced technologies and innovations across various industries, including waste management. Companies and research institutions develop cutting edge technologies for cigarette butt collection, recycling, and disposal, leveraging advancements in recycling processes, biodegradable materials, and sustainable packaging.
Public health campaigns and smoking cessation programs in Japan aim to reduce tobacco consumption and promote healthier lifestyles. While these efforts may lead to a decline in cigarette sales, they also emphasize the importance of proper disposal practices and environmental stewardship among smokers.
The cigarette butt market in India is anticipated to expand at a CAGR of 6.7% through 2035. Community based organizations and grassroots movements actively engage in efforts to address cigarette butt litter at the local level. Community clean up events, educational campaigns, and advocacy initiatives raise awareness and mobilize action to combat cigarette butt pollution in neighborhoods and public spaces.
Government agencies in India provide funding, grants, and incentives to support initiatives aimed at reducing cigarette butt litter and promoting environmental sustainability. Public private partnerships and collaborative projects facilitate the implementation of comprehensive solutions to address cigarette butt pollution.
The below table highlights how disposable segment is projected to lead the market in terms of product, and is expected to account for a share of 70.0% in 2025.
Based on material, the cellulose acetate fibers segment is expected to account for a market share of 77.0% in 2025.
| Category | Market Shares in 2025 |
|---|---|
| Disposable | 70.0% |
| Cellulose Acetate Fibers | 77.0% |
Based on product, the disposable segment is expected to continue dominating the cigarette butt market. Disposable cigarette products offer convenience to smokers who prefer single use options without the need for maintenance or recharging. The simplicity of disposable cigarettes makes them attractive to users seeking a hassle free smoking experience.
Disposable cigarettes are widely available in convenience stores, gas stations, and other retail outlets, making them easily accessible to consumers. The widespread availability of disposable cigarette products contributes to their popularity among smokers.
In terms of material, the cellulose acetate fibers segment is expected to continue dominating the cigarette butt market, attributed to several key factors. Cellulose acetate fibers are lightweight, durable, and flexible, making them suitable for use in cigarette filters. The properties of the materials allow for effective filtration of smoke particles while maintaining structural integrity during smoking.
Cellulose acetate fibers are commonly used in cigarette filters due to their compliance with regulatory standards and requirements for tobacco product manufacturing. Manufacturers prefer materials that meet safety, quality, and regulatory guidelines, ensuring compliance with industry standards.
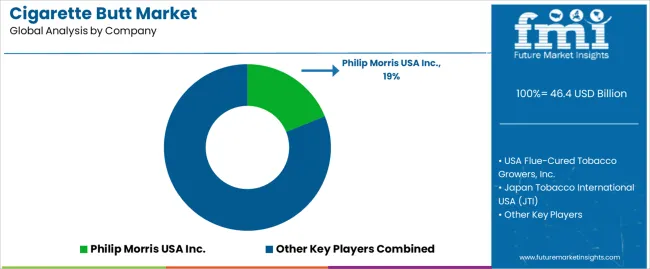
The competitive landscape of the cigarette butt market is shaped by various factors, including market dynamics, regulatory environment, technological advancements, consumer preferences, and sustainability considerations.
Company Portfolio
| Attribute | Details |
|---|---|
| Estimated Market Size in 2025 | USD 46.4 Billion |
| Projected Market Valuation in 2035 | USD 79.3 Billion |
| Value-based CAGR 2025 to 2035 | 5.5% |
| Forecast Period | 2025 to 2035 |
| Historical Data Available for | 2020 to 2025 |
| Market Analysis | Value in USD billion |
| Key Regions Covered | North America; Latin America; Western Europe; Eastern Europe; South Asia and Pacific; East Asia; The Middle East & Africa |
| Key Market Segments Covered | Product, Application, Material, Region |
| Key Countries Profiled | The United States, Canada, Brazil, Mexico, Germany, France, France, Spain, Italy, Russia, Poland, Czech Republic, Romania, India, Bangladesh, Australia, New Zealand, China, Japan, South Korea, GCC countries, South Africa, Israel |
| Key Companies Profiled | USA Flue-Cured Tobacco Growers, Inc.; Japan Tobacco International USA (JTI); Nasco Products, LLC; Philip Morris USA Inc.; Rjreynolds Tobacco Company; Farmer's Tobacco Co. of Cynthiana; Vector Tobacco Inc.; Wind River Tobacco Company; Liggett Group Inc.; Scandinavian Tobacco Group Lane Ltd. |
The global cigarette butt market is estimated to be valued at USD 46.4 billion in 2025.
The market size for the cigarette butt market is projected to reach USD 79.3 billion by 2035.
The cigarette butt market is expected to grow at a 5.5% CAGR between 2025 and 2035.
The key product types in cigarette butt market are disposable and reusable.
In terms of application, standard cigarette segment to command 64.8% share in the cigarette butt market in 2025.


Full Research Suite comprises of:
Market outlook & trends analysis
Interviews & case studies
Strategic recommendations
Vendor profiles & capabilities analysis
5-year forecasts
8 regions and 60+ country-level data splits
Market segment data splits
12 months of continuous data updates
DELIVERED AS:
PDF EXCEL ONLINE
Cigarette Filters Market Size and Share Forecast Outlook 2025 to 2035
Cigarette Packaging Material Market Size and Share Forecast Outlook 2025 to 2035
Cigarette Making Equipment Market Size and Share Forecast Outlook 2025 to 2035
Cigarette Inner Liner Market Size and Share Forecast Outlook 2025 to 2035
Cigarette Packaging Machine Market Size and Share Forecast Outlook 2025 to 2035
Market Share Breakdown of Cigarette Packaging Machine Manufacturers
Global Cigarette Paper Market Analysis – Growth & Forecast 2024-2034
Premium Cigarette Market Growth – Demand & Industry Outlook to 2035
Smokeless Cigarettes Market Trends – Growth & Outlook 2025 to 2035
Automotive Cigarette Lighters Market
Disposable E-Cigarettes Market Size and Share Forecast Outlook 2025 to 2035
Flavor Capsule Cigarette Market Analysis - Size, Share, and Forecast 2025 to 2035
Flavor Capsule Cigarettes Market
Demand For Flavor Capsule Cigarette Products in EU Size and Share Forecast Outlook 2025 to 2035
Buttock Augmentation Market Size and Share Forecast Outlook 2025 to 2035
Butter Coffee Market Size and Share Forecast Outlook 2025 to 2035
Butter Market Insights - Dairy Industry Expansion & Consumer Trends 2025 to 2035
Buttermilk Powder Market Analysis by Product Type, Sale Channel, and Region Through 2035
Butterfly Valves Market Analysis by Type, Mechanism, Function, Applications, and Region through 2035
Butter Powder Market Growth – Applications & Demand 2025 to 2035

Thank you!
You will receive an email from our Business Development Manager. Please be sure to check your SPAM/JUNK folder too.
Chat With
MaRIA