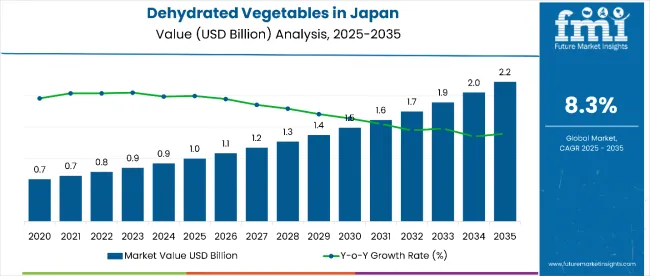
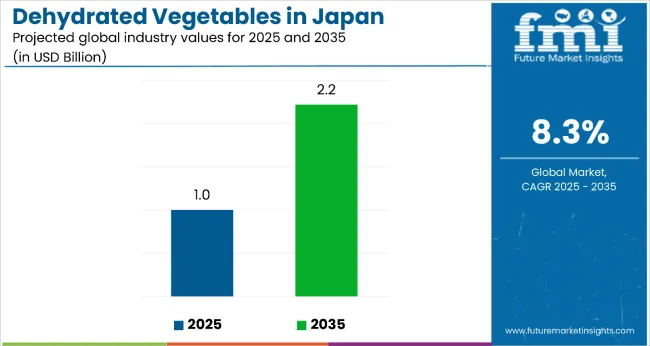
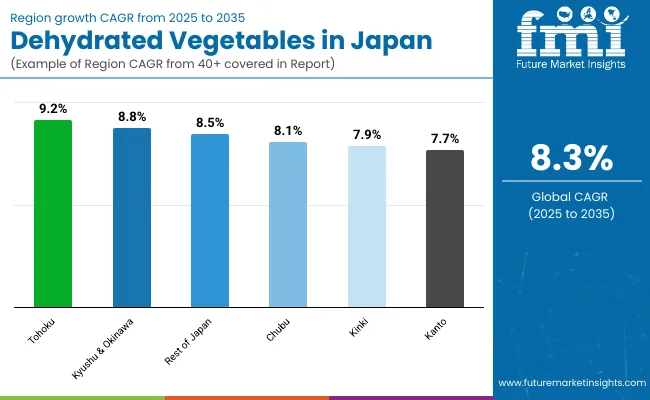
The demand for dehydrated vegetable in Japan reached USD 742.9 million in 2022. Sales of dehydrated vegetable in Japan are anticipated to reach USD 807.9 million in 2023 and are projected to further increase to USD 1,789 million by 2033. The industry for dehydrated vegetable in Japan is being driven by the rising consumer demand for fresh, organic, and nutrient-rich vegetables.
Sales of dehydrated vegetable in Japan are expected to experience a CAGR of 8.3% during the forecast period. The increasing adoption of dehydrated vegetable in Japan can be attributed to their extended shelf life, natural flavors, and high nutrient content. Farmers in Japan are now placing greater emphasis on cultivating raw and sustainable dehydrated vegetable to cater to various culinary needs and facilitate easy meal preparation.
Attributes | Details |
---|---|
Industry Size of Dehydrated Vegetable in Japan in 2023 | USD 807.9 million |
Expected Industry Size by 2033 | USD 1,789 million |
Value-based CAGR from 2023 to 2033 | 8.3% |
Convenience: The increasing demand for fresh and juicy vegetables is driving the adoption of dehydrated vegetable in Japan. The rising popularity of dehydrated vegetable among consumers seeking healthy meals and better nutrition is boosting the Japanese industry.
Seasonal Product: Consumers are increasingly turning to dehydrated vegetable to enjoy seasonal produce year-round. They prefer having access to seasonal vegetables throughout the year, which is driving the demand for dehydrated vegetable in Japan.
Emergency Preparedness: Japan is one of the countries prone to natural disasters, including floods, earthquakes, and tsunamis. The storage of dehydrated vegetable for these emergencies, in case of supply chain disruptions, holds great significance.
Expansion in Exports: Increasing export activities are driving up the demand for dehydrated vegetable used in preparing famous Japanese cuisines. Japan exports various vegetables, including dried seaweed and mushrooms, in response to demand from other countries.
Culinary Uses: In Japan, consumers have been increasingly incorporating dehydrated vegetable into various culinary dishes, such as noodles and miso soup, to enhance flavor. This trend is driving the Japanese industry.
Nutritional Value: With a growing number of diet-conscious and fitness-oriented consumers seeking rich minerals and vitamins, there is an increased demand for dehydrated vegetable in Japan.
Health and Wellness: The increasing consumer focus on health is driving the adoption of dehydrated vegetable in Japan. These vegetables enhance consumers' diets by providing essential nutrients.
Innovative Packaging: The rising adoption of sustainable and innovative packaging solutions is increasing the demand for dehydrated vegetable. Manufacturers are developing eco-friendly packaging solutions for storing these vegetables, conveniently extending their shelf life.
Plant-based Diets: The growing popularity of vegan and plant-based foods is significantly boosting the demand for dehydrated vegetable in Japan. The rising consumer demand for meat-free options and sustainable food recipes is driving the dehydrated vegetable industry in Japan.
Culinary Tourism: The increasing global interest in Japanese food and cuisines is contributing to the rise in sales of dehydrated vegetable.
Aging Population: The increasing elderly population, along with a wide range of consumers, are seeking dehydrated vegetable for quick and convenient meal preparation in Japan.
Rapid Growth of eCommerce: The expansion of eCommerce platforms and online shopping sites is significantly driving the adoption and demand for dehydrated vegetable.
Changing Preferences: Consumers are seeking a healthy lifestyle and food quality. The increasing availability of alternative options is expected to decrease the demand for dehydrated vegetable in Japan.
Price Sensitivity: Rising competition may increase the price of products. Compared to other alternatives, the rising cost of vegetable may decrease their demand in Japan.
Supply Chain Disruption: Unavailability of dehydrated vegetable, economic downfall, and natural disasters may cause a decline in sales, raising prices.
Top Product Type | Carrot |
---|---|
Industry Share (2023) | 4% |
Based on product type, carrots are estimated to hold a 4% share of Japan's dehydrated vegetable industry in 2023. The rising consumer concerns about health and the importance of proper nutrient and vitamin intake are driving sales of carrots in Japan. Carrots are widely embraced by individuals with low eyesight and fitness-conscious consumers.
The increasing demand for fresh, organic vegetable in Japanese cuisine is further fueling the popularity of carrots among consumers. Several players are now offering fresh vegetable directly from farms, and farmers are adopting eco-friendly practices in the cultivation of vegetable, including carrots.
Top Form | Powder and Granules |
---|---|
Industry Share (2023) | 36% |
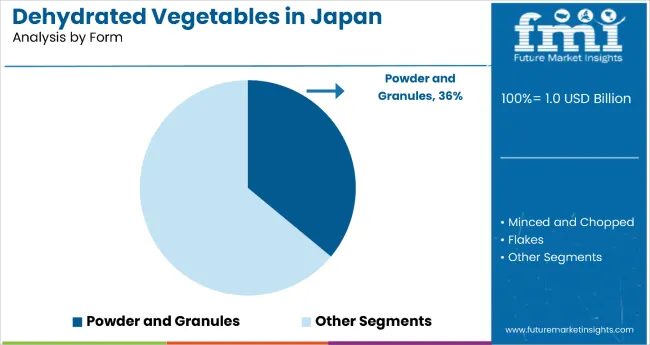
Based on form, powders and granules are likely to dominate the industry in Japan, holding a share of 36% as of 2023. The increasing consumer demand for healthy vitamin and supplement intake is driving the demand for powders and granules. Additionally, the rising demand for seasonings and flavors is boosting the use of powders and granules in Japanese dishes.
Professional chefs enhance the taste of dishes by incorporating vegetable powders and granules. The sales of vegetable in the form of powders and granules are being driven by their increasing demand from households, restaurants, and hotels for ease in cooking and baking processes. Manufacturers in Japan are placing emphasis on developing these ingredients with sustainable packaging to improve the shelf life of these products.
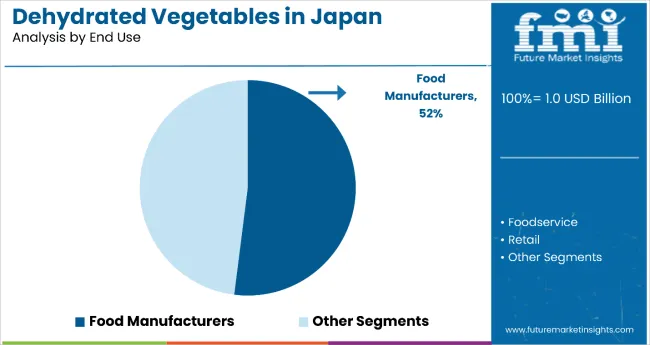
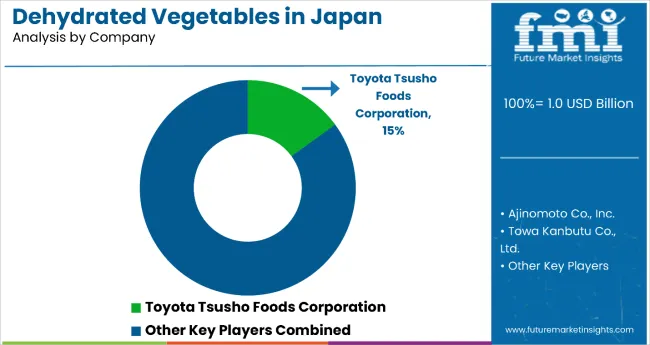
The dehydrated vegetable industry in Japan is highly consolidated, with prominent players playing a significant role in staying ahead of competitors. They focus on offering organic and non-toxic dehydrated vegetable to attract consumers and promote health. These players adopt sustainable practices to provide these vegetable, enhancing consumers' health with additional minerals and vitamins. Key players employ various marketing tactics to boost the global market size, including mergers, collaborations, and product launches.
Recent Developments in Japan Dehydrated Vegetable Industry
Crispy Green announced its new product line named Pia Picante. The company offers a variety of snacks, such as pineapple snacks with essential ingredients and shelf-life packaging, to expand its business portfolio.
Super Garden, a company focused on producing and selling freeze-dried products, introduced its flagship product line featuring freeze-dried berries, vegetable, and ice cream in Japan.
Attributes | Details |
---|---|
Estimated Industry Size in 2023 | USD 807.9 million |
Projected Industry Valuation by 2033 | USD 1,789 million |
Value-based CAGR 2023 to 2033 | 8.3% |
Historical Analysis of Dehydrated Vegetable in Japan | 2018 to 2022 |
Demand Forecast for Dehydrated Vegetable in Japan | 2023 to 2033 |
Report Coverage | Industry Size, Industry Trends, Analysis of key factors influencing Dehydrated Vegetable in Japan Insights on Global Players and their Industry Strategy in Japan, Ecosystem Analysis of Local and Regional Japan Providers |
Key Cities Analyzed While Studying Opportunities in Dehydrated Vegetable in Japan | Kanto, Chubu, Kinki, Kyushu and Okinawa, Tohoku, Rest of Japan |
Key Companies Profiled | Fresno Cooperative Raisin Growers Inc.; Olam International; Dole Food Company; Naturex S.A.; Symrise AG; Mercer Foods, LLC; Chengde Shenli Food Co., Ltd.; Vkc Nuts Private Limited; Viva Bella Orchards Inc.; Kiantama; Sun-Maid Growers of California; Sunshine Raisin Corporation; Traina Dried Vegetable Inc.; Lion Raisins Inc. |
Table 1: Industry Analysis and Outlook Value (US$ Million) Forecast by Region, 2018 to 2033
Table 2: Industry Analysis and Outlook Volume (Tons) Forecast by Region, 2018 to 2033
Table 3: Industry Analysis and Outlook Value (US$ Million) Forecast by Product Type, 2018 to 2033
Table 4: Industry Analysis and Outlook Volume (Tons) Forecast by Product Type, 2018 to 2033
Table 5: Industry Analysis and Outlook Value (US$ Million) Forecast by Form, 2018 to 2033
Table 6: Industry Analysis and Outlook Volume (Tons) Forecast by Form, 2018 to 2033
Table 7: Industry Analysis and Outlook Value (US$ Million) Forecast by Nature, 2018 to 2033
Table 8: Industry Analysis and Outlook Volume (Tons) Forecast by Nature, 2018 to 2033
Table 9: Industry Analysis and Outlook Value (US$ Million) Forecast by End Use, 2018 to 2033
Table 10: Industry Analysis and Outlook Volume (Tons) Forecast by End Use, 2018 to 2033
Table 11: Industry Analysis and Outlook Value (US$ Million) Forecast by Technology, 2018 to 2033
Table 12: Industry Analysis and Outlook Volume (Tons) Forecast by Technology, 2018 to 2033
Table 13: Industry Analysis and Outlook Value (US$ Million) Forecast by Distribution Channel, 2018 to 2033
Table 14: Industry Analysis and Outlook Volume (Tons) Forecast by Distribution Channel, 2018 to 2033
Table 15: Kanto Industry Analysis and Outlook Value (US$ Million) Forecast by Product Type, 2018 to 2033
Table 16: Kanto Industry Analysis and Outlook Volume (Tons) Forecast by Product Type, 2018 to 2033
Table 17: Kanto Industry Analysis and Outlook Value (US$ Million) Forecast by Form, 2018 to 2033
Table 18: Kanto Industry Analysis and Outlook Volume (Tons) Forecast by Form, 2018 to 2033
Table 19: Kanto Industry Analysis and Outlook Value (US$ Million) Forecast by Nature, 2018 to 2033
Table 20: Kanto Industry Analysis and Outlook Volume (Tons) Forecast by Nature, 2018 to 2033
Table 21: Kanto Industry Analysis and Outlook Value (US$ Million) Forecast by End Use, 2018 to 2033
Table 22: Kanto Industry Analysis and Outlook Volume (Tons) Forecast by End Use, 2018 to 2033
Table 23: Kanto Industry Analysis and Outlook Value (US$ Million) Forecast by Technology, 2018 to 2033
Table 24: Kanto Industry Analysis and Outlook Volume (Tons) Forecast by Technology, 2018 to 2033
Table 25: Kanto Industry Analysis and Outlook Value (US$ Million) Forecast by Distribution Channel, 2018 to 2033
Table 26: Kanto Industry Analysis and Outlook Volume (Tons) Forecast by Distribution Channel, 2018 to 2033
Table 27: Chubu Industry Analysis and Outlook Value (US$ Million) Forecast by Product Type, 2018 to 2033
Table 28: Chubu Industry Analysis and Outlook Volume (Tons) Forecast by Product Type, 2018 to 2033
Table 29: Chubu Industry Analysis and Outlook Value (US$ Million) Forecast by Form, 2018 to 2033
Table 30: Chubu Industry Analysis and Outlook Volume (Tons) Forecast by Form, 2018 to 2033
Table 31: Chubu Industry Analysis and Outlook Value (US$ Million) Forecast by Nature, 2018 to 2033
Table 32: Chubu Industry Analysis and Outlook Volume (Tons) Forecast by Nature, 2018 to 2033
Table 33: Chubu Industry Analysis and Outlook Value (US$ Million) Forecast by End Use, 2018 to 2033
Table 34: Chubu Industry Analysis and Outlook Volume (Tons) Forecast by End Use, 2018 to 2033
Table 35: Chubu Industry Analysis and Outlook Value (US$ Million) Forecast by Technology, 2018 to 2033
Table 36: Chubu Industry Analysis and Outlook Volume (Tons) Forecast by Technology, 2018 to 2033
Table 37: Chubu Industry Analysis and Outlook Value (US$ Million) Forecast by Distribution Channel, 2018 to 2033
Table 38: Chubu Industry Analysis and Outlook Volume (Tons) Forecast by Distribution Channel, 2018 to 2033
Table 39: Kinki Industry Analysis and Outlook Value (US$ Million) Forecast by Product Type, 2018 to 2033
Table 40: Kinki Industry Analysis and Outlook Volume (Tons) Forecast by Product Type, 2018 to 2033
Table 41: Kinki Industry Analysis and Outlook Value (US$ Million) Forecast by Form, 2018 to 2033
Table 42: Kinki Industry Analysis and Outlook Volume (Tons) Forecast by Form, 2018 to 2033
Table 43: Kinki Industry Analysis and Outlook Value (US$ Million) Forecast by Nature, 2018 to 2033
Table 44: Kinki Industry Analysis and Outlook Volume (Tons) Forecast by Nature, 2018 to 2033
Table 45: Kinki Industry Analysis and Outlook Value (US$ Million) Forecast by End Use, 2018 to 2033
Table 46: Kinki Industry Analysis and Outlook Volume (Tons) Forecast by End Use, 2018 to 2033
Table 47: Kinki Industry Analysis and Outlook Value (US$ Million) Forecast by Technology, 2018 to 2033
Table 48: Kinki Industry Analysis and Outlook Volume (Tons) Forecast by Technology, 2018 to 2033
Table 49: Kinki Industry Analysis and Outlook Value (US$ Million) Forecast by Distribution Channel, 2018 to 2033
Table 50: Kinki Industry Analysis and Outlook Volume (Tons) Forecast by Distribution Channel, 2018 to 2033
Table 51: Kyushu & Okinawa Industry Analysis and Outlook Value (US$ Million) Forecast by Product Type, 2018 to 2033
Table 52: Kyushu & Okinawa Industry Analysis and Outlook Volume (Tons) Forecast by Product Type, 2018 to 2033
Table 53: Kyushu & Okinawa Industry Analysis and Outlook Value (US$ Million) Forecast by Form, 2018 to 2033
Table 54: Kyushu & Okinawa Industry Analysis and Outlook Volume (Tons) Forecast by Form, 2018 to 2033
Table 55: Kyushu & Okinawa Industry Analysis and Outlook Value (US$ Million) Forecast by Nature, 2018 to 2033
Table 56: Kyushu & Okinawa Industry Analysis and Outlook Volume (Tons) Forecast by Nature, 2018 to 2033
Table 57: Kyushu & Okinawa Industry Analysis and Outlook Value (US$ Million) Forecast by End Use, 2018 to 2033
Table 58: Kyushu & Okinawa Industry Analysis and Outlook Volume (Tons) Forecast by End Use, 2018 to 2033
Table 59: Kyushu & Okinawa Industry Analysis and Outlook Value (US$ Million) Forecast by Technology, 2018 to 2033
Table 60: Kyushu & Okinawa Industry Analysis and Outlook Volume (Tons) Forecast by Technology, 2018 to 2033
Table 61: Kyushu & Okinawa Industry Analysis and Outlook Value (US$ Million) Forecast by Distribution Channel, 2018 to 2033
Table 62: Kyushu & Okinawa Industry Analysis and Outlook Volume (Tons) Forecast by Distribution Channel, 2018 to 2033
Table 63: Tohoku Industry Analysis and Outlook Value (US$ Million) Forecast by Product Type, 2018 to 2033
Table 64: Tohoku Industry Analysis and Outlook Volume (Tons) Forecast by Product Type, 2018 to 2033
Table 65: Tohoku Industry Analysis and Outlook Value (US$ Million) Forecast by Form, 2018 to 2033
Table 66: Tohoku Industry Analysis and Outlook Volume (Tons) Forecast by Form, 2018 to 2033
Table 67: Tohoku Industry Analysis and Outlook Value (US$ Million) Forecast by Nature, 2018 to 2033
Table 68: Tohoku Industry Analysis and Outlook Volume (Tons) Forecast by Nature, 2018 to 2033
Table 69: Tohoku Industry Analysis and Outlook Value (US$ Million) Forecast by End Use, 2018 to 2033
Table 70: Tohoku Industry Analysis and Outlook Volume (Tons) Forecast by End Use, 2018 to 2033
Table 71: Tohoku Industry Analysis and Outlook Value (US$ Million) Forecast by Technology, 2018 to 2033
Table 72: Tohoku Industry Analysis and Outlook Volume (Tons) Forecast by Technology, 2018 to 2033
Table 73: Tohoku Industry Analysis and Outlook Value (US$ Million) Forecast by Distribution Channel, 2018 to 2033
Table 74: Tohoku Industry Analysis and Outlook Volume (Tons) Forecast by Distribution Channel, 2018 to 2033
Table 75: Rest of Industry Analysis and Outlook Value (US$ Million) Forecast by Product Type, 2018 to 2033
Table 76: Rest of Industry Analysis and Outlook Volume (Tons) Forecast by Product Type, 2018 to 2033
Table 77: Rest of Industry Analysis and Outlook Value (US$ Million) Forecast by Form, 2018 to 2033
Table 78: Rest of Industry Analysis and Outlook Volume (Tons) Forecast by Form, 2018 to 2033
Table 79: Rest of Industry Analysis and Outlook Value (US$ Million) Forecast by Nature, 2018 to 2033
Table 80: Rest of Industry Analysis and Outlook Volume (Tons) Forecast by Nature, 2018 to 2033
Table 81: Rest of Industry Analysis and Outlook Value (US$ Million) Forecast by End Use, 2018 to 2033
Table 82: Rest of Industry Analysis and Outlook Volume (Tons) Forecast by End Use, 2018 to 2033
Table 83: Rest of Industry Analysis and Outlook Value (US$ Million) Forecast by Technology, 2018 to 2033
Table 84: Rest of Industry Analysis and Outlook Volume (Tons) Forecast by Technology, 2018 to 2033
Table 85: Rest of Industry Analysis and Outlook Value (US$ Million) Forecast by Distribution Channel, 2018 to 2033
Table 86: Rest of Industry Analysis and Outlook Volume (Tons) Forecast by Distribution Channel, 2018 to 2033
Figure 1: Industry Analysis and Outlook Value (US$ Million) by Product Type, 2023 to 2033
Figure 2: Industry Analysis and Outlook Value (US$ Million) by Form, 2023 to 2033
Figure 3: Industry Analysis and Outlook Value (US$ Million) by Nature, 2023 to 2033
Figure 4: Industry Analysis and Outlook Value (US$ Million) by End Use, 2023 to 2033
Figure 5: Industry Analysis and Outlook Value (US$ Million) by Technology, 2023 to 2033
Figure 6: Industry Analysis and Outlook Value (US$ Million) by Distribution Channel, 2023 to 2033
Figure 7: Industry Analysis and Outlook Value (US$ Million) by Region, 2023 to 2033
Figure 8: Industry Analysis and Outlook Value (US$ Million) Analysis by Region, 2018 to 2033
Figure 9: Industry Analysis and Outlook Volume (Tons) Analysis by Region, 2018 to 2033
Figure 10: Industry Analysis and Outlook Value Share (%) and BPS Analysis by Region, 2023 to 2033
Figure 11: Industry Analysis and Outlook Y-o-Y Growth (%) Projections by Region, 2023 to 2033
Figure 12: Industry Analysis and Outlook Value (US$ Million) Analysis by Product Type, 2018 to 2033
Figure 13: Industry Analysis and Outlook Volume (Tons) Analysis by Product Type, 2018 to 2033
Figure 14: Industry Analysis and Outlook Value Share (%) and BPS Analysis by Product Type, 2023 to 2033
Figure 15: Industry Analysis and Outlook Y-o-Y Growth (%) Projections by Product Type, 2023 to 2033
Figure 16: Industry Analysis and Outlook Value (US$ Million) Analysis by Form, 2018 to 2033
Figure 17: Industry Analysis and Outlook Volume (Tons) Analysis by Form, 2018 to 2033
Figure 18: Industry Analysis and Outlook Value Share (%) and BPS Analysis by Form, 2023 to 2033
Figure 19: Industry Analysis and Outlook Y-o-Y Growth (%) Projections by Form, 2023 to 2033
Figure 20: Industry Analysis and Outlook Value (US$ Million) Analysis by Nature, 2018 to 2033
Figure 21: Industry Analysis and Outlook Volume (Tons) Analysis by Nature, 2018 to 2033
Figure 22: Industry Analysis and Outlook Value Share (%) and BPS Analysis by Nature, 2023 to 2033
Figure 23: Industry Analysis and Outlook Y-o-Y Growth (%) Projections by Nature, 2023 to 2033
Figure 24: Industry Analysis and Outlook Value (US$ Million) Analysis by End Use, 2018 to 2033
Figure 25: Industry Analysis and Outlook Volume (Tons) Analysis by End Use, 2018 to 2033
Figure 26: Industry Analysis and Outlook Value Share (%) and BPS Analysis by End Use, 2023 to 2033
Figure 27: Industry Analysis and Outlook Y-o-Y Growth (%) Projections by End Use, 2023 to 2033
Figure 28: Industry Analysis and Outlook Value (US$ Million) Analysis by Technology, 2018 to 2033
Figure 29: Industry Analysis and Outlook Volume (Tons) Analysis by Technology, 2018 to 2033
Figure 30: Industry Analysis and Outlook Value Share (%) and BPS Analysis by Technology, 2023 to 2033
Figure 31: Industry Analysis and Outlook Y-o-Y Growth (%) Projections by Technology, 2023 to 2033
Figure 32: Industry Analysis and Outlook Value (US$ Million) Analysis by Distribution Channel, 2018 to 2033
Figure 33: Industry Analysis and Outlook Volume (Tons) Analysis by Distribution Channel, 2018 to 2033
Figure 34: Industry Analysis and Outlook Value Share (%) and BPS Analysis by Distribution Channel, 2023 to 2033
Figure 35: Industry Analysis and Outlook Y-o-Y Growth (%) Projections by Distribution Channel, 2023 to 2033
Figure 36: Industry Analysis and Outlook Attractiveness by Product Type, 2023 to 2033
Figure 37: Industry Analysis and Outlook Attractiveness by Form, 2023 to 2033
Figure 38: Industry Analysis and Outlook Attractiveness by Nature, 2023 to 2033
Figure 39: Industry Analysis and Outlook Attractiveness by End Use, 2023 to 2033
Figure 40: Industry Analysis and Outlook Attractiveness by Technology, 2023 to 2033
Figure 41: Industry Analysis and Outlook Attractiveness by Distribution Channel, 2023 to 2033
Figure 42: Industry Analysis and Outlook Attractiveness by Region, 2023 to 2033
Figure 43: Kanto Industry Analysis and Outlook Value (US$ Million) by Product Type, 2023 to 2033
Figure 44: Kanto Industry Analysis and Outlook Value (US$ Million) by Form, 2023 to 2033
Figure 45: Kanto Industry Analysis and Outlook Value (US$ Million) by Nature, 2023 to 2033
Figure 46: Kanto Industry Analysis and Outlook Value (US$ Million) by End Use, 2023 to 2033
Figure 47: Kanto Industry Analysis and Outlook Value (US$ Million) by Technology, 2023 to 2033
Figure 48: Kanto Industry Analysis and Outlook Value (US$ Million) by Distribution Channel, 2023 to 2033
Figure 49: Kanto Industry Analysis and Outlook Value (US$ Million) Analysis by Product Type, 2018 to 2033
Figure 50: Kanto Industry Analysis and Outlook Volume (Tons) Analysis by Product Type, 2018 to 2033
Figure 51: Kanto Industry Analysis and Outlook Value Share (%) and BPS Analysis by Product Type, 2023 to 2033
Figure 52: Kanto Industry Analysis and Outlook Y-o-Y Growth (%) Projections by Product Type, 2023 to 2033
Figure 53: Kanto Industry Analysis and Outlook Value (US$ Million) Analysis by Form, 2018 to 2033
Figure 54: Kanto Industry Analysis and Outlook Volume (Tons) Analysis by Form, 2018 to 2033
Figure 55: Kanto Industry Analysis and Outlook Value Share (%) and BPS Analysis by Form, 2023 to 2033
Figure 56: Kanto Industry Analysis and Outlook Y-o-Y Growth (%) Projections by Form, 2023 to 2033
Figure 57: Kanto Industry Analysis and Outlook Value (US$ Million) Analysis by Nature, 2018 to 2033
Figure 58: Kanto Industry Analysis and Outlook Volume (Tons) Analysis by Nature, 2018 to 2033
Figure 59: Kanto Industry Analysis and Outlook Value Share (%) and BPS Analysis by Nature, 2023 to 2033
Figure 60: Kanto Industry Analysis and Outlook Y-o-Y Growth (%) Projections by Nature, 2023 to 2033
Figure 61: Kanto Industry Analysis and Outlook Value (US$ Million) Analysis by End Use, 2018 to 2033
Figure 62: Kanto Industry Analysis and Outlook Volume (Tons) Analysis by End Use, 2018 to 2033
Figure 63: Kanto Industry Analysis and Outlook Value Share (%) and BPS Analysis by End Use, 2023 to 2033
Figure 64: Kanto Industry Analysis and Outlook Y-o-Y Growth (%) Projections by End Use, 2023 to 2033
Figure 65: Kanto Industry Analysis and Outlook Value (US$ Million) Analysis by Technology, 2018 to 2033
Figure 66: Kanto Industry Analysis and Outlook Volume (Tons) Analysis by Technology, 2018 to 2033
Figure 67: Kanto Industry Analysis and Outlook Value Share (%) and BPS Analysis by Technology, 2023 to 2033
Figure 68: Kanto Industry Analysis and Outlook Y-o-Y Growth (%) Projections by Technology, 2023 to 2033
Figure 69: Kanto Industry Analysis and Outlook Value (US$ Million) Analysis by Distribution Channel, 2018 to 2033
Figure 70: Kanto Industry Analysis and Outlook Volume (Tons) Analysis by Distribution Channel, 2018 to 2033
Figure 71: Kanto Industry Analysis and Outlook Value Share (%) and BPS Analysis by Distribution Channel, 2023 to 2033
Figure 72: Kanto Industry Analysis and Outlook Y-o-Y Growth (%) Projections by Distribution Channel, 2023 to 2033
Figure 73: Kanto Industry Analysis and Outlook Attractiveness by Product Type, 2023 to 2033
Figure 74: Kanto Industry Analysis and Outlook Attractiveness by Form, 2023 to 2033
Figure 75: Kanto Industry Analysis and Outlook Attractiveness by Nature, 2023 to 2033
Figure 76: Kanto Industry Analysis and Outlook Attractiveness by End Use, 2023 to 2033
Figure 77: Kanto Industry Analysis and Outlook Attractiveness by Technology, 2023 to 2033
Figure 78: Kanto Industry Analysis and Outlook Attractiveness by Distribution Channel, 2023 to 2033
Figure 79: Chubu Industry Analysis and Outlook Value (US$ Million) by Product Type, 2023 to 2033
Figure 80: Chubu Industry Analysis and Outlook Value (US$ Million) by Form, 2023 to 2033
Figure 81: Chubu Industry Analysis and Outlook Value (US$ Million) by Nature, 2023 to 2033
Figure 82: Chubu Industry Analysis and Outlook Value (US$ Million) by End Use, 2023 to 2033
Figure 83: Chubu Industry Analysis and Outlook Value (US$ Million) by Technology, 2023 to 2033
Figure 84: Chubu Industry Analysis and Outlook Value (US$ Million) by Distribution Channel, 2023 to 2033
Figure 85: Chubu Industry Analysis and Outlook Value (US$ Million) Analysis by Product Type, 2018 to 2033
Figure 86: Chubu Industry Analysis and Outlook Volume (Tons) Analysis by Product Type, 2018 to 2033
Figure 87: Chubu Industry Analysis and Outlook Value Share (%) and BPS Analysis by Product Type, 2023 to 2033
Figure 88: Chubu Industry Analysis and Outlook Y-o-Y Growth (%) Projections by Product Type, 2023 to 2033
Figure 89: Chubu Industry Analysis and Outlook Value (US$ Million) Analysis by Form, 2018 to 2033
Figure 90: Chubu Industry Analysis and Outlook Volume (Tons) Analysis by Form, 2018 to 2033
Figure 91: Chubu Industry Analysis and Outlook Value Share (%) and BPS Analysis by Form, 2023 to 2033
Figure 92: Chubu Industry Analysis and Outlook Y-o-Y Growth (%) Projections by Form, 2023 to 2033
Figure 93: Chubu Industry Analysis and Outlook Value (US$ Million) Analysis by Nature, 2018 to 2033
Figure 94: Chubu Industry Analysis and Outlook Volume (Tons) Analysis by Nature, 2018 to 2033
Figure 95: Chubu Industry Analysis and Outlook Value Share (%) and BPS Analysis by Nature, 2023 to 2033
Figure 96: Chubu Industry Analysis and Outlook Y-o-Y Growth (%) Projections by Nature, 2023 to 2033
Figure 97: Chubu Industry Analysis and Outlook Value (US$ Million) Analysis by End Use, 2018 to 2033
Figure 98: Chubu Industry Analysis and Outlook Volume (Tons) Analysis by End Use, 2018 to 2033
Figure 99: Chubu Industry Analysis and Outlook Value Share (%) and BPS Analysis by End Use, 2023 to 2033
Figure 100: Chubu Industry Analysis and Outlook Y-o-Y Growth (%) Projections by End Use, 2023 to 2033
Figure 101: Chubu Industry Analysis and Outlook Value (US$ Million) Analysis by Technology, 2018 to 2033
Figure 102: Chubu Industry Analysis and Outlook Volume (Tons) Analysis by Technology, 2018 to 2033
Figure 103: Chubu Industry Analysis and Outlook Value Share (%) and BPS Analysis by Technology, 2023 to 2033
Figure 104: Chubu Industry Analysis and Outlook Y-o-Y Growth (%) Projections by Technology, 2023 to 2033
Figure 105: Chubu Industry Analysis and Outlook Value (US$ Million) Analysis by Distribution Channel, 2018 to 2033
Figure 106: Chubu Industry Analysis and Outlook Volume (Tons) Analysis by Distribution Channel, 2018 to 2033
Figure 107: Chubu Industry Analysis and Outlook Value Share (%) and BPS Analysis by Distribution Channel, 2023 to 2033
Figure 108: Chubu Industry Analysis and Outlook Y-o-Y Growth (%) Projections by Distribution Channel, 2023 to 2033
Figure 109: Chubu Industry Analysis and Outlook Attractiveness by Product Type, 2023 to 2033
Figure 110: Chubu Industry Analysis and Outlook Attractiveness by Form, 2023 to 2033
Figure 111: Chubu Industry Analysis and Outlook Attractiveness by Nature, 2023 to 2033
Figure 112: Chubu Industry Analysis and Outlook Attractiveness by End Use, 2023 to 2033
Figure 113: Chubu Industry Analysis and Outlook Attractiveness by Technology, 2023 to 2033
Figure 114: Chubu Industry Analysis and Outlook Attractiveness by Distribution Channel, 2023 to 2033
Figure 115: Kinki Industry Analysis and Outlook Value (US$ Million) by Product Type, 2023 to 2033
Figure 116: Kinki Industry Analysis and Outlook Value (US$ Million) by Form, 2023 to 2033
Figure 117: Kinki Industry Analysis and Outlook Value (US$ Million) by Nature, 2023 to 2033
Figure 118: Kinki Industry Analysis and Outlook Value (US$ Million) by End Use, 2023 to 2033
Figure 119: Kinki Industry Analysis and Outlook Value (US$ Million) by Technology, 2023 to 2033
Figure 120: Kinki Industry Analysis and Outlook Value (US$ Million) by Distribution Channel, 2023 to 2033
Figure 121: Kinki Industry Analysis and Outlook Value (US$ Million) Analysis by Product Type, 2018 to 2033
Figure 122: Kinki Industry Analysis and Outlook Volume (Tons) Analysis by Product Type, 2018 to 2033
Figure 123: Kinki Industry Analysis and Outlook Value Share (%) and BPS Analysis by Product Type, 2023 to 2033
Figure 124: Kinki Industry Analysis and Outlook Y-o-Y Growth (%) Projections by Product Type, 2023 to 2033
Figure 125: Kinki Industry Analysis and Outlook Value (US$ Million) Analysis by Form, 2018 to 2033
Figure 126: Kinki Industry Analysis and Outlook Volume (Tons) Analysis by Form, 2018 to 2033
Figure 127: Kinki Industry Analysis and Outlook Value Share (%) and BPS Analysis by Form, 2023 to 2033
Figure 128: Kinki Industry Analysis and Outlook Y-o-Y Growth (%) Projections by Form, 2023 to 2033
Figure 129: Kinki Industry Analysis and Outlook Value (US$ Million) Analysis by Nature, 2018 to 2033
Figure 130: Kinki Industry Analysis and Outlook Volume (Tons) Analysis by Nature, 2018 to 2033
Figure 131: Kinki Industry Analysis and Outlook Value Share (%) and BPS Analysis by Nature, 2023 to 2033
Figure 132: Kinki Industry Analysis and Outlook Y-o-Y Growth (%) Projections by Nature, 2023 to 2033
Figure 133: Kinki Industry Analysis and Outlook Value (US$ Million) Analysis by End Use, 2018 to 2033
Figure 134: Kinki Industry Analysis and Outlook Volume (Tons) Analysis by End Use, 2018 to 2033
Figure 135: Kinki Industry Analysis and Outlook Value Share (%) and BPS Analysis by End Use, 2023 to 2033
Figure 136: Kinki Industry Analysis and Outlook Y-o-Y Growth (%) Projections by End Use, 2023 to 2033
Figure 137: Kinki Industry Analysis and Outlook Value (US$ Million) Analysis by Technology, 2018 to 2033
Figure 138: Kinki Industry Analysis and Outlook Volume (Tons) Analysis by Technology, 2018 to 2033
Figure 139: Kinki Industry Analysis and Outlook Value Share (%) and BPS Analysis by Technology, 2023 to 2033
Figure 140: Kinki Industry Analysis and Outlook Y-o-Y Growth (%) Projections by Technology, 2023 to 2033
Figure 141: Kinki Industry Analysis and Outlook Value (US$ Million) Analysis by Distribution Channel, 2018 to 2033
Figure 142: Kinki Industry Analysis and Outlook Volume (Tons) Analysis by Distribution Channel, 2018 to 2033
Figure 143: Kinki Industry Analysis and Outlook Value Share (%) and BPS Analysis by Distribution Channel, 2023 to 2033
Figure 144: Kinki Industry Analysis and Outlook Y-o-Y Growth (%) Projections by Distribution Channel, 2023 to 2033
Figure 145: Kinki Industry Analysis and Outlook Attractiveness by Product Type, 2023 to 2033
Figure 146: Kinki Industry Analysis and Outlook Attractiveness by Form, 2023 to 2033
Figure 147: Kinki Industry Analysis and Outlook Attractiveness by Nature, 2023 to 2033
Figure 148: Kinki Industry Analysis and Outlook Attractiveness by End Use, 2023 to 2033
Figure 149: Kinki Industry Analysis and Outlook Attractiveness by Technology, 2023 to 2033
Figure 150: Kinki Industry Analysis and Outlook Attractiveness by Distribution Channel, 2023 to 2033
Figure 151: Kyushu & Okinawa Industry Analysis and Outlook Value (US$ Million) by Product Type, 2023 to 2033
Figure 152: Kyushu & Okinawa Industry Analysis and Outlook Value (US$ Million) by Form, 2023 to 2033
Figure 153: Kyushu & Okinawa Industry Analysis and Outlook Value (US$ Million) by Nature, 2023 to 2033
Figure 154: Kyushu & Okinawa Industry Analysis and Outlook Value (US$ Million) by End Use, 2023 to 2033
Figure 155: Kyushu & Okinawa Industry Analysis and Outlook Value (US$ Million) by Technology, 2023 to 2033
Figure 156: Kyushu & Okinawa Industry Analysis and Outlook Value (US$ Million) by Distribution Channel, 2023 to 2033
Figure 157: Kyushu & Okinawa Industry Analysis and Outlook Value (US$ Million) Analysis by Product Type, 2018 to 2033
Figure 158: Kyushu & Okinawa Industry Analysis and Outlook Volume (Tons) Analysis by Product Type, 2018 to 2033
Figure 159: Kyushu & Okinawa Industry Analysis and Outlook Value Share (%) and BPS Analysis by Product Type, 2023 to 2033
Figure 160: Kyushu & Okinawa Industry Analysis and Outlook Y-o-Y Growth (%) Projections by Product Type, 2023 to 2033
Figure 161: Kyushu & Okinawa Industry Analysis and Outlook Value (US$ Million) Analysis by Form, 2018 to 2033
Figure 162: Kyushu & Okinawa Industry Analysis and Outlook Volume (Tons) Analysis by Form, 2018 to 2033
Figure 163: Kyushu & Okinawa Industry Analysis and Outlook Value Share (%) and BPS Analysis by Form, 2023 to 2033
Figure 164: Kyushu & Okinawa Industry Analysis and Outlook Y-o-Y Growth (%) Projections by Form, 2023 to 2033
Figure 165: Kyushu & Okinawa Industry Analysis and Outlook Value (US$ Million) Analysis by Nature, 2018 to 2033
Figure 166: Kyushu & Okinawa Industry Analysis and Outlook Volume (Tons) Analysis by Nature, 2018 to 2033
Figure 167: Kyushu & Okinawa Industry Analysis and Outlook Value Share (%) and BPS Analysis by Nature, 2023 to 2033
Figure 168: Kyushu & Okinawa Industry Analysis and Outlook Y-o-Y Growth (%) Projections by Nature, 2023 to 2033
Figure 169: Kyushu & Okinawa Industry Analysis and Outlook Value (US$ Million) Analysis by End Use, 2018 to 2033
Figure 170: Kyushu & Okinawa Industry Analysis and Outlook Volume (Tons) Analysis by End Use, 2018 to 2033
Figure 171: Kyushu & Okinawa Industry Analysis and Outlook Value Share (%) and BPS Analysis by End Use, 2023 to 2033
Figure 172: Kyushu & Okinawa Industry Analysis and Outlook Y-o-Y Growth (%) Projections by End Use, 2023 to 2033
Figure 173: Kyushu & Okinawa Industry Analysis and Outlook Value (US$ Million) Analysis by Technology, 2018 to 2033
Figure 174: Kyushu & Okinawa Industry Analysis and Outlook Volume (Tons) Analysis by Technology, 2018 to 2033
Figure 175: Kyushu & Okinawa Industry Analysis and Outlook Value Share (%) and BPS Analysis by Technology, 2023 to 2033
Figure 176: Kyushu & Okinawa Industry Analysis and Outlook Y-o-Y Growth (%) Projections by Technology, 2023 to 2033
Figure 177: Kyushu & Okinawa Industry Analysis and Outlook Value (US$ Million) Analysis by Distribution Channel, 2018 to 2033
Figure 178: Kyushu & Okinawa Industry Analysis and Outlook Volume (Tons) Analysis by Distribution Channel, 2018 to 2033
Figure 179: Kyushu & Okinawa Industry Analysis and Outlook Value Share (%) and BPS Analysis by Distribution Channel, 2023 to 2033
Figure 180: Kyushu & Okinawa Industry Analysis and Outlook Y-o-Y Growth (%) Projections by Distribution Channel, 2023 to 2033
Figure 181: Kyushu & Okinawa Industry Analysis and Outlook Attractiveness by Product Type, 2023 to 2033
Figure 182: Kyushu & Okinawa Industry Analysis and Outlook Attractiveness by Form, 2023 to 2033
Figure 183: Kyushu & Okinawa Industry Analysis and Outlook Attractiveness by Nature, 2023 to 2033
Figure 184: Kyushu & Okinawa Industry Analysis and Outlook Attractiveness by End Use, 2023 to 2033
Figure 185: Kyushu & Okinawa Industry Analysis and Outlook Attractiveness by Technology, 2023 to 2033
Figure 186: Kyushu & Okinawa Industry Analysis and Outlook Attractiveness by Distribution Channel, 2023 to 2033
Figure 187: Tohoku Industry Analysis and Outlook Value (US$ Million) by Product Type, 2023 to 2033
Figure 188: Tohoku Industry Analysis and Outlook Value (US$ Million) by Form, 2023 to 2033
Figure 189: Tohoku Industry Analysis and Outlook Value (US$ Million) by Nature, 2023 to 2033
Figure 190: Tohoku Industry Analysis and Outlook Value (US$ Million) by End Use, 2023 to 2033
Figure 191: Tohoku Industry Analysis and Outlook Value (US$ Million) by Technology, 2023 to 2033
Figure 192: Tohoku Industry Analysis and Outlook Value (US$ Million) by Distribution Channel, 2023 to 2033
Figure 193: Tohoku Industry Analysis and Outlook Value (US$ Million) Analysis by Product Type, 2018 to 2033
Figure 194: Tohoku Industry Analysis and Outlook Volume (Tons) Analysis by Product Type, 2018 to 2033
Figure 195: Tohoku Industry Analysis and Outlook Value Share (%) and BPS Analysis by Product Type, 2023 to 2033
Figure 196: Tohoku Industry Analysis and Outlook Y-o-Y Growth (%) Projections by Product Type, 2023 to 2033
Figure 197: Tohoku Industry Analysis and Outlook Value (US$ Million) Analysis by Form, 2018 to 2033
Figure 198: Tohoku Industry Analysis and Outlook Volume (Tons) Analysis by Form, 2018 to 2033
Figure 199: Tohoku Industry Analysis and Outlook Value Share (%) and BPS Analysis by Form, 2023 to 2033
Figure 200: Tohoku Industry Analysis and Outlook Y-o-Y Growth (%) Projections by Form, 2023 to 2033
Figure 201: Tohoku Industry Analysis and Outlook Value (US$ Million) Analysis by Nature, 2018 to 2033
Figure 202: Tohoku Industry Analysis and Outlook Volume (Tons) Analysis by Nature, 2018 to 2033
Figure 203: Tohoku Industry Analysis and Outlook Value Share (%) and BPS Analysis by Nature, 2023 to 2033
Figure 204: Tohoku Industry Analysis and Outlook Y-o-Y Growth (%) Projections by Nature, 2023 to 2033
Figure 205: Tohoku Industry Analysis and Outlook Value (US$ Million) Analysis by End Use, 2018 to 2033
Figure 206: Tohoku Industry Analysis and Outlook Volume (Tons) Analysis by End Use, 2018 to 2033
Figure 207: Tohoku Industry Analysis and Outlook Value Share (%) and BPS Analysis by End Use, 2023 to 2033
Figure 208: Tohoku Industry Analysis and Outlook Y-o-Y Growth (%) Projections by End Use, 2023 to 2033
Figure 209: Tohoku Industry Analysis and Outlook Value (US$ Million) Analysis by Technology, 2018 to 2033
Figure 210: Tohoku Industry Analysis and Outlook Volume (Tons) Analysis by Technology, 2018 to 2033
Figure 211: Tohoku Industry Analysis and Outlook Value Share (%) and BPS Analysis by Technology, 2023 to 2033
Figure 212: Tohoku Industry Analysis and Outlook Y-o-Y Growth (%) Projections by Technology, 2023 to 2033
Figure 213: Tohoku Industry Analysis and Outlook Value (US$ Million) Analysis by Distribution Channel, 2018 to 2033
Figure 214: Tohoku Industry Analysis and Outlook Volume (Tons) Analysis by Distribution Channel, 2018 to 2033
Figure 215: Tohoku Industry Analysis and Outlook Value Share (%) and BPS Analysis by Distribution Channel, 2023 to 2033
Figure 216: Tohoku Industry Analysis and Outlook Y-o-Y Growth (%) Projections by Distribution Channel, 2023 to 2033
Figure 217: Tohoku Industry Analysis and Outlook Attractiveness by Product Type, 2023 to 2033
Figure 218: Tohoku Industry Analysis and Outlook Attractiveness by Form, 2023 to 2033
Figure 219: Tohoku Industry Analysis and Outlook Attractiveness by Nature, 2023 to 2033
Figure 220: Tohoku Industry Analysis and Outlook Attractiveness by End Use, 2023 to 2033
Figure 221: Tohoku Industry Analysis and Outlook Attractiveness by Technology, 2023 to 2033
Figure 222: Tohoku Industry Analysis and Outlook Attractiveness by Distribution Channel, 2023 to 2033
Figure 223: Rest of Industry Analysis and Outlook Value (US$ Million) by Product Type, 2023 to 2033
Figure 224: Rest of Industry Analysis and Outlook Value (US$ Million) by Form, 2023 to 2033
Figure 225: Rest of Industry Analysis and Outlook Value (US$ Million) by Nature, 2023 to 2033
Figure 226: Rest of Industry Analysis and Outlook Value (US$ Million) by End Use, 2023 to 2033
Figure 227: Rest of Industry Analysis and Outlook Value (US$ Million) by Technology, 2023 to 2033
Figure 228: Rest of Industry Analysis and Outlook Value (US$ Million) by Distribution Channel, 2023 to 2033
Figure 229: Rest of Industry Analysis and Outlook Value (US$ Million) Analysis by Product Type, 2018 to 2033
Figure 230: Rest of Industry Analysis and Outlook Volume (Tons) Analysis by Product Type, 2018 to 2033
Figure 231: Rest of Industry Analysis and Outlook Value Share (%) and BPS Analysis by Product Type, 2023 to 2033
Figure 232: Rest of Industry Analysis and Outlook Y-o-Y Growth (%) Projections by Product Type, 2023 to 2033
Figure 233: Rest of Industry Analysis and Outlook Value (US$ Million) Analysis by Form, 2018 to 2033
Figure 234: Rest of Industry Analysis and Outlook Volume (Tons) Analysis by Form, 2018 to 2033
Figure 235: Rest of Industry Analysis and Outlook Value Share (%) and BPS Analysis by Form, 2023 to 2033
Figure 236: Rest of Industry Analysis and Outlook Y-o-Y Growth (%) Projections by Form, 2023 to 2033
Figure 237: Rest of Industry Analysis and Outlook Value (US$ Million) Analysis by Nature, 2018 to 2033
Figure 238: Rest of Industry Analysis and Outlook Volume (Tons) Analysis by Nature, 2018 to 2033
Figure 239: Rest of Industry Analysis and Outlook Value Share (%) and BPS Analysis by Nature, 2023 to 2033
Figure 240: Rest of Industry Analysis and Outlook Y-o-Y Growth (%) Projections by Nature, 2023 to 2033
Figure 241: Rest of Industry Analysis and Outlook Value (US$ Million) Analysis by End Use, 2018 to 2033
Figure 242: Rest of Industry Analysis and Outlook Volume (Tons) Analysis by End Use, 2018 to 2033
Figure 243: Rest of Industry Analysis and Outlook Value Share (%) and BPS Analysis by End Use, 2023 to 2033
Figure 244: Rest of Industry Analysis and Outlook Y-o-Y Growth (%) Projections by End Use, 2023 to 2033
Figure 245: Rest of Industry Analysis and Outlook Value (US$ Million) Analysis by Technology, 2018 to 2033
Figure 246: Rest of Industry Analysis and Outlook Volume (Tons) Analysis by Technology, 2018 to 2033
Figure 247: Rest of Industry Analysis and Outlook Value Share (%) and BPS Analysis by Technology, 2023 to 2033
Figure 248: Rest of Industry Analysis and Outlook Y-o-Y Growth (%) Projections by Technology, 2023 to 2033
Figure 249: Rest of Industry Analysis and Outlook Value (US$ Million) Analysis by Distribution Channel, 2018 to 2033
Figure 250: Rest of Industry Analysis and Outlook Volume (Tons) Analysis by Distribution Channel, 2018 to 2033
Figure 251: Rest of Industry Analysis and Outlook Value Share (%) and BPS Analysis by Distribution Channel, 2023 to 2033
Figure 252: Rest of Industry Analysis and Outlook Y-o-Y Growth (%) Projections by Distribution Channel, 2023 to 2033
Figure 253: Rest of Industry Analysis and Outlook Attractiveness by Product Type, 2023 to 2033
Figure 254: Rest of Industry Analysis and Outlook Attractiveness by Form, 2023 to 2033
Figure 255: Rest of Industry Analysis and Outlook Attractiveness by Nature, 2023 to 2033
Figure 256: Rest of Industry Analysis and Outlook Attractiveness by End Use, 2023 to 2033
Figure 257: Rest of Industry Analysis and Outlook Attractiveness by Technology, 2023 to 2033
Figure 258: Rest of Industry Analysis and Outlook Attractiveness by Distribution Channel, 2023 to 2033
The demand for dehydrated vegetable in Japan reaches USD 807.9 million in 2023.
The adoption of dehydrated vegetable in Japan is likely to surpass USD 1,789 million by 2033.
The dehydrated vegetable industry in Japan is likely to rise at a CAGR of 8.3% from 2023 to 2033.
Companies in Japan expand dehydrated vegetable sales through innovation, packaging, and meeting consumer preferences.
Tokyo significantly drives the demand for dehydrated vegetable in Japan over the forecast period.
Explore Fruits and Vegetables Insights
Thank you!
You will receive an email from our Business Development Manager. Please be sure to check your SPAM/JUNK folder too.