Demand for Taurine in EU: Outlook and Forecast (2025-2035)

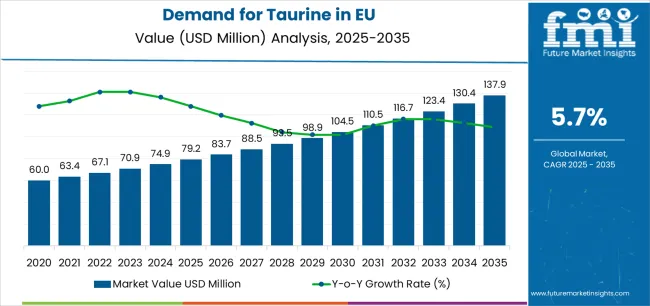
The EU taurine market is anticipated to expand from USD 79.2 million in 2025 to USD 137.9 million by 2035, advancing at a CAGR of 5.7%. This growth reflects rising consumption across dietary supplements, beverages, and pharmaceutical applications as taurine becomes increasingly recognized for its functional and therapeutic properties. Food and beverage manufacturers continue to incorporate taurine for energy-enhancing, metabolic, and cellular protection benefits. As per FMI’s latest global food industry intelligence, widely referenced in health and ingredients studies, expanding pharmaceutical utilization and growing pet nutrition applications are further accelerating market development, positioning taurine as a high-value amino acid additive integral to Europe’s health, nutrition, and wellness manufacturing ecosystem.
Quick Stats for Taurine Market in EU

  • Taurine in EU Value (2025): USD 79.2 million
  • Taurine in EU Forecast Value (2035): USD 137.9 million
  • Taurine in EU Forecast CAGR (2025–2035): 5.7%
  • Leading Segment of Taurine: Food Grade (46.0% by 2035)
  • Top Applications of Taurine: Dietary Supplements and Beverages
  • Key Growth Regions of Taurine: Germany, France, Italy, Spain, Netherlands
  • Market Drivers of Taurine: Rising supplement usage, pet food fortification, and energy drink demand

Demand For Taurine In Eu Market Value Analysis

Demand for Taurine in EU Key Takeaways

Between 2025 and 2030, EU taurine sales are expected to grow from USD 79.2 million to USD 104.3 million, adding USD 25.1 million, which represents roughly 36% of the total decade expansion. This period will be characterized by stronger supplement production, increased energy beverage manufacturing, and enhanced taurine integration in functional food formulations. From 2030 to 2035, the market will add USD 33.7 million, driven by pharmaceutical innovation and plant-based taurine technologies. Historical performance between 2020 and 2025 showed steady 5.0% CAGR growth, underscoring taurine’s increasing acceptance in nutrition, healthcare, and functional beverage applications across European manufacturing ecosystems.

From 2030 to 2035, sales in the Taurine Market in the EU are forecast to grow from USD 104.3 million to USD 137.9 million, adding another USD 33.7 million, which constitutes 57.3% of the overall ten-year expansion. This period is expected to be characterized by further adoption of bio-fermentation-derived taurine, broader pharmaceutical integration, and growing pet nutrition enrichment targeting diverse health and performance requirements. The increasing focus on clean-label amino acids, coupled with beverage and supplement manufacturer commitment to functional fortification, will drive demand for high-purity taurine products that ensure consistent bioavailability, verified safety, and strict pharmaceutical and nutraceutical regulatory compliance.

Between 2020 and 2025, EU taurine sales experienced steady expansion at a CAGR of 5.0%, rising from USD 62.1 million to USD 79.2 million. This phase was fueled by expanding energy drink production, increasing dietary supplement consumption, and greater awareness of taurine’s role in cellular hydration and antioxidant defense. The market matured as pharmaceutical companies and nutritional product formulators recognized taurine’s commercial and therapeutic potential. Product innovations, improved purity control, and manufacturing efficiency strengthened supplier credibility, helping establish taurine as a reliable and widely accepted functional amino acid across European pharmaceutical and nutritional applications.

Why is the Demand for Taurine in EU Growing?

Industry expansion is being supported by the rapid increase in health-conscious consumers across European countries and the corresponding demand for functional, performance-enhancing, and nutritionally beneficial ingredients with scientifically validated efficacy in energy metabolism, cardiovascular health, and cellular protection. Modern food, beverage, and pharmaceutical manufacturers rely on taurine as an essential ingredient for dietary supplements, fortified drinks, and therapeutic formulations, driving demand for products that deliver consistent purity, proven bioavailability, and stable performance across applications. Even basic fortification requirements—such as energy support, hydration enhancement, or antioxidant protection—continue to drive comprehensive taurine adoption to maintain product quality and consumer trust.

The growing awareness of taurine’s physiological benefits and increasing recognition of its formulation versatility are driving demand for high-purity taurine from certified manufacturers with validated quality systems and regulatory compliance capabilities. European regulatory authorities are establishing clear specifications for amino acid quality, purity testing, and labeling requirements to ensure product safety and health claim accuracy. Scientific and clinical studies are providing robust evidence supporting taurine’s cardioprotective, neuroprotective, and metabolic advantages, reinforcing its inclusion in supplements, energy beverages, and pet nutrition formulations. This requires specialized manufacturing controls and standardized quality protocols for optimal purity, appropriate solubility, and validated performance profiles, including identity verification and bioavailability certification.

Segment Analysis

Sales are segmented by grade, end-use application, distribution channel, nature, and country. By grade, taurine demand is divided into Food Grade, Feed Grade, Pharmaceutical Grade, and Others. Based on end-use application, sales are categorized into Food, Beverage, Animal Feed, Dietary Supplements, Cosmetics & Personal Care, Agriculture, and Pharmaceuticals. In terms of distribution channel, demand is segmented into B2B (ingredient supply to manufacturers) and Direct-to-Consumer. By nature, sales are classified into Synthetic (conventional) and Plant-based (bio/fermentation-derived). Regionally, taurine demand is focused on Germany, France, Italy, Spain, the Netherlands, and the Rest of Europe.

By Grade, Food Grade Segment Accounts for 48.0% Share

The food-grade taurine segment is projected to account for 48.0% of EU taurine sales in 2025, moderating slightly to 46.0% by 2035, establishing itself as the leading material class across European food and supplement manufacturing. This dominance is supported by taurine’s functional versatility, clean taste, and compatibility with beverages, supplements, and fortified foods. Food-grade taurine provides manufacturers with stable, soluble, and high-purity formulations suitable for both dry-blend and liquid applications. It benefits from mature processing technology, broad acceptance in food safety frameworks, and extensive adoption among functional beverage brands, dietary supplement producers, and nutraceutical manufacturers emphasizing performance consistency and regulatory assurance.
By Application, Dietary Supplements Segment Accounts for 24.0% Share

Demand For Taurine In Eu Analysis By Application

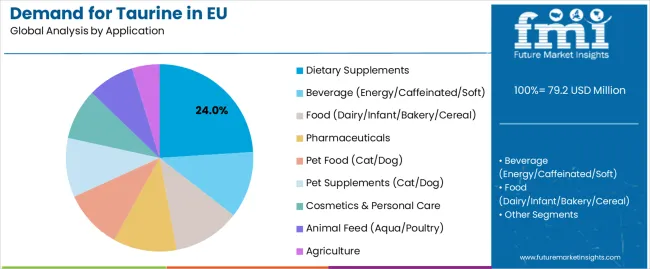
Dietary supplements are positioned to represent 24.0% of total taurine demand in 2025, growing slightly to 23.0% by 2035, reflecting steady leadership despite rising pharmaceutical usage. This significant share demonstrates taurine’s essential role in energy metabolism, cardiovascular support, and antioxidative health formulations. European supplement manufacturers increasingly incorporate taurine into performance blends, nootropic complexes, and electrolyte formulations, targeting health-conscious consumers seeking functional efficacy. The segment benefits from continuous product innovation in powders, capsules, and ready-to-drink formats, all requiring consistent amino-acid quality and bioavailability. Although pharmaceutical use expands faster, supplements will remain taurine’s core commercial domain through 2035.
By Distribution Channel, B2B Segment Accounts for 97.0% Share

Demand For Taurine In Eu Analysis By Distribution Channel

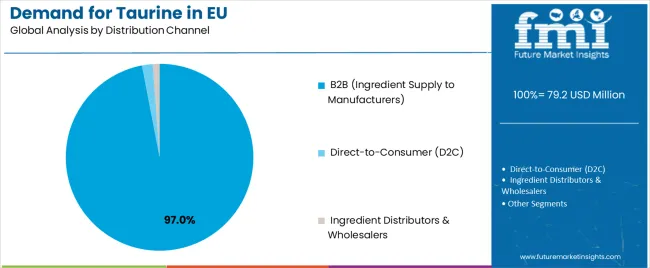
The B2B distribution channel controls approximately 97.0% of EU taurine sales in 2025, marginally declining to 96.0% by 2035 as direct-to-consumer growth gains minimal traction. B2B dominance reflects taurine’s nature as an industrial input for food, beverage, pharmaceutical, and pet-food producers requiring verified quality documentation, technical support, and batch traceability. European manufacturers prefer sourcing through established ingredient suppliers and amino-acid distributors offering GMP-certified production and logistics reliability. B2B suppliers deliver validated purity, analytical data, and regulatory certifications, ensuring compliance with EFSA and EMA standards. Despite minor D2C expansion, taurine remains primarily an ingredient-centric B2B commodity.

By Nature, Synthetic Segment Accounts for 96.0% Share

Synthetic taurine dominates EU supply, contributing 96.0% of total sales in 2025 and gradually declining to 90.0% by 2035 as plant-based and fermentation-derived taurine technologies gain maturity. Synthetic production remains the most cost-efficient and scalable method for achieving pharmaceutical-grade purity. It serves high-volume applications such as energy drinks, supplements, and pet food where consistency, cost control, and regulatory clarity are crucial. The emerging bio-fermentation segment, though smaller, is gaining traction among clean-label and sustainability-focused manufacturers. As bio-derived taurine proves comparable in stability and bioavailability, it will capture niche premium markets while synthetic retains dominance.

What are the Drivers, Restraints, and Key Trends?

EU taurine sales are advancing steadily due to growing consumer interest in functional nutrition, expanding use in energy and sports beverages, and increasing pharmaceutical adoption for cardiovascular and neurological health applications. The industry faces several challenges, including import dependence from Asian manufacturers, raw material price fluctuations, and regulatory scrutiny over taurine dosage and labeling in food and drink formulations. Continued innovation in bio-fermentation production technologies, clean-label amino acid development, and pharmaceutical-grade quality assurance remains central to industry progression and long-term competitiveness across the European taurine market.

Expansion of Bio-Fermentation and Clean-Label Production Technologies

The rapidly accelerating development of bio-fermentation technologies is transforming taurine manufacturing from synthetic chemical processes into sustainable, plant-based amino acid production, enabling purity and performance characteristics comparable to conventional taurine. Advanced biotechnology platforms utilizing microbial fermentation, enzyme catalysis, and green chemistry allow producers to deliver taurine with verified traceability, reduced carbon footprint, and improved environmental compliance. These innovations prove particularly valuable for pharmaceutical and nutraceutical manufacturers seeking natural ingredient positioning, reduced environmental impact, and consistent bioavailability.

Major taurine producers are investing in fermentation process optimization, European production localization, and quality certification programs, recognizing that bio-fermentation-derived taurine represents a breakthrough solution to sustainability, purity, and import-dependence challenges. Manufacturers collaborate with biotechnology companies, research institutions, and regulatory agencies to develop scalable production platforms that achieve synthetic-grade performance while aligning with EU sustainability goals, REACH regulations, and consumer clean-label expectations.

Integration of Taurine into Functional Foods and Nutritional Fortification

Modern food, beverage, and supplement manufacturers are increasingly incorporating taurine as a fortification ingredient to enhance energy metabolism, mental focus, and cellular protection in consumer health products. Strategic integration of taurine into energy beverages, dietary supplements, and fortified functional foods allows companies to deliver products offering measurable health benefits validated by clinical research. Taurine’s inclusion enables nutritional fortification and functional performance similar to leading amino acids such as L-carnitine and creatine, creating opportunities for differentiated health-focused formulations.

Manufacturers implement bioavailability testing, stability validation, and purity verification protocols ensuring taurine efficacy across multiple product types. These validation efforts support nutrition claims, promote scientific credibility, and facilitate product registration under EU food and supplement regulations. Nutrient integration programs and research-backed positioning continue to strengthen taurine’s profile as a key functional ingredient supporting energy balance, cardiovascular protection, and metabolic optimization.

Growing Emphasis on Sustainability, Traceability, and Ethical Sourcing

European consumers and manufacturers increasingly prioritize sustainable taurine sourcing, emphasizing verified environmental credentials, transparent supply chains, and compliance with ethical manufacturing standards. This sustainability trend allows suppliers to achieve competitive differentiation through traceable production, renewable feedstocks, and environmentally responsible chemistry. Sustainability initiatives are particularly relevant to pharmaceutical, pet nutrition, and nutraceutical brands, where ingredient provenance and production ethics directly influence brand reputation and market acceptance.

The development of eco-friendly taurine production programs, including waste minimization, energy-efficient synthesis, and green solvent utilization, is expanding manufacturers’ ability to meet environmental performance benchmarks without compromising cost or quality. Companies collaborate with regulatory agencies, environmental certification bodies, and academic partners to balance environmental accountability with production scalability. These collaborative frameworks strengthen consumer trust, support compliance with EU sustainability directives, and reinforce taurine’s position as a responsibly manufactured, high-value amino acid in the European health and nutrition ecosystem.
Analyzing Demand for Taurine in EU by Key Countries

Demand For Taurine In Eu Cagr Analysis By Country

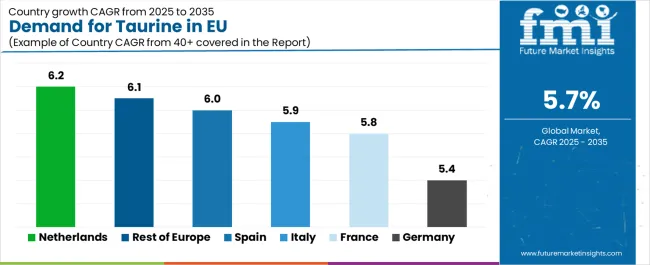
Country CAGR % (2025–2035)
Germany 5.4%
France 5.8%
Italy 5.9%
Spain 6.0%
Netherlands 6.2%
Rest of Europe 6.1%

Germany Leads European Sales with Advanced Pharmaceutical Capacity

Revenue from taurine in Germany is projected to exhibit steady growth with a CAGR of 5.4% through 2035, supported by its world-class pharmaceutical manufacturing base, extensive nutraceutical infrastructure, and established amino acid research and production facilities. Germany’s pharmaceutical and dietary supplement sectors demonstrate a sophisticated understanding of taurine’s physiological value, driving consistent incorporation into pharma-grade formulations, functional supplements, and fortified wellness beverages. The country’s leadership in pharmaceutical innovation, clinical research, and export-oriented ingredient production ensures taurine’s continued role as a critical amino acid supporting both therapeutic and preventive health applications across regulated EU markets.

France Demonstrates Robust Growth with Expanding Nutraceutical Demand

The demand for taurine in France is forecast to grow at a CAGR of 5.8%, supported by expanding nutraceutical production, energy beverage innovation, and rising consumer awareness of amino acid supplementation for wellness and vitality. French nutraceutical companies and beverage producers are increasingly incorporating taurine to enhance functional benefits in performance and mental-focus formulations. The nation’s growing wellness culture and demand for premium, clinically validated supplements are accelerating taurine adoption in capsule, drink, and powder formats. Taurine’s clean-label adaptability and safety record strengthen its appeal among French consumers seeking science-backed, bioavailable functional ingredients for daily nutrition.

Italy Maintains Strong Growth Through Pet Nutrition and Functional Foods

Revenue from taurine in Italy is expanding at a CAGR of 5.9%, underpinned by growth in pet food manufacturing, functional food fortification, and pharmaceutical adoption. Taurine plays a vital role in cat and dog nutrition, driving consistent demand from Italy’s robust pet food industry. The functional food and beverage brands are incorporating taurine into energy snacks, fortified waters, and wellness beverages, reflecting growing consumer interest in health-enhancing amino acids. Italy’s combination of pharmaceutical innovation and pet nutrition leadership ensures taurine maintains a balanced demand profile across multiple industrial segments, from supplement production to veterinary formulations.

Spain Focuses on Beverage and Sports Nutrition Expansion

Demand for taurine in Spain is projected to grow at a CAGR of 6.0%, fueled by the rapid expansion of energy and sports drink markets, nutritional supplement innovation, and increasing youth-oriented wellness consumption. Spanish beverage manufacturers are major taurine consumers, integrating the ingredient into energy formulations, isotonic beverages, and fortified drinks targeting performance and alertness benefits. Retail growth through major chains and e-commerce channels accelerates access to taurine-enriched products. Spain’s fitness and wellness culture, coupled with expanding contract manufacturing capacity, positions the country as a key growth driver for taurine’s commercial utilization in Southern Europe.

Netherlands Strengthens Growth with Innovation and Distribution Leadership

Revenue from taurine in the Netherlands is expected to grow at a CAGR of 6.2%, reflecting its role as a strategic European distribution hub and innovation testing ground for new functional ingredient applications. Dutch companies leverage taurine in dietary supplements, beverages, and export formulations, supported by efficient logistics, advanced R&D infrastructure, and regulatory clarity. The Netherlands’ highly developed nutraceutical trade network and pharmaceutical logistics systems facilitate taurine imports and re-export across the EU. Dutch innovation ecosystems, particularly in clean-label, plant-based, and fermentation-derived taurine, reinforce the country’s position as a leader in next-generation amino acid development.

Rest of Europe Demonstrates Emerging Growth Through Market Development

The Rest of Europe segment is forecast to grow at a CAGR of 6.1%, reflecting taurine’s expanding presence in Central and Eastern European markets, where dietary supplement and pharmaceutical production capacity continues to mature. These emerging markets are increasing taurine imports for integration into energy beverages, over-the-counter products, and pet food formulations. Rising consumer awareness of taurine’s health benefits and government interest in nutrition standardization support long-term adoption. The region’s improving industrial base and alignment with EU quality standards position it as an evolving growth frontier within the broader European taurine landscape.
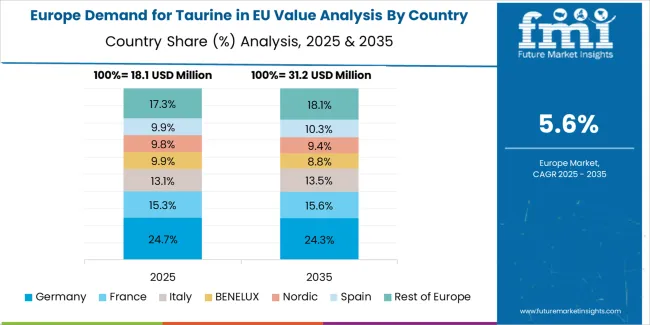
Europe Market Split by Country

Demand For Taurine In Eu Europe Country Market Share Analysis, 2025 & 2035

EU taurine sales are projected to grow from USD 79.2 million in 2025 to USD 137.9 million by 2035, registering a CAGR of 5.7% over the forecast period. Growth will be driven by expanding nutraceutical production, rising pharmaceutical adoption, and energy beverage fortification across major European economies. Germany is expected to demonstrate the strongest growth trajectory, supported by its advanced pharmaceutical manufacturing ecosystem, extensive supplement industry, and well-established amino acid research networks. France follows closely, driven by growing nutraceutical innovation, functional food integration, and expanding consumer awareness of taurine’s health-enhancing and metabolic support benefits.

Germany maintains the largest share at 38.7% in 2025, reflecting its dominance in taurine consumption through pharmaceutical and supplement channels. France holds 30.8%, supported by expanding energy drink and dietary supplement markets. Italy accounts for 17.0%, emphasizing taurine’s role in pet nutrition and fortified foods. Spain represents 10.2%, driven by beverage sector growth, while the Netherlands contributes 3.3%, benefiting from strong distribution and import infrastructure. All major countries maintain an average 5.7% CAGR, underscoring steady, uniform expansion and consistent taurine adoption across the European Union.
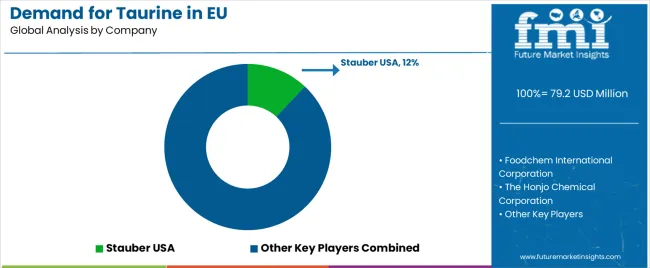
Competitive Landscape

Demand For Taurine In Eu Analysis By Company

The EU taurine market is moderately consolidated and defined by competition among amino acid producers, nutraceutical suppliers, and pharmaceutical-grade manufacturers. Companies focus on bio-fermentation innovation, purity optimization, and strategic distribution alliances to ensure high-quality, sustainable taurine solutions. Leading participants include Ajinomoto Co., Inc. (12%), leveraging its pharmaceutical partnerships, research integration, and extensive European footprint to deliver high-purity taurine across supplements, beverages, and medical formulations. Kyowa Hakko Bio Co., Ltd. (10%) emphasizes biotechnology-based taurine production with superior purity and sustainability credentials, supporting Europe’s clean-label standards. QianjiangYongan Pharmaceutical (8%), a key Chinese exporter, supplies bulk taurine for energy drinks and supplements through cost-efficient, validated channels.

The Honjo Chemical Corporation (5%) supports growth via pharmaceutical collaborations and clinical-grade taurine applications across therapeutic formulations. Remaining participants, collectively holding 65%, include regional distributors, nutraceutical producers, and emerging fermentation startups. These firms compete on regulatory compliance, documentation, and sustainability credentials, reflecting Europe’s demand for transparent, bioavailable, and ethically sourced ingredients. Competitive success increasingly depends on supply reliability, EU pharmacopoeia conformity, and clean-label innovation, positioning taurine as a vital amino acid supporting Europe’s evolving nutraceutical, beverage, and pharmaceutical manufacturing ecosystem.

Key Players

  • Stauber USA
  • Foodchem International Corporation
  • The Honjo Chemical Corporation
  • Qianjiang Yongan Pharmaceutical Co. Ltd.
  • New Zealand Pharmaceutical Ltd.
  • Ajinomoto Co. Inc.
  • Kyowa Hakko Bio Co. Ltd.
  • Jiangsu Yuanyang Chemical Co. Ltd.
  • Funchi Pharmaceutical Co., Ltd.
  • Penta Manufacturing Company
  • Mitsui Chemicals, Inc.
  • AuNutra Industries Inc.

Report Scope

Item Value
Quantitative Units USD 137.9 million
Product Type Food Grade, Pharmaceutical Grade, Feed Grade, Others (Cosmetic/Industrial/Reagent)
Application Dietary Supplements, Beverage (Energy/Caffeinated/Soft), Food (Dairy/Infant/Bakery/Cereal), Pharmaceuticals, Pet Food (Cat/Dog), Pet Supplements, Cosmetics & Personal Care, Animal Feed (Aqua/Poultry), Agriculture
Distribution Channel B2B (Ingredient Supply to Manufacturers), Direct-to-Consumer (D2C), Ingredient Distributors & Wholesalers
Nature Synthetic (Conventional), Plant-based (Bio/Fermentation-derived), Pharmaceutical-grade (GMP-certified)
Countries Covered Germany, France, Italy, Spain, the Netherlands, and the Rest of Europe
Key Companies Profiled Ajinomoto Co., Inc.; Kyowa Hakko Bio Co., Ltd.; QianjiangYongan Pharmaceutical; The Honjo Chemical Corporation; European taurine import distributors; Bio-fermentation technology developers; Nutraceutical formulators
Additional Attributes Dollar sales by grade, application, distribution channel, and nature; regional demand trends across major European economies; competitive landscape analysis with established amino-acid manufacturers and emerging bio-fermentation entrants; buyer preferences for synthetic versus bio-derived taurine; integration with nutraceutical and pharmaceutical formulation workflows; innovations in fermentation-derived taurine and traceability systems; adoption across supplement, beverage, pharmaceutical, and pet-nutrition channels; regulatory framework analysis for amino-acid purity, labeling, and health claims (EFSA/EMA considerations); supply chain strategies including import dependence, European production localization, and inventory/lead-time risk mitigation; penetration analysis for clinical, sports-nutrition, and mainstream consumer segments.

Key Segments

Product Type

  • Food Grade
  • Pharmaceutical Grade
  • Feed Grade
  • Others (Cosmetic/Industrial/Reagent)

Application

  • Dietary Supplements
  • Beverage (Energy/Caffeinated/Soft)
  • Food (Dairy/Infant/Bakery/Cereal)
  • Pharmaceuticals
  • Pet Food (Cat/Dog)
  • Pet Supplements (Cat/Dog)
  • Cosmetics & Personal Care
  • Animal Feed (Aqua/Poultry)
  • Agriculture

Distribution Channel

  • B2B (Ingredient Supply to Manufacturers)
  • Direct-to-Consumer (D2C)
  • Ingredient Distributors & Wholesalers

Nature

  • Synthetic (Conventional)
  • Plant-based (Bio/Fermentation-derived)
  • Pharmaceutical-grade (GMP-certified)

Countries

  • Germany
  • France
  • Italy
  • Spain
  • Netherlands
  • Rest of Europe

Frequently Asked Questions

How big is the demand for taurine in EU in 2025?

The global demand for taurine in EU is estimated to be valued at USD 79.2 million in 2025.

What will be the size of demand for taurine in EU in 2035?

The market size for the demand for taurine in EU is projected to reach USD 137.9 million by 2035.

How much will be the demand for taurine in EU growth between 2025 and 2035?

The demand for taurine in EU is expected to grow at a 5.7% CAGR between 2025 and 2035.

What are the key product types in the demand for taurine in eu?

The key product types in demand for taurine in EU are food grade, pharmaceutical grade, feed grade and others (cosmetic/industrial/reagent).

Which application segment to contribute significant share in the demand for taurine in EU in 2025?

In terms of application, dietary supplements segment to command 24.0% share in the demand for taurine in EU in 2025.

Table of Content

  1. Executive Summary
    • Global Market Outlook
    • Demand to side Trends
    • Supply to side Trends
    • Technology Roadmap Analysis
    • Analysis and Recommendations
  2. Market Overview
    • Market Coverage / Taxonomy
    • Market Definition / Scope / Limitations
  3. Market Background
    • Market Dynamics
      • Drivers
      • Restraints
      • Opportunity
      • Trends
    • Scenario Forecast
      • Demand in Optimistic Scenario
      • Demand in Likely Scenario
      • Demand in Conservative Scenario
    • Opportunity Map Analysis
    • Product Life Cycle Analysis
    • Supply Chain Analysis
    • Investment Feasibility Matrix
    • Value Chain Analysis
    • PESTLE and Porter’s Analysis
    • Regulatory Landscape
    • Regional Parent Market Outlook
    • Production and Consumption Statistics
    • Import and Export Statistics
  4. Global Market Analysis 2020 to 2024 and Forecast, 2025 to 2035
    • Historical Market Size Value (USD Million) Analysis, 2020 to 2024
    • Current and Future Market Size Value (USD Million) Projections, 2025 to 2035
      • Y to o to Y Growth Trend Analysis
      • Absolute $ Opportunity Analysis
  5. Global Market Pricing Analysis 2020 to 2024 and Forecast 2025 to 2035
  6. Global Market Analysis 2020 to 2024 and Forecast 2025 to 2035, By Product Type
    • Introduction / Key Findings
    • Historical Market Size Value (USD Million) Analysis By Product Type , 2020 to 2024
    • Current and Future Market Size Value (USD Million) Analysis and Forecast By Product Type , 2025 to 2035
      • Food Grade
      • Pharmaceutical Grade
      • Feed Grade
      • Others (Cosmetic/Industrial/Reagent)
    • Y to o to Y Growth Trend Analysis By Product Type , 2020 to 2024
    • Absolute $ Opportunity Analysis By Product Type , 2025 to 2035
  7. Global Market Analysis 2020 to 2024 and Forecast 2025 to 2035, By Application
    • Introduction / Key Findings
    • Historical Market Size Value (USD Million) Analysis By Application, 2020 to 2024
    • Current and Future Market Size Value (USD Million) Analysis and Forecast By Application, 2025 to 2035
      • Dietary Supplements
      • Beverage (Energy/Caffeinated/Soft)
      • Food (Dairy/Infant/Bakery/Cereal)
      • Pharmaceuticals
      • Pet Food (Cat/Dog)
      • Pet Supplements (Cat/Dog)
      • Cosmetics & Personal Care
      • Animal Feed (Aqua/Poultry)
      • Agriculture
    • Y to o to Y Growth Trend Analysis By Application, 2020 to 2024
    • Absolute $ Opportunity Analysis By Application, 2025 to 2035
  8. Global Market Analysis 2020 to 2024 and Forecast 2025 to 2035, By Distribution Channel
    • Introduction / Key Findings
    • Historical Market Size Value (USD Million) Analysis By Distribution Channel, 2020 to 2024
    • Current and Future Market Size Value (USD Million) Analysis and Forecast By Distribution Channel, 2025 to 2035
      • B2B (Ingredient Supply to Manufacturers)
      • Direct-to-Consumer (D2C)
      • Ingredient Distributors & Wholesalers
    • Y to o to Y Growth Trend Analysis By Distribution Channel, 2020 to 2024
    • Absolute $ Opportunity Analysis By Distribution Channel, 2025 to 2035
  9. Global Market Analysis 2020 to 2024 and Forecast 2025 to 2035, By Nature
    • Introduction / Key Findings
    • Historical Market Size Value (USD Million) Analysis By Nature, 2020 to 2024
    • Current and Future Market Size Value (USD Million) Analysis and Forecast By Nature, 2025 to 2035
      • Synthetic (Conventional)
      • Plant-based (Bio/Fermentation-derived)
      • Pharmaceutical-grade (GMP-certified)
    • Y to o to Y Growth Trend Analysis By Nature, 2020 to 2024
    • Absolute $ Opportunity Analysis By Nature, 2025 to 2035
  10. Global Market Analysis 2020 to 2024 and Forecast 2025 to 2035, By Region
    • Introduction
    • Historical Market Size Value (USD Million) Analysis By Region, 2020 to 2024
    • Current Market Size Value (USD Million) Analysis and Forecast By Region, 2025 to 2035
      • North America
      • Latin America
      • Western Europe
      • Eastern Europe
      • East Asia
      • South Asia and Pacific
      • Middle East & Africa
    • Market Attractiveness Analysis By Region
  11. North America Market Analysis 2020 to 2024 and Forecast 2025 to 2035, By Country
    • Historical Market Size Value (USD Million) Trend Analysis By Market Taxonomy, 2020 to 2024
    • Market Size Value (USD Million) Forecast By Market Taxonomy, 2025 to 2035
      • By Country
        • USA
        • Canada
        • Mexico
      • By Product Type
      • By Application
      • By Distribution Channel
      • By Nature
    • Market Attractiveness Analysis
      • By Country
      • By Product Type
      • By Application
      • By Distribution Channel
      • By Nature
    • Key Takeaways
  12. Latin America Market Analysis 2020 to 2024 and Forecast 2025 to 2035, By Country
    • Historical Market Size Value (USD Million) Trend Analysis By Market Taxonomy, 2020 to 2024
    • Market Size Value (USD Million) Forecast By Market Taxonomy, 2025 to 2035
      • By Country
        • Brazil
        • Chile
        • Rest of Latin America
      • By Product Type
      • By Application
      • By Distribution Channel
      • By Nature
    • Market Attractiveness Analysis
      • By Country
      • By Product Type
      • By Application
      • By Distribution Channel
      • By Nature
    • Key Takeaways
  13. Western Europe Market Analysis 2020 to 2024 and Forecast 2025 to 2035, By Country
    • Historical Market Size Value (USD Million) Trend Analysis By Market Taxonomy, 2020 to 2024
    • Market Size Value (USD Million) Forecast By Market Taxonomy, 2025 to 2035
      • By Country
        • Germany
        • UK
        • Italy
        • Spain
        • France
        • Nordic
        • BENELUX
        • Rest of Western Europe
      • By Product Type
      • By Application
      • By Distribution Channel
      • By Nature
    • Market Attractiveness Analysis
      • By Country
      • By Product Type
      • By Application
      • By Distribution Channel
      • By Nature
    • Key Takeaways
  14. Eastern Europe Market Analysis 2020 to 2024 and Forecast 2025 to 2035, By Country
    • Historical Market Size Value (USD Million) Trend Analysis By Market Taxonomy, 2020 to 2024
    • Market Size Value (USD Million) Forecast By Market Taxonomy, 2025 to 2035
      • By Country
        • Russia
        • Poland
        • Hungary
        • Balkan & Baltic
        • Rest of Eastern Europe
      • By Product Type
      • By Application
      • By Distribution Channel
      • By Nature
    • Market Attractiveness Analysis
      • By Country
      • By Product Type
      • By Application
      • By Distribution Channel
      • By Nature
    • Key Takeaways
  15. East Asia Market Analysis 2020 to 2024 and Forecast 2025 to 2035, By Country
    • Historical Market Size Value (USD Million) Trend Analysis By Market Taxonomy, 2020 to 2024
    • Market Size Value (USD Million) Forecast By Market Taxonomy, 2025 to 2035
      • By Country
        • China
        • Japan
        • South Korea
      • By Product Type
      • By Application
      • By Distribution Channel
      • By Nature
    • Market Attractiveness Analysis
      • By Country
      • By Product Type
      • By Application
      • By Distribution Channel
      • By Nature
    • Key Takeaways
  16. South Asia and Pacific Market Analysis 2020 to 2024 and Forecast 2025 to 2035, By Country
    • Historical Market Size Value (USD Million) Trend Analysis By Market Taxonomy, 2020 to 2024
    • Market Size Value (USD Million) Forecast By Market Taxonomy, 2025 to 2035
      • By Country
        • India
        • ASEAN
        • Australia & New Zealand
        • Rest of South Asia and Pacific
      • By Product Type
      • By Application
      • By Distribution Channel
      • By Nature
    • Market Attractiveness Analysis
      • By Country
      • By Product Type
      • By Application
      • By Distribution Channel
      • By Nature
    • Key Takeaways
  17. Middle East & Africa Market Analysis 2020 to 2024 and Forecast 2025 to 2035, By Country
    • Historical Market Size Value (USD Million) Trend Analysis By Market Taxonomy, 2020 to 2024
    • Market Size Value (USD Million) Forecast By Market Taxonomy, 2025 to 2035
      • By Country
        • Kingdom of Saudi Arabia
        • Other GCC Countries
        • Turkiye
        • South Africa
        • Other African Union
        • Rest of Middle East & Africa
      • By Product Type
      • By Application
      • By Distribution Channel
      • By Nature
    • Market Attractiveness Analysis
      • By Country
      • By Product Type
      • By Application
      • By Distribution Channel
      • By Nature
    • Key Takeaways
  18. Key Countries Market Analysis
    • USA
      • Pricing Analysis
      • Market Share Analysis, 2024
        • By Product Type
        • By Application
        • By Distribution Channel
        • By Nature
    • Canada
      • Pricing Analysis
      • Market Share Analysis, 2024
        • By Product Type
        • By Application
        • By Distribution Channel
        • By Nature
    • Mexico
      • Pricing Analysis
      • Market Share Analysis, 2024
        • By Product Type
        • By Application
        • By Distribution Channel
        • By Nature
    • Brazil
      • Pricing Analysis
      • Market Share Analysis, 2024
        • By Product Type
        • By Application
        • By Distribution Channel
        • By Nature
    • Chile
      • Pricing Analysis
      • Market Share Analysis, 2024
        • By Product Type
        • By Application
        • By Distribution Channel
        • By Nature
    • Germany
      • Pricing Analysis
      • Market Share Analysis, 2024
        • By Product Type
        • By Application
        • By Distribution Channel
        • By Nature
    • UK
      • Pricing Analysis
      • Market Share Analysis, 2024
        • By Product Type
        • By Application
        • By Distribution Channel
        • By Nature
    • Italy
      • Pricing Analysis
      • Market Share Analysis, 2024
        • By Product Type
        • By Application
        • By Distribution Channel
        • By Nature
    • Spain
      • Pricing Analysis
      • Market Share Analysis, 2024
        • By Product Type
        • By Application
        • By Distribution Channel
        • By Nature
    • France
      • Pricing Analysis
      • Market Share Analysis, 2024
        • By Product Type
        • By Application
        • By Distribution Channel
        • By Nature
    • India
      • Pricing Analysis
      • Market Share Analysis, 2024
        • By Product Type
        • By Application
        • By Distribution Channel
        • By Nature
    • ASEAN
      • Pricing Analysis
      • Market Share Analysis, 2024
        • By Product Type
        • By Application
        • By Distribution Channel
        • By Nature
    • Australia & New Zealand
      • Pricing Analysis
      • Market Share Analysis, 2024
        • By Product Type
        • By Application
        • By Distribution Channel
        • By Nature
    • China
      • Pricing Analysis
      • Market Share Analysis, 2024
        • By Product Type
        • By Application
        • By Distribution Channel
        • By Nature
    • Japan
      • Pricing Analysis
      • Market Share Analysis, 2024
        • By Product Type
        • By Application
        • By Distribution Channel
        • By Nature
    • South Korea
      • Pricing Analysis
      • Market Share Analysis, 2024
        • By Product Type
        • By Application
        • By Distribution Channel
        • By Nature
    • Russia
      • Pricing Analysis
      • Market Share Analysis, 2024
        • By Product Type
        • By Application
        • By Distribution Channel
        • By Nature
    • Poland
      • Pricing Analysis
      • Market Share Analysis, 2024
        • By Product Type
        • By Application
        • By Distribution Channel
        • By Nature
    • Hungary
      • Pricing Analysis
      • Market Share Analysis, 2024
        • By Product Type
        • By Application
        • By Distribution Channel
        • By Nature
    • Kingdom of Saudi Arabia
      • Pricing Analysis
      • Market Share Analysis, 2024
        • By Product Type
        • By Application
        • By Distribution Channel
        • By Nature
    • Turkiye
      • Pricing Analysis
      • Market Share Analysis, 2024
        • By Product Type
        • By Application
        • By Distribution Channel
        • By Nature
    • South Africa
      • Pricing Analysis
      • Market Share Analysis, 2024
        • By Product Type
        • By Application
        • By Distribution Channel
        • By Nature
  19. Market Structure Analysis
    • Competition Dashboard
    • Competition Benchmarking
    • Market Share Analysis of Top Players
      • By Regional
      • By Product Type
      • By Application
      • By Distribution Channel
      • By Nature
  20. Competition Analysis
    • Competition Deep Dive
      • Stauber USA
        • Overview
        • Product Portfolio
        • Profitability by Market Segments (Product/Age /Sales Channel/Region)
        • Sales Footprint
        • Strategy Overview
          • Marketing Strategy
          • Product Strategy
          • Channel Strategy
      • Foodchem International Corporation
      • The Honjo Chemical Corporation
      • Qianjiang Yongan Pharmaceutical Co. Ltd.
      • New Zealand Pharmaceutical Ltd.
      • Ajinomoto Co. Inc.
      • Kyowa Hakko Bio Co. Ltd.
      • Jiangsu Yuanyang Chemical Co. Ltd.
      • Funchi Pharmaceutical Co., Ltd.
      • Penta Manufacturing Company
      • Mitsui Chemicals, Inc.
      • AuNutra Industries Inc.
  21. Assumptions & Acronyms Used
  22. Research Methodology

List of Tables

  • Table 1: Global Market Value (USD Million) Forecast by Region, 2020 to 2035
  • Table 2: Global Market Value (USD Million) Forecast by Product Type , 2020 to 2035
  • Table 3: Global Market Value (USD Million) Forecast by Application, 2020 to 2035
  • Table 4: Global Market Value (USD Million) Forecast by Distribution Channel, 2020 to 2035
  • Table 5: Global Market Value (USD Million) Forecast by Nature, 2020 to 2035
  • Table 6: North America Market Value (USD Million) Forecast by Country, 2020 to 2035
  • Table 7: North America Market Value (USD Million) Forecast by Product Type , 2020 to 2035
  • Table 8: North America Market Value (USD Million) Forecast by Application, 2020 to 2035
  • Table 9: North America Market Value (USD Million) Forecast by Distribution Channel, 2020 to 2035
  • Table 10: North America Market Value (USD Million) Forecast by Nature, 2020 to 2035
  • Table 11: Latin America Market Value (USD Million) Forecast by Country, 2020 to 2035
  • Table 12: Latin America Market Value (USD Million) Forecast by Product Type , 2020 to 2035
  • Table 13: Latin America Market Value (USD Million) Forecast by Application, 2020 to 2035
  • Table 14: Latin America Market Value (USD Million) Forecast by Distribution Channel, 2020 to 2035
  • Table 15: Latin America Market Value (USD Million) Forecast by Nature, 2020 to 2035
  • Table 16: Western Europe Market Value (USD Million) Forecast by Country, 2020 to 2035
  • Table 17: Western Europe Market Value (USD Million) Forecast by Product Type , 2020 to 2035
  • Table 18: Western Europe Market Value (USD Million) Forecast by Application, 2020 to 2035
  • Table 19: Western Europe Market Value (USD Million) Forecast by Distribution Channel, 2020 to 2035
  • Table 20: Western Europe Market Value (USD Million) Forecast by Nature, 2020 to 2035
  • Table 21: Eastern Europe Market Value (USD Million) Forecast by Country, 2020 to 2035
  • Table 22: Eastern Europe Market Value (USD Million) Forecast by Product Type , 2020 to 2035
  • Table 23: Eastern Europe Market Value (USD Million) Forecast by Application, 2020 to 2035
  • Table 24: Eastern Europe Market Value (USD Million) Forecast by Distribution Channel, 2020 to 2035
  • Table 25: Eastern Europe Market Value (USD Million) Forecast by Nature, 2020 to 2035
  • Table 26: East Asia Market Value (USD Million) Forecast by Country, 2020 to 2035
  • Table 27: East Asia Market Value (USD Million) Forecast by Product Type , 2020 to 2035
  • Table 28: East Asia Market Value (USD Million) Forecast by Application, 2020 to 2035
  • Table 29: East Asia Market Value (USD Million) Forecast by Distribution Channel, 2020 to 2035
  • Table 30: East Asia Market Value (USD Million) Forecast by Nature, 2020 to 2035
  • Table 31: South Asia and Pacific Market Value (USD Million) Forecast by Country, 2020 to 2035
  • Table 32: South Asia and Pacific Market Value (USD Million) Forecast by Product Type , 2020 to 2035
  • Table 33: South Asia and Pacific Market Value (USD Million) Forecast by Application, 2020 to 2035
  • Table 34: South Asia and Pacific Market Value (USD Million) Forecast by Distribution Channel, 2020 to 2035
  • Table 35: South Asia and Pacific Market Value (USD Million) Forecast by Nature, 2020 to 2035
  • Table 36: Middle East & Africa Market Value (USD Million) Forecast by Country, 2020 to 2035
  • Table 37: Middle East & Africa Market Value (USD Million) Forecast by Product Type , 2020 to 2035
  • Table 38: Middle East & Africa Market Value (USD Million) Forecast by Application, 2020 to 2035
  • Table 39: Middle East & Africa Market Value (USD Million) Forecast by Distribution Channel, 2020 to 2035
  • Table 40: Middle East & Africa Market Value (USD Million) Forecast by Nature, 2020 to 2035

List of Figures

  • Figure 1: Global Market Pricing Analysis
  • Figure 2: Global Market Value (USD Million) Forecast 2020-2035
  • Figure 3: Global Market Value Share and BPS Analysis by Product Type , 2025 and 2035
  • Figure 4: Global Market Y to o to Y Growth Comparison by Product Type , 2025-2035
  • Figure 5: Global Market Attractiveness Analysis by Product Type
  • Figure 6: Global Market Value Share and BPS Analysis by Application, 2025 and 2035
  • Figure 7: Global Market Y to o to Y Growth Comparison by Application, 2025-2035
  • Figure 8: Global Market Attractiveness Analysis by Application
  • Figure 9: Global Market Value Share and BPS Analysis by Distribution Channel, 2025 and 2035
  • Figure 10: Global Market Y to o to Y Growth Comparison by Distribution Channel, 2025-2035
  • Figure 11: Global Market Attractiveness Analysis by Distribution Channel
  • Figure 12: Global Market Value Share and BPS Analysis by Nature, 2025 and 2035
  • Figure 13: Global Market Y to o to Y Growth Comparison by Nature, 2025-2035
  • Figure 14: Global Market Attractiveness Analysis by Nature
  • Figure 15: Global Market Value (USD Million) Share and BPS Analysis by Region, 2025 and 2035
  • Figure 16: Global Market Y to o to Y Growth Comparison by Region, 2025-2035
  • Figure 17: Global Market Attractiveness Analysis by Region
  • Figure 18: North America Market Incremental Dollar Opportunity, 2025-2035
  • Figure 19: Latin America Market Incremental Dollar Opportunity, 2025-2035
  • Figure 20: Western Europe Market Incremental Dollar Opportunity, 2025-2035
  • Figure 21: Eastern Europe Market Incremental Dollar Opportunity, 2025-2035
  • Figure 22: East Asia Market Incremental Dollar Opportunity, 2025-2035
  • Figure 23: South Asia and Pacific Market Incremental Dollar Opportunity, 2025-2035
  • Figure 24: Middle East & Africa Market Incremental Dollar Opportunity, 2025-2035
  • Figure 25: North America Market Value Share and BPS Analysis by Country, 2025 and 2035
  • Figure 26: North America Market Value Share and BPS Analysis by Product Type , 2025 and 2035
  • Figure 27: North America Market Y to o to Y Growth Comparison by Product Type , 2025-2035
  • Figure 28: North America Market Attractiveness Analysis by Product Type
  • Figure 29: North America Market Value Share and BPS Analysis by Application, 2025 and 2035
  • Figure 30: North America Market Y to o to Y Growth Comparison by Application, 2025-2035
  • Figure 31: North America Market Attractiveness Analysis by Application
  • Figure 32: North America Market Value Share and BPS Analysis by Distribution Channel, 2025 and 2035
  • Figure 33: North America Market Y to o to Y Growth Comparison by Distribution Channel, 2025-2035
  • Figure 34: North America Market Attractiveness Analysis by Distribution Channel
  • Figure 35: North America Market Value Share and BPS Analysis by Nature, 2025 and 2035
  • Figure 36: North America Market Y to o to Y Growth Comparison by Nature, 2025-2035
  • Figure 37: North America Market Attractiveness Analysis by Nature
  • Figure 38: Latin America Market Value Share and BPS Analysis by Country, 2025 and 2035
  • Figure 39: Latin America Market Value Share and BPS Analysis by Product Type , 2025 and 2035
  • Figure 40: Latin America Market Y to o to Y Growth Comparison by Product Type , 2025-2035
  • Figure 41: Latin America Market Attractiveness Analysis by Product Type
  • Figure 42: Latin America Market Value Share and BPS Analysis by Application, 2025 and 2035
  • Figure 43: Latin America Market Y to o to Y Growth Comparison by Application, 2025-2035
  • Figure 44: Latin America Market Attractiveness Analysis by Application
  • Figure 45: Latin America Market Value Share and BPS Analysis by Distribution Channel, 2025 and 2035
  • Figure 46: Latin America Market Y to o to Y Growth Comparison by Distribution Channel, 2025-2035
  • Figure 47: Latin America Market Attractiveness Analysis by Distribution Channel
  • Figure 48: Latin America Market Value Share and BPS Analysis by Nature, 2025 and 2035
  • Figure 49: Latin America Market Y to o to Y Growth Comparison by Nature, 2025-2035
  • Figure 50: Latin America Market Attractiveness Analysis by Nature
  • Figure 51: Western Europe Market Value Share and BPS Analysis by Country, 2025 and 2035
  • Figure 52: Western Europe Market Value Share and BPS Analysis by Product Type , 2025 and 2035
  • Figure 53: Western Europe Market Y to o to Y Growth Comparison by Product Type , 2025-2035
  • Figure 54: Western Europe Market Attractiveness Analysis by Product Type
  • Figure 55: Western Europe Market Value Share and BPS Analysis by Application, 2025 and 2035
  • Figure 56: Western Europe Market Y to o to Y Growth Comparison by Application, 2025-2035
  • Figure 57: Western Europe Market Attractiveness Analysis by Application
  • Figure 58: Western Europe Market Value Share and BPS Analysis by Distribution Channel, 2025 and 2035
  • Figure 59: Western Europe Market Y to o to Y Growth Comparison by Distribution Channel, 2025-2035
  • Figure 60: Western Europe Market Attractiveness Analysis by Distribution Channel
  • Figure 61: Western Europe Market Value Share and BPS Analysis by Nature, 2025 and 2035
  • Figure 62: Western Europe Market Y to o to Y Growth Comparison by Nature, 2025-2035
  • Figure 63: Western Europe Market Attractiveness Analysis by Nature
  • Figure 64: Eastern Europe Market Value Share and BPS Analysis by Country, 2025 and 2035
  • Figure 65: Eastern Europe Market Value Share and BPS Analysis by Product Type , 2025 and 2035
  • Figure 66: Eastern Europe Market Y to o to Y Growth Comparison by Product Type , 2025-2035
  • Figure 67: Eastern Europe Market Attractiveness Analysis by Product Type
  • Figure 68: Eastern Europe Market Value Share and BPS Analysis by Application, 2025 and 2035
  • Figure 69: Eastern Europe Market Y to o to Y Growth Comparison by Application, 2025-2035
  • Figure 70: Eastern Europe Market Attractiveness Analysis by Application
  • Figure 71: Eastern Europe Market Value Share and BPS Analysis by Distribution Channel, 2025 and 2035
  • Figure 72: Eastern Europe Market Y to o to Y Growth Comparison by Distribution Channel, 2025-2035
  • Figure 73: Eastern Europe Market Attractiveness Analysis by Distribution Channel
  • Figure 74: Eastern Europe Market Value Share and BPS Analysis by Nature, 2025 and 2035
  • Figure 75: Eastern Europe Market Y to o to Y Growth Comparison by Nature, 2025-2035
  • Figure 76: Eastern Europe Market Attractiveness Analysis by Nature
  • Figure 77: East Asia Market Value Share and BPS Analysis by Country, 2025 and 2035
  • Figure 78: East Asia Market Value Share and BPS Analysis by Product Type , 2025 and 2035
  • Figure 79: East Asia Market Y to o to Y Growth Comparison by Product Type , 2025-2035
  • Figure 80: East Asia Market Attractiveness Analysis by Product Type
  • Figure 81: East Asia Market Value Share and BPS Analysis by Application, 2025 and 2035
  • Figure 82: East Asia Market Y to o to Y Growth Comparison by Application, 2025-2035
  • Figure 83: East Asia Market Attractiveness Analysis by Application
  • Figure 84: East Asia Market Value Share and BPS Analysis by Distribution Channel, 2025 and 2035
  • Figure 85: East Asia Market Y to o to Y Growth Comparison by Distribution Channel, 2025-2035
  • Figure 86: East Asia Market Attractiveness Analysis by Distribution Channel
  • Figure 87: East Asia Market Value Share and BPS Analysis by Nature, 2025 and 2035
  • Figure 88: East Asia Market Y to o to Y Growth Comparison by Nature, 2025-2035
  • Figure 89: East Asia Market Attractiveness Analysis by Nature
  • Figure 90: South Asia and Pacific Market Value Share and BPS Analysis by Country, 2025 and 2035
  • Figure 91: South Asia and Pacific Market Value Share and BPS Analysis by Product Type , 2025 and 2035
  • Figure 92: South Asia and Pacific Market Y to o to Y Growth Comparison by Product Type , 2025-2035
  • Figure 93: South Asia and Pacific Market Attractiveness Analysis by Product Type
  • Figure 94: South Asia and Pacific Market Value Share and BPS Analysis by Application, 2025 and 2035
  • Figure 95: South Asia and Pacific Market Y to o to Y Growth Comparison by Application, 2025-2035
  • Figure 96: South Asia and Pacific Market Attractiveness Analysis by Application
  • Figure 97: South Asia and Pacific Market Value Share and BPS Analysis by Distribution Channel, 2025 and 2035
  • Figure 98: South Asia and Pacific Market Y to o to Y Growth Comparison by Distribution Channel, 2025-2035
  • Figure 99: South Asia and Pacific Market Attractiveness Analysis by Distribution Channel
  • Figure 100: South Asia and Pacific Market Value Share and BPS Analysis by Nature, 2025 and 2035
  • Figure 101: South Asia and Pacific Market Y to o to Y Growth Comparison by Nature, 2025-2035
  • Figure 102: South Asia and Pacific Market Attractiveness Analysis by Nature
  • Figure 103: Middle East & Africa Market Value Share and BPS Analysis by Country, 2025 and 2035
  • Figure 104: Middle East & Africa Market Value Share and BPS Analysis by Product Type , 2025 and 2035
  • Figure 105: Middle East & Africa Market Y to o to Y Growth Comparison by Product Type , 2025-2035
  • Figure 106: Middle East & Africa Market Attractiveness Analysis by Product Type
  • Figure 107: Middle East & Africa Market Value Share and BPS Analysis by Application, 2025 and 2035
  • Figure 108: Middle East & Africa Market Y to o to Y Growth Comparison by Application, 2025-2035
  • Figure 109: Middle East & Africa Market Attractiveness Analysis by Application
  • Figure 110: Middle East & Africa Market Value Share and BPS Analysis by Distribution Channel, 2025 and 2035
  • Figure 111: Middle East & Africa Market Y to o to Y Growth Comparison by Distribution Channel, 2025-2035
  • Figure 112: Middle East & Africa Market Attractiveness Analysis by Distribution Channel
  • Figure 113: Middle East & Africa Market Value Share and BPS Analysis by Nature, 2025 and 2035
  • Figure 114: Middle East & Africa Market Y to o to Y Growth Comparison by Nature, 2025-2035
  • Figure 115: Middle East & Africa Market Attractiveness Analysis by Nature
  • Figure 116: Global Market - Tier Structure Analysis
  • Figure 117: Global Market - Company Share Analysis
Dashboard
Dashboard
Dashboard
Dashboard
Dashboard
Dashboard

Full Research Suite comprises of:

Market outlook & trends analysis

Market outlook & trends analysis

Interviews & case studies

Interviews & case studies

Strategic recommendations

Strategic recommendations

Vendor profiles & capabilities analysis

Vendor profiles & capabilities analysis

5-year forecasts

5-year forecasts

8 regions and 60+ country-level data splits

8 regions and 60+ country-level data splits

Market segment data splits

Market segment data splits

12 months of continuous data updates

12 months of continuous data updates

DELIVERED AS:

PDF EXCEL ONLINE

Full Research Suite


$3500

$5000

$6500

Buy Report Now
Similar Industry Reports

Similar Industry Reports

Demand Signal Repository Solutions Market

Demand Signal Repository Solutions Market Size and Share Forecast Outlook 2025 to 2035

Demand Side Management Market

Demand Side Management Market Size and Share Forecast Outlook 2025 to 2035

Demand Response Market

Demand Response Market Analysis - Size, Share, and Forecast Outlook 2025 to 2035

Demand Analysis of Shipping Supplies in North America

North America Shipping Supplies Market Trends – Innovations & Growth 2024-2034

Demand of Kozani Saffron in Greece

Demand of Kozani Saffron in Greece Analysis - Size, Share & Forecast 2025 to 2035

Demand of No-acid Whey Strained Dairy Processing Concepts

Demand of No-acid Whey Strained Dairy Processing Concepts in European Union Size and Share Forecast Outlook 2025 to 2035

Demand of Bronte Pistachio in Italy

Demand for Bronte Pistachio in Italy Analysis - Size, Share & Forecast 2025 to 2035

Demand and Trend Analysis of Gaming Monitor in Japan

Demand and Trend Analysis of Gaming Monitor in Japan Size and Share Forecast Outlook 2025 to 2035

Demand and Trend Analysis of Gaming Monitor in Korea

Demand and Trend Analysis of Gaming Monitor in Korea Size and Share Forecast Outlook 2025 to 2035

Demand and Trend Analysis of Gaming Monitor in Western Europe

Demand and Trend Analysis of Gaming Monitor in Western Europe Size and Share Forecast Outlook 2025 to 2035

Demand and Trend Analysis of Glycine Soja (Soybean) Seed Extract Market

Glycine Soja (Soybean) Seed Extract Market Size and Share Forecast Outlook 2025 to 2035

Demand and Trend Analysis of Yeast in Japan

Demand and Trend Analysis of Yeast in Japan - Size, Share, and Forecast Outlook 2025 to 2035

Demand and Trends Analysis of Stevia in Japan

Demand and Trends Analysis of Stevia in Japan Size and Share Forecast Outlook 2025 to 2035

Demand of Pistachio-based desserts & ingredients in France

Demand of Pistachio-based desserts & ingredients in France Analysis - Size, Share & Forecast 2025 to 2035

Demand and Trend Analysis of Women’s Intimate Care Product in Japan

Japan Women’s Intimate Care Market Trends – Growth & Forecast 2024-2034

Demand and Trend Analysis of Men’s Skincare Product in Western Europe

Western Europe Men’s Skincare Market Analysis – Forecast 2023-2033

Demand and Trend Analysis of Fabric Stain Remover in Korea

Demand and Trend Analysis of Fabric Stain Remover in Korea Size and Share Forecast Outlook 2025 to 2035

Demand and Sales Analysis of Paper Cup in Japan

Demand and Sales Analysis of Paper Cup in Japan Size and Share Forecast Outlook 2025 to 2035

Demand and Sales Analysis of Paper Cup in Korea

Demand and Sales Analysis of Paper Cup in Korea Size and Share Forecast Outlook 2025 to 2035

Demand of MFGM-enriched Powders & RTDs in European Union

Demand of MFGM-enriched Powders & RTDs in European Union Size and Share Forecast Outlook 2025 to 2035

Future Market Insights

Demand for Taurine in EU

Chat With MaRIA

Chat With

MaRIA

Hi There, I am MaRIA, Your Market Research Intelligence Assistant. How may I help you?