Methodology

Europium Market Size and Share Forecast Outlook 2025 to 2035

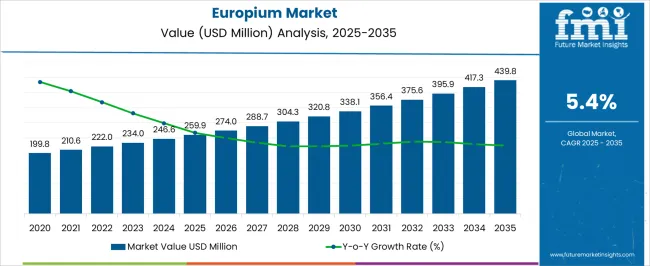
The Europium Market is estimated to be valued at USD 259.9 million in 2025 and is projected to reach USD 439.8 million by 2035, registering a compound annual growth rate (CAGR) of 5.4% over the forecast period.

The europium market is experiencing steady expansion driven by its critical role in advanced electronics, lighting technologies, and renewable energy systems. Demand growth is being supported by the rising production of high-definition displays, energy-efficient lighting, and specialized optical materials. Current market conditions reflect stable supply from key mining regions and increasing investment in rare earth separation technologies that enhance purity and recovery efficiency.

Manufacturers are focusing on optimizing processing methods and securing long-term sourcing agreements to mitigate raw material volatility. The future outlook is positive as global electrification and the shift toward sustainable technologies continue to expand europium applications in phosphors, semiconductors, and magnetic materials.

Growth rationale is founded on its irreplaceable luminescent properties, growing use in smart devices, and integration into next-generation display and lighting solutions These factors are expected to sustain long-term demand momentum, ensuring stable market performance supported by technological innovation and supply chain strengthening initiatives.
Quick Stats for Europium Market

  • Europium Market Industry Value (2025): USD 259.9 million
  • Europium Market Forecast Value (2035): USD 439.8 million
  • Europium Market Forecast CAGR: 5.4%
  • Leading Segment in Europium Market in 2025: Consumer Electronics (29.4%)
  • Key Growth Region in Europium Market: North America, Asia-Pacific, Europe
  • Top Key Players in Europium Market: Lynas Rare Earths Ltd, Avalon Rare Metals Inc., Molycorp, Minmetals Corporation, Baotou Steel Rare-Earth, Xiamen Tungsten, Great Western Minerals Group Ltd.

Europium Market Market Value Analysis

Metric Value
Europium Market Estimated Value in (2025 E) USD 259.9 million
Europium Market Forecast Value in (2035 F) USD 439.8 million
Forecast CAGR (2025 to 2035) 5.4%

Segmental Analysis

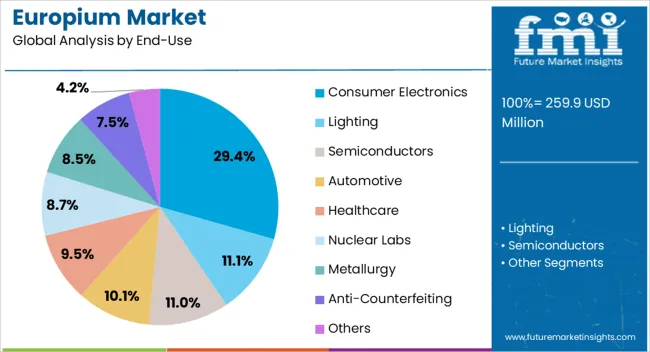
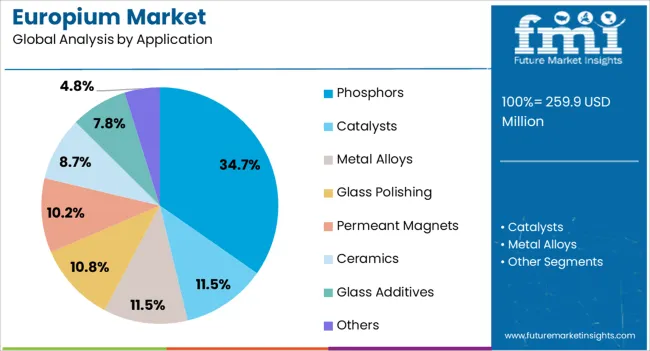
The market is segmented by End-Use and Application and region. By End-Use, the market is divided into Consumer Electronics, Lighting, Semiconductors, Automotive, Healthcare, Nuclear Labs, Metallurgy, Anti-Counterfeiting, and Others. In terms of Application, the market is classified into Phosphors, Catalysts, Metal Alloys, Glass Polishing, Permeant Magnets, Ceramics, Glass Additives, and Others. Regionally, the market is classified into North America, Latin America, Western Europe, Eastern Europe, Balkan & Baltic Countries, Russia & Belarus, Central Asia, East Asia, South Asia & Pacific, and the Middle East & Africa.
Insights into the End-Use Segment

Europium Market Analysis By End Use

The consumer electronics segment, holding 29.40% of the end-use category, has been leading due to consistent demand for europium in display panels, LED screens, and high-efficiency lighting devices. Its application in enhancing color brightness and image clarity has reinforced its importance across televisions, smartphones, and computer monitors.

Increasing global penetration of smart consumer devices has contributed to steady market consumption. Production advancements in electronic components have improved material utilization efficiency, reducing waste and optimizing yield.

The segment’s growth is being further supported by sustained investments in display technologies and the expanding mid-range electronics market in Asia-Pacific Continuous technological upgrades and rising consumer preference for enhanced visual quality are expected to maintain europium’s critical role within consumer electronics manufacturing over the coming years.
Insights into the Application Segment

Europium Market Analysis By Application

The phosphors segment, accounting for 34.70% of the application category, has maintained dominance due to europium’s unique luminescent characteristics that make it essential for red and blue phosphor production. Its extensive use in LED lighting, flat-panel displays, and fluorescent lamps has secured consistent industrial demand.

Technological progress in phosphor formulations has improved brightness, color accuracy, and energy efficiency, enhancing product performance across end-use sectors. Supply chain integration and refinement of rare earth separation processes have ensured reliable availability of high-purity europium, supporting consistent production output.

As global initiatives for energy conservation and smart lighting adoption accelerate, the demand for europium-based phosphors is projected to remain strong Future growth will be reinforced by expanding LED manufacturing capacity and the continuous evolution of next-generation display and illumination technologies.

Key Industry Highlights

Impact of Technological Advancements on Europium Demand

Advancement in technology is set to unlock entirely new applications for europium in the sector, thereby driving demand for the rare earth metal. Small rare metal-based magnets are projected to be utilized in electronic devices with the miniaturization in technology. This is projected to create new opportunities for use even if the total rare metal used per device decreases.

Rapid innovations in the consumer electronics sector, LED market growth, and shift toward energy-efficient lighting solutions are further increasing demand. The metal is set to be used in phosphors to create the red color in devices and enhance color rendering and brightness.

The rare metal is anticipated to play a key role in the luminescence of compounds used in X-ray imaging. The chemical is also projected to be used for the development of fluorescent markers for biological research. As a result, these applications rely on the stable luminescence properties of this rare metal to provide clear and precise images.

Government Policies Promoting Domestic Europium Production

Government policies play a significant role in promoting domestic production of rare earth metals. China is a dominant player in the rare earth element (REE) market. The country’s government has consolidated the mining and processing industry to deploy greater control and potentially streamline production.

The country has further implemented stringent environmental regulations for the mining of these rare earth metals. This is set to potentially lead to an increase in production costs but is anticipated to promote sustainable practices.

China holds significant control of the global REE exports. The country can, hence, use export quotas or restrictions to influence REE prices worldwide, potentially benefiting domestic producers.

The United States has various government policies and regulations affecting the europium sector. The country maintains a stockpile of REEs for strategic purposes, which can potentially influence market dynamics.

As the United States aims to reduce reliance on China for raw materials like REEs, the nation's government is funding exploration and research efforts to identify domestic deposits. The country is also offering tax breaks or subsidies to companies investing in domestic REE mining and processing facilities.

Other countries like Australia, Vietnam, and Canada have established REE mines and exploration projects. Governments of these nations are anticipated to provide exploration permits to attract investment in REE exploration and development.

Mixed Impact of Artificial Intelligence on Europium Demand

Growth of artificial intelligence (AI) has a positive impact on the demand for rare metals. Integration of AI in consumer electronics, autonomous vehicles, telecommunications, and AI hardware necessitates the utilization of this rare metal in production processes. As AI technologies become more widespread, demand is expected to continue growing.

Advancements in AI-powered automation and optimization in manufacturing processes can result in increased production efficiency. This can also lead to the development of new products that are set to be reliant on rare metals, thereby creating entirely new sectors for the element.

AI also has the potential to accelerate advancements in material sciences. These developments can potentially result in more efficient use of the rare metal and growth of nanomaterials.

Artificial intelligence, however, can cause a declining demand for this earth metal by identifying alternative materials. This can also be caused by optimizing the performance of substitutes and improving recycling techniques, thereby reducing the need for virgin chemical elements.

2020 to 2025 Global Europium Sales Analysis Compared to Demand Forecast for 2025 to 2035

The global sales of europium witnessed a CAGR of 3.4% between 2020 to 2025. The europium market size at the end of 2025 reached USD 235.6 million. Growth during the historical period was driven by the emergence of green technologies.

Increasing adoption of permanent magnets containing this rare metal in electric vehicles (EVs) and wind turbines has greatly contributed to high sales.

The historical period also witnessed increasing use of LEDs and displays that relied on europium-based red phosphors for efficient lighting and vibrant colors. Exploration of this rare metal in biotechnologies also created new pockets for demand.

Industry reports on the europium market have predicted a CAGR of 5.4% from 2025 to 2035. Factors that have driven growth of the industry in the past are expected to continue influencing future demand. A prominent driver for growth includes the rising demand for this earth metal in developing countries.

There is an increasing demand for high-resolution displays worldwide. This demand is boosting the need for europium-based phosphors in the industry.

There is continuous development and adoption in the field of electric vehicles, wind turbines, and other green technologies that highly rely on rare metal-based magnets. Ongoing technological advancements in nano-crystals and LED is projected to be one of the europium market trends for the next decade.

Country-wise Insights

The section below depicts the sector’s forecast across leading countries. The section aims to evaluate drivers, restraints, and market trends impacting europium industry to help firms understand investment opportunities in the europium market.

India and China will likely experience high growth rates, thereby providing more development prospects to the industry. With a CAGR of 8.1%, India is set to dominate in the assessment period.

China is following behind with a CAGR of 6.1%. This makes Asia Pacific the leading region in terms of consumption and output. Key companies in Europe involved in the extraction and processing of these rare metals and derivatives are projected to bolster demand.

Leading players are consistently investing in research and development activities to innovate and develop new applications for the earth metal. The focus is on taking proactive measures to foster innovation that will drive growth while ensuring sustainable operations in the industry.

Countries CAGR 2025 to 2035
Canada 3.3%
Italy 3.5%
Spain 4.1%
China 6.1%
India 8.1%

India’s Growing Consumer Electronics Sector Pushing Demand

India is a rapidly growing economy. Constant improvements in living standards have led to increasing disposable incomes, which have resulted in high consumption of products. The consumer electronics sector is progressively developing, thereby increasing the need for smartphones, smart televisions, gadgets, and wearables.

Europium is anticipated to be used in consumer electronics due to phosphorescent properties, thereby pushing demand. The role of recycling in the europium market across India is projected to be significant.

The country has a significant presence of industries that have applications for this earth metal. The Indian government is also taking initiatives to develop a novel REE industry, including the exploration of domestic deposits.

The Free Trade Agreement between India and the European Union (EU) is also expected to boost growth. India, however, faces tough competition from other countries that are developing REE industries.

Increasing Mining Activities in China to Fuel Sales

China is a dominant consumer of REEs. The country has a long-standing history due to the geographic distribution of europium reserves and mining activity, giving a strong leverage.

Increasing population and improving living standards further contribute to a high demand for products that use this rare metal. Like most countries in Asia Pacific, China has a growing demand for consumer electronics, fueling the sector.

China is also one of the most prominent manufacturers of europium and derivatives, thereby enabling a steady supply of this earth metal within the country. The country has strong relations with the EU, another significant region for the rare metal. This increases the chances of potential trade and investment, further augmenting growth.

Italy’s Green Transition Initiatives to Augment Demand

Italy stands in the fourth position in Europe and ranks among the prominent export countries worldwide. The country’s economic strength fuels demand for products that use this earth metal.

The prime exporting industry in Italy is that of machinery and equipment. The rare metal is a critical component in several machinery and electronic devices, thereby propelling demand in the country. The future of the europium market in a sustainable economy across Italy seems to be bright.

The country is further transitioning toward a green economy. Hence, demand for EVs and wind turbines is rapidly increasing. Both machineries use rare earth metal-based magnets.

Research institutions in Italy are progressively exploring new applications for this earth metal. The potential for increased trade and investment owing to the country’s strong relations with the EU could further boost the industry.

Category-wise Insights

The section below sheds light on the leading segments in the europium sector. The section has details regarding the anticipated growth rates of the divisions through the forecast period, helping companies identify the dominating categories and invest accordingly.

Based on application, phosphors are leading with a value share of 24.4% in 2025. By end-use, lighting is dominating, with a value share of 26.3% in 2025.

Demand for Phosphors to Rise Amid Use in LED Displays and Lighting

Segment Phosphors (Application)
Value Share (2025) 24.4%

Based on application, phosphors are dominating the industry with a value share of 24.4% in 2025. The segment is expected to witness rapid growth in the next decade.

This is attributed to widespread use in displays and lighting. Phosphors are a key component in numerous display and lighting technologies, such as LED displays and fluorescent lighting, which are pushing sales.

Phosphors also boast efficient light emission properties. This earth metal has a distinct emission spectrum that displays a strong red peak. Europium-based phosphors efficiently convert UV light into red light, thereby minimizing energy waste.

The rare metal also has a special ability to emit bright colors under certain conditions, making it an essential component in security features and other surveillance products. The growing use of europium-based phosphors in display and lighting, coupled with efficient light-emitting properties, makes these a dominant application.

Increasing Trend for Decorative Lighting Creates New Opportunities

Segment Lighting (End-use)
Value Share (2025) 26.3%

Based on end-use, lighting is leading with a value share of 26.3% in 2025. The segment is anticipated to experience substantial growth in the next ten years.

Global transition toward energy-efficient solutions has increased the significance of this rare metal’s contribution to LED and OLED. The ‘home sweet home’ trend is significantly contributing to surging demand for decorative lighting to enhance the ambiance of homes.

The use of europium nano-crystals in LEDs has created a shift from traditional lighting to solid-state lighting systems in displays, thereby fueling demand for flat panel displays and LEDs. The trend to phase out conventional lighting products from public buildings, offices, and train stations will likely continue, augmenting demand.
Competition Outlook

Europium Market Analysis By Company

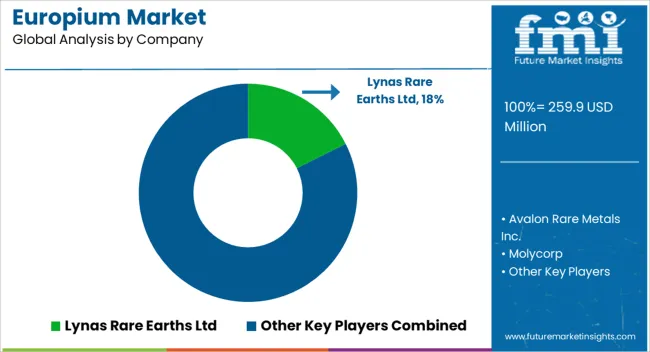
The europium industry has a dynamic competitive landscape. Key players, including Avalon Rare Metals Inc., Molycorp, Lynas Rare Earths Ltd, Minmetals Corporation, Baotou Steel Rare-Earth, Xiamen Tungsten, and Great Western Minerals Group Ltd., are implementing several strategies to stay ahead in the competition. This high competition between REE producers can potentially lead to constant price fluctuations.

China is currently the dominant country for REE due to a well-established mining and processing infrastructure. Several countries are trying to minimize dependence on China by establishing new REE production units.

New producers will emerge, but the country is anticipated to hold a significant position. Life cycle assessment of europium compared to alternatives is another strategy of leading companies.

Companies are directing investments toward research and development to innovate efficient and cost-effective applications for rare earth metals. Strategic partnerships and collaborations help key players to capitalize on collective expertise, share resources, and expedite product development.

Many companies are progressively focusing on expanding presence in regions that have high demand for this chemical element. Product diversification is a consistent trend that companies are adopting to provide europium-based items tailored to specific applications.

Key companies are also set to gain investment opportunities in the europium market by focusing on environmentally friendly mining and processing practices to meet the regulatory requirements. A few players are taking proactive measures to propel growth, foster innovation, and uphold sustainable practices in the industry.

Industry Updates

  • Priya Agrawal Hebbar, Chairperson of Udaipur-based Hindustan Zinc, subsidized by Vedanta Group, spoke at the Bank of America Securities Global Metals, Mining and Steel Conference 2025 in Miami. She stated that India is on a mission to become the world’s prominent and most sustainable producer of critical minerals. The company is set to play a key role in the production of clean energy technologies.
  • In May 2025, Huang Changgeng, Chairman of Xiamen Tungsten Co., Ltd. (XTC), headquartered in Fujian, revealed details of the company's joint venture with France-based Orano SA. The companies are anticipated to drive cooperation in green technologies between the two nations.
  • In April 2025, MMG Limited, a subsidiary company of Minmetals Corporation headquartered in Beijing, finalized the acquisition of Khoemacau Copper Mine in Botswana.

Leading Europium Brands

  • Avalon Rare Metals Inc.
  • Molycorp
  • Lynas Rare Earths Ltd
  • Minmetals Corporation
  • Baotou Steel Rare-Earth
  • Xiamen Tungsten
  • Great Western Minerals Group Ltd.

Key Segments of Market Report

By End-use:

By end-use, the sector is divided into consumer electronics, lighting, semiconductors, automotive, healthcare, nuclear labs, metallurgy, anti-counterfeiting, and others.

By Application:

By application, the europium market is segmented into catalysts, metal alloys, glass polishing, permeant magnets, phosphors, ceramics, glass additives, and others.

By Region:

Based on region, the sector is spread across North America, Latin America, Western Europe, South Asia, East Asia, Eastern Europe, and the Middle East and Africa.

Frequently Asked Questions

How big is the europium market in 2025?

The global europium market is estimated to be valued at USD 259.9 million in 2025.

What will be the size of europium market in 2035?

The market size for the europium market is projected to reach USD 439.8 million by 2035.

How much will be the europium market growth between 2025 and 2035?

The europium market is expected to grow at a 5.4% CAGR between 2025 and 2035.

What are the key product types in the europium market?

The key product types in europium market are consumer electronics, lighting, semiconductors, automotive, healthcare, nuclear labs, metallurgy, anti-counterfeiting and others.

Which application segment to contribute significant share in the europium market in 2025?

In terms of application, phosphors segment to command 34.7% share in the europium market in 2025.

Table of Content

  1. Executive Summary
    • Global Market Outlook
    • Demand-side Trends
    • Supply-side Trends
    • Technology Roadmap Analysis
    • Analysis and Recommendations
  2. Market Overview
    • Market Coverage / Taxonomy
    • Market Definition / Scope / Limitations
  3. Market Background
    • Market Dynamics
      • Drivers
      • Restraints
      • Opportunity
      • Trends
    • Scenario Forecast
      • Demand in Optimistic Scenario
      • Demand in Likely Scenario
      • Demand in Conservative Scenario
    • Opportunity Map Analysis
    • Product Life Cycle Analysis
    • Supply Chain Analysis
    • Investment Feasibility Matrix
    • Value Chain Analysis
    • PESTLE and Porter’s Analysis
    • Regulatory Landscape
    • Regional Parent Market Outlook
    • Production and Consumption Statistics
    • Import and Export Statistics
  4. Global Market Analysis 2020 to 2024 and Forecast, 2025 to 2035
    • Historical Market Size Value (USD Million) Analysis, 2020 to 2024
    • Current and Future Market Size Value (USD Million) Projections, 2025 to 2035
      • Y-o-Y Growth Trend Analysis
      • Absolute $ Opportunity Analysis
  5. Global Market Pricing Analysis 2020 to 2024 and Forecast 2025 to 2035
  6. Global Market Analysis 2020 to 2024 and Forecast 2025 to 2035, By End-Use
    • Introduction / Key Findings
    • Historical Market Size Value (USD Million) Analysis By End-Use , 2020 to 2024
    • Current and Future Market Size Value (USD Million) Analysis and Forecast By End-Use , 2025 to 2035
      • Consumer Electronics
      • Lighting
      • Semiconductors
      • Automotive
      • Healthcare
      • Nuclear Labs
      • Metallurgy
      • Anti-Counterfeiting
      • Others
    • Y-o-Y Growth Trend Analysis By End-Use , 2020 to 2024
    • Absolute $ Opportunity Analysis By End-Use , 2025 to 2035
  7. Global Market Analysis 2020 to 2024 and Forecast 2025 to 2035, By Application
    • Introduction / Key Findings
    • Historical Market Size Value (USD Million) Analysis By Application, 2020 to 2024
    • Current and Future Market Size Value (USD Million) Analysis and Forecast By Application, 2025 to 2035
      • Phosphors
      • Catalysts
      • Metal Alloys
      • Glass Polishing
      • Permeant Magnets
      • Ceramics
      • Glass Additives
      • Others
    • Y-o-Y Growth Trend Analysis By Application, 2020 to 2024
    • Absolute $ Opportunity Analysis By Application, 2025 to 2035
  8. Global Market Analysis 2020 to 2024 and Forecast 2025 to 2035, By Region
    • Introduction
    • Historical Market Size Value (USD Million) Analysis By Region, 2020 to 2024
    • Current Market Size Value (USD Million) Analysis and Forecast By Region, 2025 to 2035
      • North America
      • Latin America
      • Western Europe
      • Eastern Europe
      • East Asia
      • South Asia and Pacific
      • Middle East & Africa
    • Market Attractiveness Analysis By Region
  9. North America Market Analysis 2020 to 2024 and Forecast 2025 to 2035, By Country
    • Historical Market Size Value (USD Million) Trend Analysis By Market Taxonomy, 2020 to 2024
    • Market Size Value (USD Million) Forecast By Market Taxonomy, 2025 to 2035
      • By Country
        • USA
        • Canada
        • Mexico
      • By End-Use
      • By Application
    • Market Attractiveness Analysis
      • By Country
      • By End-Use
      • By Application
    • Key Takeaways
  10. Latin America Market Analysis 2020 to 2024 and Forecast 2025 to 2035, By Country
    • Historical Market Size Value (USD Million) Trend Analysis By Market Taxonomy, 2020 to 2024
    • Market Size Value (USD Million) Forecast By Market Taxonomy, 2025 to 2035
      • By Country
        • Brazil
        • Chile
        • Rest of Latin America
      • By End-Use
      • By Application
    • Market Attractiveness Analysis
      • By Country
      • By End-Use
      • By Application
    • Key Takeaways
  11. Western Europe Market Analysis 2020 to 2024 and Forecast 2025 to 2035, By Country
    • Historical Market Size Value (USD Million) Trend Analysis By Market Taxonomy, 2020 to 2024
    • Market Size Value (USD Million) Forecast By Market Taxonomy, 2025 to 2035
      • By Country
        • Germany
        • UK
        • Italy
        • Spain
        • France
        • Nordic
        • BENELUX
        • Rest of Western Europe
      • By End-Use
      • By Application
    • Market Attractiveness Analysis
      • By Country
      • By End-Use
      • By Application
    • Key Takeaways
  12. Eastern Europe Market Analysis 2020 to 2024 and Forecast 2025 to 2035, By Country
    • Historical Market Size Value (USD Million) Trend Analysis By Market Taxonomy, 2020 to 2024
    • Market Size Value (USD Million) Forecast By Market Taxonomy, 2025 to 2035
      • By Country
        • Russia
        • Poland
        • Hungary
        • Balkan & Baltic
        • Rest of Eastern Europe
      • By End-Use
      • By Application
    • Market Attractiveness Analysis
      • By Country
      • By End-Use
      • By Application
    • Key Takeaways
  13. East Asia Market Analysis 2020 to 2024 and Forecast 2025 to 2035, By Country
    • Historical Market Size Value (USD Million) Trend Analysis By Market Taxonomy, 2020 to 2024
    • Market Size Value (USD Million) Forecast By Market Taxonomy, 2025 to 2035
      • By Country
        • China
        • Japan
        • South Korea
      • By End-Use
      • By Application
    • Market Attractiveness Analysis
      • By Country
      • By End-Use
      • By Application
    • Key Takeaways
  14. South Asia and Pacific Market Analysis 2020 to 2024 and Forecast 2025 to 2035, By Country
    • Historical Market Size Value (USD Million) Trend Analysis By Market Taxonomy, 2020 to 2024
    • Market Size Value (USD Million) Forecast By Market Taxonomy, 2025 to 2035
      • By Country
        • India
        • ASEAN
        • Australia & New Zealand
        • Rest of South Asia and Pacific
      • By End-Use
      • By Application
    • Market Attractiveness Analysis
      • By Country
      • By End-Use
      • By Application
    • Key Takeaways
  15. Middle East & Africa Market Analysis 2020 to 2024 and Forecast 2025 to 2035, By Country
    • Historical Market Size Value (USD Million) Trend Analysis By Market Taxonomy, 2020 to 2024
    • Market Size Value (USD Million) Forecast By Market Taxonomy, 2025 to 2035
      • By Country
        • Kingdom of Saudi Arabia
        • Other GCC Countries
        • Turkiye
        • South Africa
        • Other African Union
        • Rest of Middle East & Africa
      • By End-Use
      • By Application
    • Market Attractiveness Analysis
      • By Country
      • By End-Use
      • By Application
    • Key Takeaways
  16. Key Countries Market Analysis
    • USA
      • Pricing Analysis
      • Market Share Analysis, 2024
        • By End-Use
        • By Application
    • Canada
      • Pricing Analysis
      • Market Share Analysis, 2024
        • By End-Use
        • By Application
    • Mexico
      • Pricing Analysis
      • Market Share Analysis, 2024
        • By End-Use
        • By Application
    • Brazil
      • Pricing Analysis
      • Market Share Analysis, 2024
        • By End-Use
        • By Application
    • Chile
      • Pricing Analysis
      • Market Share Analysis, 2024
        • By End-Use
        • By Application
    • Germany
      • Pricing Analysis
      • Market Share Analysis, 2024
        • By End-Use
        • By Application
    • UK
      • Pricing Analysis
      • Market Share Analysis, 2024
        • By End-Use
        • By Application
    • Italy
      • Pricing Analysis
      • Market Share Analysis, 2024
        • By End-Use
        • By Application
    • Spain
      • Pricing Analysis
      • Market Share Analysis, 2024
        • By End-Use
        • By Application
    • France
      • Pricing Analysis
      • Market Share Analysis, 2024
        • By End-Use
        • By Application
    • India
      • Pricing Analysis
      • Market Share Analysis, 2024
        • By End-Use
        • By Application
    • ASEAN
      • Pricing Analysis
      • Market Share Analysis, 2024
        • By End-Use
        • By Application
    • Australia & New Zealand
      • Pricing Analysis
      • Market Share Analysis, 2024
        • By End-Use
        • By Application
    • China
      • Pricing Analysis
      • Market Share Analysis, 2024
        • By End-Use
        • By Application
    • Japan
      • Pricing Analysis
      • Market Share Analysis, 2024
        • By End-Use
        • By Application
    • South Korea
      • Pricing Analysis
      • Market Share Analysis, 2024
        • By End-Use
        • By Application
    • Russia
      • Pricing Analysis
      • Market Share Analysis, 2024
        • By End-Use
        • By Application
    • Poland
      • Pricing Analysis
      • Market Share Analysis, 2024
        • By End-Use
        • By Application
    • Hungary
      • Pricing Analysis
      • Market Share Analysis, 2024
        • By End-Use
        • By Application
    • Kingdom of Saudi Arabia
      • Pricing Analysis
      • Market Share Analysis, 2024
        • By End-Use
        • By Application
    • Turkiye
      • Pricing Analysis
      • Market Share Analysis, 2024
        • By End-Use
        • By Application
    • South Africa
      • Pricing Analysis
      • Market Share Analysis, 2024
        • By End-Use
        • By Application
  17. Market Structure Analysis
    • Competition Dashboard
    • Competition Benchmarking
    • Market Share Analysis of Top Players
      • By Regional
      • By End-Use
      • By Application
  18. Competition Analysis
    • Competition Deep Dive
      • Lynas Rare Earths Ltd
        • Overview
        • Product Portfolio
        • Profitability by Market Segments (Product/Age /Sales Channel/Region)
        • Sales Footprint
        • Strategy Overview
          • Marketing Strategy
          • Product Strategy
          • Channel Strategy
      • Avalon Rare Metals Inc.
      • Molycorp
      • Minmetals Corporation
      • Baotou Steel Rare-Earth
      • Xiamen Tungsten
      • Great Western Minerals Group Ltd.
  19. Assumptions & Acronyms Used
  20. Research Methodology

List of Tables

  • Table 1: Global Market Value (USD Million) Forecast by Region, 2020-2035
  • Table 2: Global Market Value (USD Million) Forecast by End-Use , 2020-2035
  • Table 3: Global Market Value (USD Million) Forecast by Application, 2020-2035
  • Table 4: North America Market Value (USD Million) Forecast by Country, 2020-2035
  • Table 5: North America Market Value (USD Million) Forecast by End-Use , 2020-2035
  • Table 6: North America Market Value (USD Million) Forecast by Application, 2020-2035
  • Table 7: Latin America Market Value (USD Million) Forecast by Country, 2020-2035
  • Table 8: Latin America Market Value (USD Million) Forecast by End-Use , 2020-2035
  • Table 9: Latin America Market Value (USD Million) Forecast by Application, 2020-2035
  • Table 10: Western Europe Market Value (USD Million) Forecast by Country, 2020-2035
  • Table 11: Western Europe Market Value (USD Million) Forecast by End-Use , 2020-2035
  • Table 12: Western Europe Market Value (USD Million) Forecast by Application, 2020-2035
  • Table 13: Eastern Europe Market Value (USD Million) Forecast by Country, 2020-2035
  • Table 14: Eastern Europe Market Value (USD Million) Forecast by End-Use , 2020-2035
  • Table 15: Eastern Europe Market Value (USD Million) Forecast by Application, 2020-2035
  • Table 16: East Asia Market Value (USD Million) Forecast by Country, 2020-2035
  • Table 17: East Asia Market Value (USD Million) Forecast by End-Use , 2020-2035
  • Table 18: East Asia Market Value (USD Million) Forecast by Application, 2020-2035
  • Table 19: South Asia and Pacific Market Value (USD Million) Forecast by Country, 2020-2035
  • Table 20: South Asia and Pacific Market Value (USD Million) Forecast by End-Use , 2020-2035
  • Table 21: South Asia and Pacific Market Value (USD Million) Forecast by Application, 2020-2035
  • Table 22: Middle East & Africa Market Value (USD Million) Forecast by Country, 2020-2035
  • Table 23: Middle East & Africa Market Value (USD Million) Forecast by End-Use , 2020-2035
  • Table 24: Middle East & Africa Market Value (USD Million) Forecast by Application, 2020-2035

List of Figures

  • Figure 1: Global Market Pricing Analysis
  • Figure 2: Global Market Value (USD Million) Forecast 2020-2035
  • Figure 3: Global Market Value Share and BPS Analysis by End-Use , 2025 and 2035
  • Figure 4: Global Market Y-o-Y Growth Comparison by End-Use , 2025-2035
  • Figure 5: Global Market Attractiveness Analysis by End-Use
  • Figure 6: Global Market Value Share and BPS Analysis by Application, 2025 and 2035
  • Figure 7: Global Market Y-o-Y Growth Comparison by Application, 2025-2035
  • Figure 8: Global Market Attractiveness Analysis by Application
  • Figure 9: Global Market Value (USD Million) Share and BPS Analysis by Region, 2025 and 2035
  • Figure 10: Global Market Y-o-Y Growth Comparison by Region, 2025-2035
  • Figure 11: Global Market Attractiveness Analysis by Region
  • Figure 12: North America Market Incremental Dollar Opportunity, 2025-2035
  • Figure 13: Latin America Market Incremental Dollar Opportunity, 2025-2035
  • Figure 14: Western Europe Market Incremental Dollar Opportunity, 2025-2035
  • Figure 15: Eastern Europe Market Incremental Dollar Opportunity, 2025-2035
  • Figure 16: East Asia Market Incremental Dollar Opportunity, 2025-2035
  • Figure 17: South Asia and Pacific Market Incremental Dollar Opportunity, 2025-2035
  • Figure 18: Middle East & Africa Market Incremental Dollar Opportunity, 2025-2035
  • Figure 19: North America Market Value Share and BPS Analysis by Country, 2025 and 2035
  • Figure 20: North America Market Value Share and BPS Analysis by End-Use , 2025 and 2035
  • Figure 21: North America Market Y-o-Y Growth Comparison by End-Use , 2025-2035
  • Figure 22: North America Market Attractiveness Analysis by End-Use
  • Figure 23: North America Market Value Share and BPS Analysis by Application, 2025 and 2035
  • Figure 24: North America Market Y-o-Y Growth Comparison by Application, 2025-2035
  • Figure 25: North America Market Attractiveness Analysis by Application
  • Figure 26: Latin America Market Value Share and BPS Analysis by Country, 2025 and 2035
  • Figure 27: Latin America Market Value Share and BPS Analysis by End-Use , 2025 and 2035
  • Figure 28: Latin America Market Y-o-Y Growth Comparison by End-Use , 2025-2035
  • Figure 29: Latin America Market Attractiveness Analysis by End-Use
  • Figure 30: Latin America Market Value Share and BPS Analysis by Application, 2025 and 2035
  • Figure 31: Latin America Market Y-o-Y Growth Comparison by Application, 2025-2035
  • Figure 32: Latin America Market Attractiveness Analysis by Application
  • Figure 33: Western Europe Market Value Share and BPS Analysis by Country, 2025 and 2035
  • Figure 34: Western Europe Market Value Share and BPS Analysis by End-Use , 2025 and 2035
  • Figure 35: Western Europe Market Y-o-Y Growth Comparison by End-Use , 2025-2035
  • Figure 36: Western Europe Market Attractiveness Analysis by End-Use
  • Figure 37: Western Europe Market Value Share and BPS Analysis by Application, 2025 and 2035
  • Figure 38: Western Europe Market Y-o-Y Growth Comparison by Application, 2025-2035
  • Figure 39: Western Europe Market Attractiveness Analysis by Application
  • Figure 40: Eastern Europe Market Value Share and BPS Analysis by Country, 2025 and 2035
  • Figure 41: Eastern Europe Market Value Share and BPS Analysis by End-Use , 2025 and 2035
  • Figure 42: Eastern Europe Market Y-o-Y Growth Comparison by End-Use , 2025-2035
  • Figure 43: Eastern Europe Market Attractiveness Analysis by End-Use
  • Figure 44: Eastern Europe Market Value Share and BPS Analysis by Application, 2025 and 2035
  • Figure 45: Eastern Europe Market Y-o-Y Growth Comparison by Application, 2025-2035
  • Figure 46: Eastern Europe Market Attractiveness Analysis by Application
  • Figure 47: East Asia Market Value Share and BPS Analysis by Country, 2025 and 2035
  • Figure 48: East Asia Market Value Share and BPS Analysis by End-Use , 2025 and 2035
  • Figure 49: East Asia Market Y-o-Y Growth Comparison by End-Use , 2025-2035
  • Figure 50: East Asia Market Attractiveness Analysis by End-Use
  • Figure 51: East Asia Market Value Share and BPS Analysis by Application, 2025 and 2035
  • Figure 52: East Asia Market Y-o-Y Growth Comparison by Application, 2025-2035
  • Figure 53: East Asia Market Attractiveness Analysis by Application
  • Figure 54: South Asia and Pacific Market Value Share and BPS Analysis by Country, 2025 and 2035
  • Figure 55: South Asia and Pacific Market Value Share and BPS Analysis by End-Use , 2025 and 2035
  • Figure 56: South Asia and Pacific Market Y-o-Y Growth Comparison by End-Use , 2025-2035
  • Figure 57: South Asia and Pacific Market Attractiveness Analysis by End-Use
  • Figure 58: South Asia and Pacific Market Value Share and BPS Analysis by Application, 2025 and 2035
  • Figure 59: South Asia and Pacific Market Y-o-Y Growth Comparison by Application, 2025-2035
  • Figure 60: South Asia and Pacific Market Attractiveness Analysis by Application
  • Figure 61: Middle East & Africa Market Value Share and BPS Analysis by Country, 2025 and 2035
  • Figure 62: Middle East & Africa Market Value Share and BPS Analysis by End-Use , 2025 and 2035
  • Figure 63: Middle East & Africa Market Y-o-Y Growth Comparison by End-Use , 2025-2035
  • Figure 64: Middle East & Africa Market Attractiveness Analysis by End-Use
  • Figure 65: Middle East & Africa Market Value Share and BPS Analysis by Application, 2025 and 2035
  • Figure 66: Middle East & Africa Market Y-o-Y Growth Comparison by Application, 2025-2035
  • Figure 67: Middle East & Africa Market Attractiveness Analysis by Application
  • Figure 68: Global Market - Tier Structure Analysis
  • Figure 69: Global Market - Company Share Analysis
Dashboard
Dashboard
Dashboard
Dashboard
Dashboard
Dashboard

Our Research Products

Full Research Suite

The "Full Research Suite" delivers actionable market intel, deep dives on markets or technologies, so clients act faster, cut risk, and unlock growth.

Competitor Leaderboard Report

The Leaderboard benchmarks and ranks top vendors, classifying them as Established Leaders, Leading Challengers, or Disruptors & Challengers.

Future Leaders Index

Locates where complements amplify value and substitutes erode it, forecasting net impact by horizon

Market Data & Forecasts

We deliver granular, decision-grade intel: market sizing, 5-year forecasts, pricing, adoption, usage, revenue, and operational KPIs—plus competitor tracking, regulation, and value chains—across 60 countries broadly.

Market Focus Report

Spot the shifts before they hit your P&L. We track inflection points, adoption curves, pricing moves, and ecosystem plays to show where demand is heading, why it is changing, and what to do next across high-growth markets and disruptive tech

Survey Report

Real-time reads of user behavior. We track shifting priorities, perceptions of today’s and next-gen services, and provider experience, then pace how fast tech moves from trial to adoption, blending buyer, consumer, and channel inputs with social signals (#WhySwitch, #UX).

Bespoke Reports

Partner with our analyst team to build a custom report designed around your business priorities. From analysing market trends to assessing competitors or crafting bespoke datasets, we tailor insights to your needs.

Supplier Intelligence

Discovery & Profiling

Capacity & Footprint

Performance & Risk

Compliance & Governance

Commercial Readiness

Who Supplies Whom

Scorecards & Shortlists

Playbooks & Docs

Category Intelligence

Definition & Scope

Demand & Use Cases

Cost Drivers

Market Structure

Supply Chain Map

Trade & Policy

Operating Norms

Deliverables

Buyer Intelligence

Account Basics

Spend & Scope

Procurement Model

Vendor Requirements

Terms & Policies

Entry Strategy

Pain Points & Triggers

Outputs

Pricing Analysis

Benchmarks

Trends

Should-Cost

Indexation

Landed Cost

Commercial Terms

Deliverables

Brand Analysis

Positioning & Value Prop

Share & Presence

Customer Evidence

Go-to-Market

Digital & Reputation

Compliance & Trust

KPIs & Gaps

Outputs

Full Research Suite comprises of:

Market outlook & trends analysis

Market outlook & trends analysis

Interviews & case studies

Interviews & case studies

Strategic recommendations

Strategic recommendations

Vendor profiles & capabilities analysis

Vendor profiles & capabilities analysis

5-year forecasts

5-year forecasts

8 regions and 60+ country-level data splits

8 regions and 60+ country-level data splits

Market segment data splits

Market segment data splits

12 months of continuous data updates

12 months of continuous data updates

DELIVERED AS:

PDF EXCEL ONLINE

Full Research Suite


$5000

$7500

$10000

Buy Report Now
Future Market Insights

Europium Market

Chat With MaRIA

Chat With

MaRIA

Hi There, I am MaRIA, Your Market Research Intelligence Assistant. How may I help you?