Sales of taurine in Japan are estimated at USD 16.5 million in 2025, with projections indicating a rise to USD 30.4 million by 2035, reflecting a CAGR of 6.3% over the forecast period. This growth reflects expanding health consciousness among Japanese consumers and increased per capita consumption across major urban centers. The rise in demand is linked to growing preference for functional beverages, heightened awareness of athletic performance enhancement, and evolving wellness trends.
By 2025, per capita consumption in leading Japanese regions such as Kanto, Kinki, and Chubu averages between 0.2 to 0.3 grams in 2025, with projections reaching about 0.4 grams by 2035. Kanto region leads among regional areas, expected to generate USD 13.7 million in taurine sales by 2035, followed by Chubu region (USD 9.1 million), Kinki region (USD 5.5 million), Kyushu and Okinawa (USD 1.8 million), and Tohoku region (USD 0.3 million).
The largest contribution to demand continues to come from food-grade forms, which are expected to account for 42% of total sales in 2025, owing to widespread use in energy drinks, functional foods, and infant nutrition products. By application classification, beverages represent the dominant category, responsible for 24% of all sales, while pharmaceutical and dietary supplement variants are expanding steadily.
Consumer adoption is particularly concentrated among health-conscious office workers and athletes, with aging demographics and lifestyle disease awareness emerging as significant drivers of demand. While premium pricing remains a consideration, the average price premium over synthetic alternatives has declined from 45% in 2020 to 38% in 2025. Continued improvements in bio-production technology and domestic manufacturing capabilities are expected to accelerate affordability and access across mainstream consumer segments. Regional disparities persist, but per capita demand in rural areas is narrowing the gap with traditionally strong metropolitan consumption patterns.
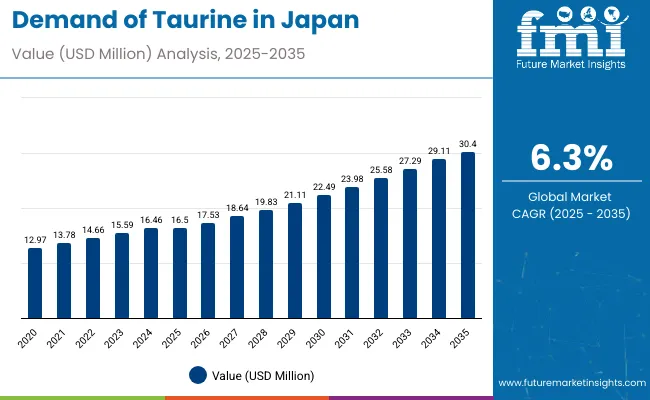
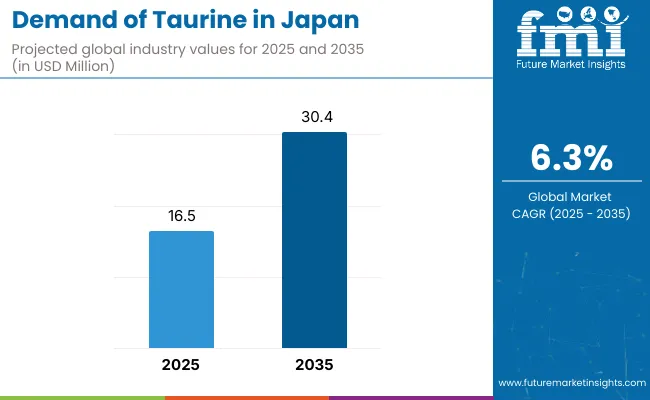
| Metric | Value |
|---|---|
| Estimated Size (2025E) | USD 16.5 million |
| Projected Value (2035F) | USD 30.4 million |
| CAGR (2025 to 2035) | 6.3% |
The taurine segment in Japan is classified across several categories. By grade, the key segments include food grade, feed grade, pharmaceuticals grade, and others. By application, the segment spans food (dairy products, infant nutrition, bakery products, and cereal products), beverages (energy drinks, caffeinated drinks, and soft & carbonated drinks), animal feed (aquaculture feed, poultry feed, and pet food), dietary supplements, cosmetics & personal care (skin care products, hair care products, and toiletries) agriculture, and pharmaceuticals. By region, coverage includes Kanto, Chubu, Kinki, Kyushu and Okinawa, Tohoku, and rest of Japan territories.
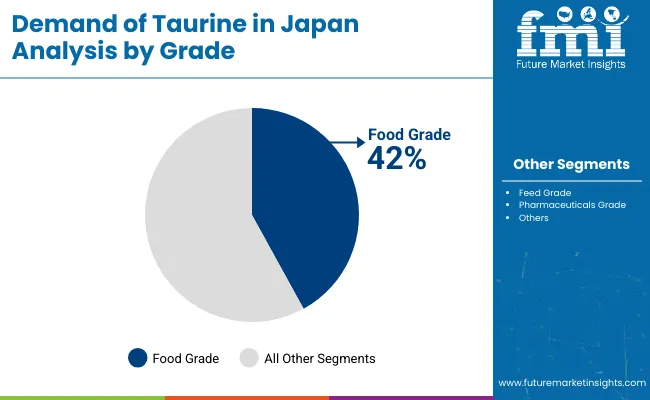
Food grade forms are projected to dominate sales in 2025, supported by widespread adoption in functional beverages, energy drinks, and infant nutrition products. Other grades such as pharmaceutical and feed grade are growing steadily, each serving distinct quality and application requirements.
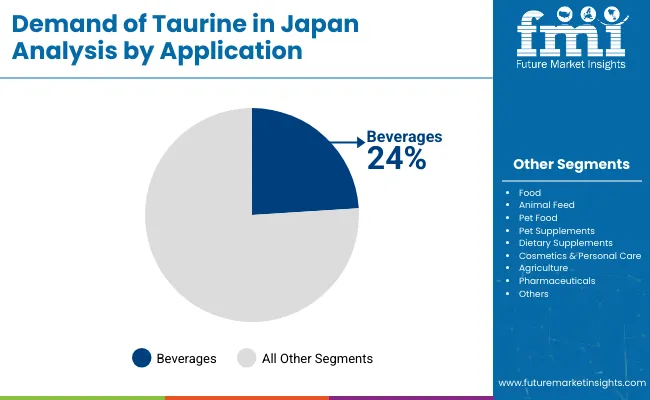
Taurine in Japan is utilized through beverages, dietary supplements, animal feed, pharmaceuticals, and cosmetics applications. Beverages are expected to remain the primary category in 2025, followed by dietary supplements and animal feed formulations.
The taurine category in Japan appeals to diverse consumer segments across age groups, activity levels, and health priorities. While motivations range from energy enhancement to athletic performance to general wellness, demand is concentrated among four key demographic clusters.
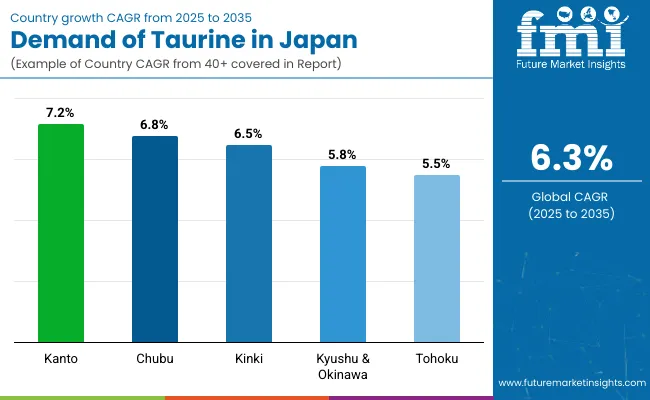
Taurine sales will not grow uniformly across every Japanese region. Rising health awareness and faster adoption of functional ingredients in major metropolitan areas give the Kanto and Chubu regions a measurable edge, while traditional regions expand more gradually from a lower baseline consumption.
| Region | CAGR (2025 to 2035) |
|---|---|
| Kanto | 7.2% |
| Chubu | 6.8% |
| Kinki | 6.5% |
| Kyushu & Okinawa | 5.8% |
| Tohoku | 5.5% |
Between 2025 and 2035, demand for taurine is projected to expand across all major Japanese regions, but the pace of growth will vary based on urbanization levels, health consciousness penetration, and baseline consumption patterns. Among the six regions analyzed, Kanto and Chubu are expected to register the fastest compound annual growth rates of 7.2% and 6.8% respectively, outpacing more traditional rural areas.
This acceleration is underpinned by a combination of factors: concentrated pharmaceutical industry presence, higher disposable incomes, and increasing availability of energy drinks and functional beverages across modern retail networks. In both regions, per capita consumption is projected to rise from 0.2 grams in 2025 to 0.4 grams by 2035, reflecting mainstream adoption of taurine-enhanced products. Product availability is also expanding faster in these regions, with new retail formats gaining traction in urban convenience stores and specialty nutrition chains.
Kinki and Kyushu-Okinawa regions are each forecast to grow at CAGRs of 6.5% and 5.8% respectively over the same period. Both regions already maintain established pharmaceutical retail ecosystems, with growing access to diverse taurine products in pharmacies, health stores, and specialty retailers. In Kinki, growth is supported by aging population health concerns, commercial and cultural center dynamics, and increasing acceptance of functional ingredient supplementation. Kyushu-Okinawa reflects similar dynamics, particularly among tourism industry workers and agricultural communities seeking performance enhancement. In both regions, per capita consumption is projected to increase from 0.15 grams in 2025 to 0.3 grams by 2035, reflecting gradual mainstream penetration.
Tohoku and Rest of Japan regions, while maintaining traditional consumption patterns, are expected to grow at CAGRs of 5.5% and 5.2% respectively, benefiting from healthcare accessibility improvements and growing awareness of performance enhancement benefits. These regions already exhibit moderate health consciousness and established trust in pharmaceutical-grade supplements. Growth will likely come from medical recommendations, family influence patterns, and improved product availability through traditional retail channels and agricultural supply networks.
Collectively, these six regions represent the core of Japanese demand for taurine, but their individual growth paths highlight the importance of regional customization in health education, product positioning, and distribution channel strategies tailored to urban versus rural consumption patterns.
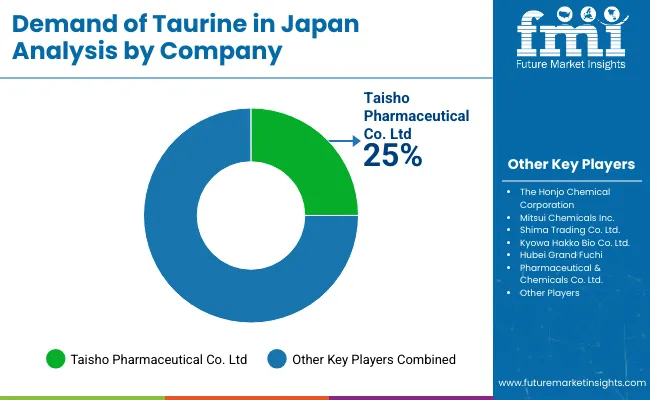
The competitive environment is characterized by a mix of domestic pharmaceutical companies and chemical manufacturers. Manufacturing expertise and quality certification remain the decisive success factors: the five largest suppliers collectively serve more than 3,000 food and pharmaceutical manufacturers nationwide.
Taisho Pharmaceutical Co., Ltd. is the market leader with an estimated 25% market share. Through its joint venture Taisho MTC with Mitsui Chemicals, the organization offers comprehensive taurine production solutions, all meeting Japanese pharmaceutical standards. Its core range of high-purity taurine products gives it deep penetration in energy drink and pharmaceutical channels.
Mitsui Chemicals, Inc., with diversified chemical manufacturing capabilities, leverages industrial processing expertise to place high-quality taurine in premium applications. The company benefits from its strategic partnership with Taisho Pharmaceutical and maintains strong positions in both food and pharmaceutical grade segments.
Kyowa Hakko Bio Co., Ltd. focuses on bio-production technologies and sustainable manufacturing processes. Recent investments in fermentation technology have allowed the company to introduce enhanced purity variants positioned for pharmaceutical and nutraceutical applications.
The Honjo Chemical Corporation specializes in high-purity chemical production and maintains strong relationships with pharmaceutical manufacturers. The company's focus on quality control and regulatory compliance supports its positioning in premium market segments.
Shima Trading Co., Ltd. leverages its international trading expertise and established distribution networks to serve both domestic and export markets, providing comprehensive supply chain solutions for taurine products.
| Items | Values |
|---|---|
| Quantitative Units (2025) | USD 16.5 million |
| Grade | Food Grade, Feed Grade, Pharmaceuticals Grade, Others |
| Application | Food (Dairy Products, Infant, Bakery Products, Cereal Products), Beverage (Energy Drinks, Caffeinated Drinks, Soft & Carbonated Drinks), Animal Feed (Aquaculture Feed, Poultry Feed), Pet Food (Cat Food, Dog Food), Pet Supplements (Cat Supplements, Dog Supplements), Dietary Supplements, Cosmetics & Personal Care (Skin Care Products, Hair Care Products, Toiletries), Agriculture, Pharmaceuticals |
| Regions Covered | Kanto, Chubu, Kinki, Kyushu and Okinawa, Tohoku, Rest of Japan |
| Key Companies Profiled | The Honjo Chemical Corporation, Mitsui Chemicals, Inc., Shima Trading Co., Ltd., Kyowa Hakko Bio Co., Ltd., Hubei Grand Fuchi Pharmaceutical & Chemicals Co., Ltd., Qianjiang Yongan Pharmaceutical Co., Ltd., Taisho Pharmaceutical Holdings Co., Ltd., Avanscure Life Sciences Pvt. Ltd., Atlantic Chemicals Trading GmbH, New Zealand Pharmaceuticals Ltd. |
| Additional Attributes | Dollar sales by grade and application; regional demand trends; competitive landscape; consumer preference for synthetic versus natural taurine; sustainable sourcing integration; innovations in synthesis technologies; and regulatory quality standardization |
The global taurine industry analysis in Japan is estimated to be valued at USD 16.5 million in 2025.
The market size for the taurine industry analysis in Japan is projected to reach USD 29.6 million by 2035.
The taurine industry analysis in Japan is expected to grow at a 6.0% CAGR between 2025 and 2035.
The key product types in taurine industry analysis in Japan are food grade, feed grade, pharmaceuticals grade and others.
In terms of end use application, food segment to command 36.9% share in the taurine industry analysis in Japan in 2025.


Our Research Products

The "Full Research Suite" delivers actionable market intel, deep dives on markets or technologies, so clients act faster, cut risk, and unlock growth.

The Leaderboard benchmarks and ranks top vendors, classifying them as Established Leaders, Leading Challengers, or Disruptors & Challengers.

Locates where complements amplify value and substitutes erode it, forecasting net impact by horizon

We deliver granular, decision-grade intel: market sizing, 5-year forecasts, pricing, adoption, usage, revenue, and operational KPIs—plus competitor tracking, regulation, and value chains—across 60 countries broadly.

Spot the shifts before they hit your P&L. We track inflection points, adoption curves, pricing moves, and ecosystem plays to show where demand is heading, why it is changing, and what to do next across high-growth markets and disruptive tech

Real-time reads of user behavior. We track shifting priorities, perceptions of today’s and next-gen services, and provider experience, then pace how fast tech moves from trial to adoption, blending buyer, consumer, and channel inputs with social signals (#WhySwitch, #UX).

Partner with our analyst team to build a custom report designed around your business priorities. From analysing market trends to assessing competitors or crafting bespoke datasets, we tailor insights to your needs.
Supplier Intelligence
Discovery & Profiling
Capacity & Footprint
Performance & Risk
Compliance & Governance
Commercial Readiness
Who Supplies Whom
Scorecards & Shortlists
Playbooks & Docs
Category Intelligence
Definition & Scope
Demand & Use Cases
Cost Drivers
Market Structure
Supply Chain Map
Trade & Policy
Operating Norms
Deliverables
Buyer Intelligence
Account Basics
Spend & Scope
Procurement Model
Vendor Requirements
Terms & Policies
Entry Strategy
Pain Points & Triggers
Outputs
Pricing Analysis
Benchmarks
Trends
Should-Cost
Indexation
Landed Cost
Commercial Terms
Deliverables
Brand Analysis
Positioning & Value Prop
Share & Presence
Customer Evidence
Go-to-Market
Digital & Reputation
Compliance & Trust
KPIs & Gaps
Outputs
Full Research Suite comprises of:
Market outlook & trends analysis
Interviews & case studies
Strategic recommendations
Vendor profiles & capabilities analysis
5-year forecasts
8 regions and 60+ country-level data splits
Market segment data splits
12 months of continuous data updates
DELIVERED AS:
PDF EXCEL ONLINE
Taurine Industry Analysis in South Korea - Trends, Market Insights & Applications 2025 to 2035
Taurine Industry in Western Europe - Trends, Market Insights & Applications 2025 to 2035
Japan Automotive Lighting Market Growth – Trends & Forecast 2023-2033
Japan Automotive Load Floor Industry Analysis Size and Share Forecast Outlook 2025 to 2035
Japan Automated People Mover Industry Size and Share Forecast Outlook 2025 to 2035
Japan Automotive Turbocharger Market Growth – Trends & Forecast 2023-2033
FIBC Industry Analysis in Japan Size and Share Forecast Outlook 2025 to 2035
Japan Low Rolling Resistance Tire Market Growth – Trends & Forecast 2023-2033
Japan Automotive Interior Leather Market Growth – Trends & Forecast 2023-2033
Pectin Industry Analysis in Japan Size and Share Forecast Outlook 2025 to 2035
Mezcal Industry Analysis in Japan - Consumer Demand & Industry Trends in 2025
Tourism Industry Analysis in Japan - Size, Share, & Forecast Outlook 2025 to 2035
Isomalt Industry in Japan – Growth & Industry Trends 2025 to 2035
Industry Analysis of Electronic Skin in Japan Size and Share Forecast Outlook 2025 to 2035
Japan Steel Drum Market Analysis – Trends & Forecast 2023-2033
Resveratrol Industry Analysis in Japan Growth, Trends and Forecast from 2025 to 2035
Smart Space Market Growth – Trends & Forecast 2024-2034
Stretch Film Industry Analysis in Japan Size and Share Forecast Outlook 2025 to 2035
Polydextrose Industry Analysis in Japan – Demand & Market Trends 2025 to 2035
Glassine Paper Industry Analysis in Japan Size and Share Forecast Outlook 2025 to 2035

Thank you!
You will receive an email from our Business Development Manager. Please be sure to check your SPAM/JUNK folder too.
Chat With
MaRIA