Japan Automated People Mover Industry Size and Share Forecast Outlook 2025 to 2035

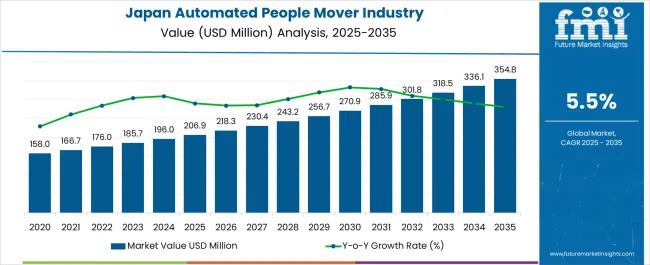
The Japan Automated People Mover Industry is estimated to be valued at USD 206.9 million in 2025 and is projected to reach USD 354.8 million by 2035, registering a compound annual growth rate (CAGR) of 5.5% over the forecast period.
Quick Stats for Japan Automated People Mover Industry

  • Japan Automated People Mover Industry Industry Value (2025): USD 206.9 million
  • Japan Automated People Mover Industry Forecast Value (2035): USD 354.8 million
  • Japan Automated People Mover Industry Forecast CAGR: 5.5%
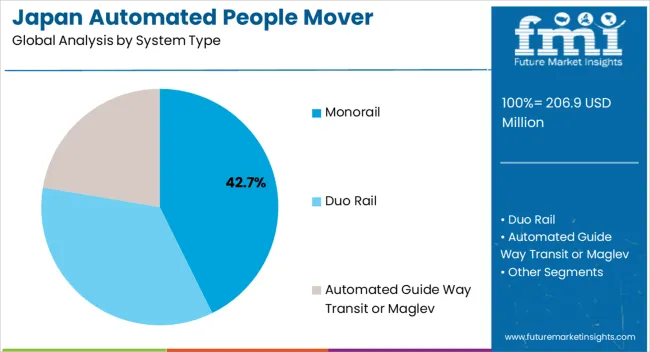
  • Leading Segment in Japan Automated People Mover Industry in 2025: Monorail (42.7%)
  • Key Growth Region in Japan Automated People Mover Industry: North America, Asia-Pacific, Europe
  • Top Key Players in Japan Automated People Mover Industry: Hitachi, Ltd., Mitsubishi Heavy Industries (MHI), Kawasaki Heavy Industries, Ltd., Mitsui Engineering & Shipbuilding Co., Ltd, Nippon Sharyo, Ltd, Toshiba Infrastructure Systems & Solutions Corporation

Japan Automated People Mover Industry Market Value Analysis

Metric Value
Japan Automated People Mover Industry Estimated Value in (2025 E) USD 206.9 million
Japan Automated People Mover Industry Forecast Value in (2035 F) USD 354.8 million
Forecast CAGR (2025 to 2035) 5.5%

Rationale for Segmental Growth in the Japan Automated People Mover Industry

The Japan automated people mover industry is demonstrating strong growth momentum. Rising urban density, the need for efficient mobility solutions, and government support for sustainable transport infrastructure are driving demand. Current market conditions reflect increased investment in modernizing public transit systems and integrating advanced technologies to improve operational efficiency.

Adoption of automated people movers is being supported by their ability to reduce congestion, enhance safety, and provide reliable connectivity within urban corridors and large facilities. Future growth will be influenced by expanding urban transit networks, the push toward eco-friendly transportation modes, and strategic investments in automation and digital control systems.

Long-term industry expansion is also being reinforced by alignment with Japan’s smart city initiatives, the rising focus on reducing emissions, and the demand for scalable mobility systems capable of meeting fluctuating passenger volumes These factors are collectively underpinning steady growth prospects, ensuring that automated people movers will remain a critical component of Japan’s evolving transportation ecosystem.
Segmental Analysis

Insights into the System Type Segment

Japan Automated People Mover Industry Analysis By System Type

The monorail segment, holding 42.70% of the system type category, has been leading the market owing to its long-standing role in Japan’s urban mobility infrastructure. Its dominance is supported by high passenger-carrying capacity, adaptability to complex urban layouts, and efficient land-use benefits. Investment in monorail projects has been reinforced by strong government backing and long-term operational reliability.

Technological improvements in automation, control systems, and energy efficiency have further strengthened its competitiveness. Passenger acceptance has remained high due to comfort, speed, and integration with other transit systems.

Market positioning is also being enhanced by ongoing upgrades and extensions to existing lines, which are improving connectivity across major cities With rising demand for low-emission and space-efficient mobility, the monorail segment is expected to maintain its leadership and contribute substantially to industry growth in the coming years.
Insights into the Application Segment

Japan Automated People Mover Industry Analysis By Application

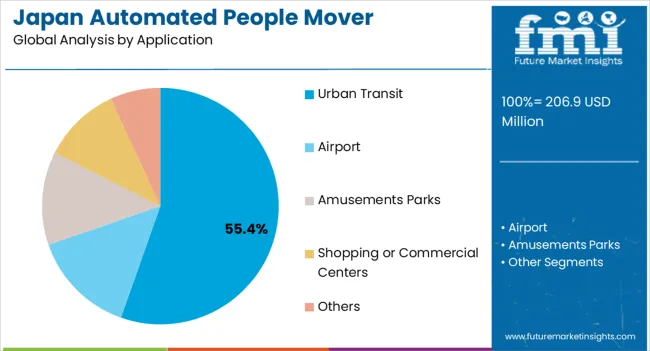
The urban transit segment, representing 55.40% of the application category, has maintained prominence due to its alignment with Japan’s rapid urbanization and the demand for efficient intra-city mobility. Automated people movers have become essential in easing congestion in densely populated areas and ensuring timely connectivity across residential, commercial, and industrial hubs.

This segment’s leadership is supported by extensive integration with railway and metro systems, which ensures seamless passenger flow across multimodal networks. Operational efficiency, reduced environmental impact, and scalability for high-traffic corridors have reinforced preference for urban transit deployment.

Continued government investment in smart city and green transport projects is expected to drive sustained growth The segment’s market share is also being supported by rising passenger expectations for reliability, safety, and reduced travel times, positioning urban transit as the cornerstone of automated people mover applications in Japan.

Key Insights and Highlights to Understand Emerging and Fast-growing Opportunities

  • Japan has a history of investing in modern and efficient infrastructure. Ongoing and future infrastructure projects, including airport expansions and urban redevelopment, are expected to contribute to the demand for APM (automated people mover) systems.
  • Japan is generally an early adopter of new technologies. With increasing advancements in APM technology, such as improved energy efficiency, smart connectivity, and enhanced safety features, the automated people mover system may experience significant growth.
  • Government policies and initiatives aimed at improving transportation efficiency, reducing congestion, and promoting environmentally friendly modes of transit could have an impact on automated people mover industry in Japan.

Key Trends Influencing the Demand for Automated People Mover in Japan

  • A rising emphasis on sustainability has increased interest in green transportation solutions. APMs that incorporate energy-efficient designs and eco-friendly technologies align with this trend.
  • The growing innovations in automation, sensor technology, and artificial intelligence are influencing the design and functionality of automated people mover.

City-wise Insights

Expanding Airport Projects Drives the Automated People Mover Demand in Kanto Region

Tokyo, situated in the Kanto region, is among the highly populated and densely inhabited urban areas globally. As urbanization continues and population density increases, there is a greater need for efficient and convenient transportation solutions, potentially driving the demand for automated people mover.

Several important airports, including Tokyo Haneda International Airport and Narita International Airport, serve the Kanto region. Automated people mover is commonly used in airports to transport passengers between terminals and facilities. Continued airport expansion and modernization projects could contribute to the growth of automated people mover industry.

Tokyo and other cities in the Kanto region are actively involved in smart city initiatives, focusing on incorporating advanced technologies to enhance urban living. Automated people mover is likely to play a role in these initiatives by providing efficient and technology-driven transportation solutions. The Kanto region includes key business districts and commercial areas. Automated people mover can provide convenient connectivity within these districts, linking office complexes, shopping centers, and public transit hubs.

Increasing Demand for Efficient Transport Solution in Various Industry to Boost Industry Growth in Chubu

Chubu is a crucial industrial and economic hub in Japan, housing various manufacturing and technology companies. As industrial activity grows, there may be an increased demand for efficient transportation solutions within industrial complexes and business districts.

Ongoing and planned transportation infrastructure projects in the region, including airport expansions, urban development, and connectivity improvements, may drive the demand for automated people mover. The region's key airport, Chubu Centrair International Airport, could be a key focal point for APM utilization.

As urbanization and population growth occur, the need for efficient and sustainable transportation solutions within urban centers and suburban areas may increase, contributing to the demand for APM systems.

Category-wise Insights

Duo Rail System is Set to Dominate Japan's Automated People Mover Industry

In 2025, the duo rail segment is likely to account for an industry share of 81%. Duo rail takes up less area horizontally and vertically than traditional rail systems. Duo rail vehicles are broader than the beam and are frequently elevated, requiring just a small footprint for support pillars. These factors are expected to fuel sales of duo rail systems in the forthcoming years.

Attribute Details
System Duo Rail
Value Share in 2025 81%

The Adoption of Automated People Mover in Japan’s Airports to Remain High

In 2025, the airport segment is projected to hold an industry share of 61.5%. People mover systems are used in many international airports worldwide to convey passengers between terminals or inside a terminal. Airports often have multiple terminals, each serving different airlines or flight operations. APMs provide a quick and efficient means of connecting passengers between terminals, reducing the time and effort required for transit.

Attribute Details
Application Airports
Value Share in 2025 61.5%

Competitive Landscape

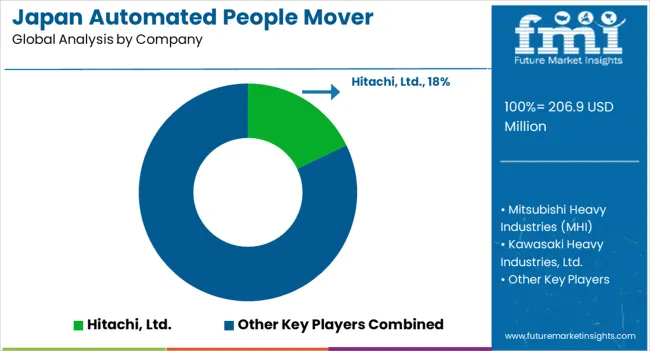
Japan Automated People Mover Industry Analysis By Company

Acquisitions and mergers are the default expansion strategies for players operating in the automated people mover industry in Japan. Key manufacturers of automated people mover in Japan focus on facility expansions, product innovations, and promotional activities to increase sales and gain a competitive edge. Key players in the automated people mover ecosystem are also investing to enhance their manufacturing capabilities and geographical footprint, aiming to increase their industry share.

  • Mitsubishi Heavy Industries is a key player in the transportation sector, actively involved in the development of APM systems for various applications, including airports and urban transit.
  • Hitachi, Ltd. is a diversified company engaged in multiple industries, including transportation. It has been actively participating in the development of railway systems and automated people mover, contributing to the transportation infrastructure in Japan.
  • Kawasaki Heavy Industries, Ltd. is a well-known manufacturer in the transportation sector, producing trains, aircraft, and other vehicles. The company has experience in developing APM systems for urban and airport applications.

Scope of the Report

Attribute Details
Estimated Industry Size in 2025 USD 206.9 million
Projected Industry Size by 2035 USD 354.8 million
Anticipated CAGR between 2025 to 2035 5.5% CAGR
Historical Analysis of Demand for Automated People Mover in Japan 2020 to 2025
Demand Forecast for Automated People Mover in Japan in Japan 2025 to 2035
Report Coverage Industry Size, Industry Trends, Analysis of key factors influencing Automated People Mover in Japan, Insights on Global Players and their Industry Strategy in Japan, Ecosystem Analysis of Local Providers in Japan
Key Cities Analyzed while Studying Opportunities in Automated People Mover in Japan Kanto, Chubu, Kinki (Kansai), Kyushu and Okinawa, Tohoku, Rest of Japan
Key Companies Profiled Mitsubishi Heavy Industries (MHI); Hitachi, Ltd.; Kawasaki Heavy Industries, Ltd.; Mitsui Engineering & Shipbuilding Co., Ltd; Nippon Sharyo, Ltd; Toshiba Infrastructure Systems & Solutions Corporation

Automated People Mover in Japan Key Segments

By System Type:

  • Monorail
  • Duo Rail
  • Automated Guide Way Transit or Maglev

By Application:

  • Airport
  • Urban Transit
  • Amusements Parks
  • Shopping or Commercial Centers
  • Others

By City:

  • Kanto
  • Chubu
  • Kinki (Kansai)
  • Kyushu and Okinawa
  • Tohoku
  • Rest of Japan

Frequently Asked Questions

How big is the Japan automated people mover industry in 2025?

The global Japan automated people mover industry is estimated to be valued at USD 206.9 million in 2025.

What will be the size of Japan automated people mover industry in 2035?

The market size for the Japan automated people mover industry is projected to reach USD 354.8 million by 2035.

How much will be the Japan automated people mover industry growth between 2025 and 2035?

The Japan automated people mover industry is expected to grow at a 5.5% CAGR between 2025 and 2035.

What are the key product types in the Japan automated people mover industry?

The key product types in Japan automated people mover industry are monorail, duo rail and automated guide way transit or maglev.

Which application segment to contribute significant share in the Japan automated people mover industry in 2025?

In terms of application, urban transit segment to command 55.4% share in the Japan automated people mover industry in 2025.

Table of Content

  1. Executive Summary
    • Global Market Outlook
    • Demand-side Trends
    • Supply-side Trends
    • Technology Roadmap Analysis
    • Analysis and Recommendations
  2. Market Overview
    • Market Coverage / Taxonomy
    • Market Definition / Scope / Limitations
  3. Market Background
    • Market Dynamics
      • Drivers
      • Restraints
      • Opportunity
      • Trends
    • Scenario Forecast
      • Demand in Optimistic Scenario
      • Demand in Likely Scenario
      • Demand in Conservative Scenario
    • Opportunity Map Analysis
    • Product Life Cycle Analysis
    • Supply Chain Analysis
    • Investment Feasibility Matrix
    • Value Chain Analysis
    • PESTLE and Porter’s Analysis
    • Regulatory Landscape
    • Regional Parent Market Outlook
    • Production and Consumption Statistics
    • Import and Export Statistics
  4. Global Analysis 2020 to 2024 and Forecast, 2025 to 2035
    • Historical Market Size Value (USD Million) Analysis, 2020 to 2024
    • Current and Future Market Size Value (USD Million) Projections, 2025 to 2035
      • Y-o-Y Growth Trend Analysis
      • Absolute $ Opportunity Analysis
  5. Global Pricing Analysis 2020 to 2024 and Forecast 2025 to 2035
  6. Global Analysis 2020 to 2024 and Forecast 2025 to 2035, By System Type
    • Introduction / Key Findings
    • Historical Market Size Value (USD Million) Analysis By System Type , 2020 to 2024
    • Current and Future Market Size Value (USD Million) Analysis and Forecast By System Type , 2025 to 2035
      • Monorail
      • Duo Rail
      • Automated Guide Way Transit or Maglev
    • Y-o-Y Growth Trend Analysis By System Type , 2020 to 2024
    • Absolute $ Opportunity Analysis By System Type , 2025 to 2035
  7. Global Analysis 2020 to 2024 and Forecast 2025 to 2035, By Application
    • Introduction / Key Findings
    • Historical Market Size Value (USD Million) Analysis By Application, 2020 to 2024
    • Current and Future Market Size Value (USD Million) Analysis and Forecast By Application, 2025 to 2035
      • Urban Transit
      • Airport
      • Amusements Parks
      • Shopping or Commercial Centers
      • Others
    • Y-o-Y Growth Trend Analysis By Application, 2020 to 2024
    • Absolute $ Opportunity Analysis By Application, 2025 to 2035
  8. Global Analysis 2020 to 2024 and Forecast 2025 to 2035, By Region
    • Introduction
    • Historical Market Size Value (USD Million) Analysis By Region, 2020 to 2024
    • Current Market Size Value (USD Million) Analysis and Forecast By Region, 2025 to 2035
      • North America
      • Latin America
      • Western Europe
      • Eastern Europe
      • East Asia
      • South Asia and Pacific
      • Middle East & Africa
    • Market Attractiveness Analysis By Region
  9. North America Analysis 2020 to 2024 and Forecast 2025 to 2035, By Country
    • Historical Market Size Value (USD Million) Trend Analysis By Market Taxonomy, 2020 to 2024
    • Market Size Value (USD Million) Forecast By Market Taxonomy, 2025 to 2035
      • By Country
        • USA
        • Canada
        • Mexico
      • By System Type
      • By Application
    • Market Attractiveness Analysis
      • By Country
      • By System Type
      • By Application
    • Key Takeaways
  10. Latin America Analysis 2020 to 2024 and Forecast 2025 to 2035, By Country
    • Historical Market Size Value (USD Million) Trend Analysis By Market Taxonomy, 2020 to 2024
    • Market Size Value (USD Million) Forecast By Market Taxonomy, 2025 to 2035
      • By Country
        • Brazil
        • Chile
        • Rest of Latin America
      • By System Type
      • By Application
    • Market Attractiveness Analysis
      • By Country
      • By System Type
      • By Application
    • Key Takeaways
  11. Western Europe Analysis 2020 to 2024 and Forecast 2025 to 2035, By Country
    • Historical Market Size Value (USD Million) Trend Analysis By Market Taxonomy, 2020 to 2024
    • Market Size Value (USD Million) Forecast By Market Taxonomy, 2025 to 2035
      • By Country
        • Germany
        • UK
        • Italy
        • Spain
        • France
        • Nordic
        • BENELUX
        • Rest of Western Europe
      • By System Type
      • By Application
    • Market Attractiveness Analysis
      • By Country
      • By System Type
      • By Application
    • Key Takeaways
  12. Eastern Europe Analysis 2020 to 2024 and Forecast 2025 to 2035, By Country
    • Historical Market Size Value (USD Million) Trend Analysis By Market Taxonomy, 2020 to 2024
    • Market Size Value (USD Million) Forecast By Market Taxonomy, 2025 to 2035
      • By Country
        • Russia
        • Poland
        • Hungary
        • Balkan & Baltic
        • Rest of Eastern Europe
      • By System Type
      • By Application
    • Market Attractiveness Analysis
      • By Country
      • By System Type
      • By Application
    • Key Takeaways
  13. East Asia Analysis 2020 to 2024 and Forecast 2025 to 2035, By Country
    • Historical Market Size Value (USD Million) Trend Analysis By Market Taxonomy, 2020 to 2024
    • Market Size Value (USD Million) Forecast By Market Taxonomy, 2025 to 2035
      • By Country
        • China
        • Japan
        • South Korea
      • By System Type
      • By Application
    • Market Attractiveness Analysis
      • By Country
      • By System Type
      • By Application
    • Key Takeaways
  14. South Asia and Pacific Analysis 2020 to 2024 and Forecast 2025 to 2035, By Country
    • Historical Market Size Value (USD Million) Trend Analysis By Market Taxonomy, 2020 to 2024
    • Market Size Value (USD Million) Forecast By Market Taxonomy, 2025 to 2035
      • By Country
        • India
        • ASEAN
        • Australia & New Zealand
        • Rest of South Asia and Pacific
      • By System Type
      • By Application
    • Market Attractiveness Analysis
      • By Country
      • By System Type
      • By Application
    • Key Takeaways
  15. Middle East & Africa Analysis 2020 to 2024 and Forecast 2025 to 2035, By Country
    • Historical Market Size Value (USD Million) Trend Analysis By Market Taxonomy, 2020 to 2024
    • Market Size Value (USD Million) Forecast By Market Taxonomy, 2025 to 2035
      • By Country
        • Kingdom of Saudi Arabia
        • Other GCC Countries
        • Turkiye
        • South Africa
        • Other African Union
        • Rest of Middle East & Africa
      • By System Type
      • By Application
    • Market Attractiveness Analysis
      • By Country
      • By System Type
      • By Application
    • Key Takeaways
  16. Key Countries Analysis
    • USA
      • Pricing Analysis
      • Market Share Analysis, 2024
        • By System Type
        • By Application
    • Canada
      • Pricing Analysis
      • Market Share Analysis, 2024
        • By System Type
        • By Application
    • Mexico
      • Pricing Analysis
      • Market Share Analysis, 2024
        • By System Type
        • By Application
    • Brazil
      • Pricing Analysis
      • Market Share Analysis, 2024
        • By System Type
        • By Application
    • Chile
      • Pricing Analysis
      • Market Share Analysis, 2024
        • By System Type
        • By Application
    • Germany
      • Pricing Analysis
      • Market Share Analysis, 2024
        • By System Type
        • By Application
    • UK
      • Pricing Analysis
      • Market Share Analysis, 2024
        • By System Type
        • By Application
    • Italy
      • Pricing Analysis
      • Market Share Analysis, 2024
        • By System Type
        • By Application
    • Spain
      • Pricing Analysis
      • Market Share Analysis, 2024
        • By System Type
        • By Application
    • France
      • Pricing Analysis
      • Market Share Analysis, 2024
        • By System Type
        • By Application
    • India
      • Pricing Analysis
      • Market Share Analysis, 2024
        • By System Type
        • By Application
    • ASEAN
      • Pricing Analysis
      • Market Share Analysis, 2024
        • By System Type
        • By Application
    • Australia & New Zealand
      • Pricing Analysis
      • Market Share Analysis, 2024
        • By System Type
        • By Application
    • China
      • Pricing Analysis
      • Market Share Analysis, 2024
        • By System Type
        • By Application
    • Japan
      • Pricing Analysis
      • Market Share Analysis, 2024
        • By System Type
        • By Application
    • South Korea
      • Pricing Analysis
      • Market Share Analysis, 2024
        • By System Type
        • By Application
    • Russia
      • Pricing Analysis
      • Market Share Analysis, 2024
        • By System Type
        • By Application
    • Poland
      • Pricing Analysis
      • Market Share Analysis, 2024
        • By System Type
        • By Application
    • Hungary
      • Pricing Analysis
      • Market Share Analysis, 2024
        • By System Type
        • By Application
    • Kingdom of Saudi Arabia
      • Pricing Analysis
      • Market Share Analysis, 2024
        • By System Type
        • By Application
    • Turkiye
      • Pricing Analysis
      • Market Share Analysis, 2024
        • By System Type
        • By Application
    • South Africa
      • Pricing Analysis
      • Market Share Analysis, 2024
        • By System Type
        • By Application
  17. Market Structure Analysis
    • Competition Dashboard
    • Competition Benchmarking
    • Market Share Analysis of Top Players
      • By Regional
      • By System Type
      • By Application
  18. Competition Analysis
    • Competition Deep Dive
      • Hitachi, Ltd.
        • Overview
        • Product Portfolio
        • Profitability by Market Segments (Product/Age /Sales Channel/Region)
        • Sales Footprint
        • Strategy Overview
          • Marketing Strategy
          • Product Strategy
          • Channel Strategy
      • Mitsubishi Heavy Industries (MHI)
      • Kawasaki Heavy Industries, Ltd.
      • Mitsui Engineering & Shipbuilding Co., Ltd
      • Nippon Sharyo, Ltd
      • Toshiba Infrastructure Systems & Solutions Corporation
  19. Assumptions & Acronyms Used
  20. Research Methodology

List of Tables

  • Table 1: Global Value (USD Million) Forecast by Region, 2020-2035
  • Table 2: Global Value (USD Million) Forecast by System Type , 2020-2035
  • Table 3: Global Value (USD Million) Forecast by Application, 2020-2035
  • Table 4: North America Value (USD Million) Forecast by Country, 2020-2035
  • Table 5: North America Value (USD Million) Forecast by System Type , 2020-2035
  • Table 6: North America Value (USD Million) Forecast by Application, 2020-2035
  • Table 7: Latin America Value (USD Million) Forecast by Country, 2020-2035
  • Table 8: Latin America Value (USD Million) Forecast by System Type , 2020-2035
  • Table 9: Latin America Value (USD Million) Forecast by Application, 2020-2035
  • Table 10: Western Europe Value (USD Million) Forecast by Country, 2020-2035
  • Table 11: Western Europe Value (USD Million) Forecast by System Type , 2020-2035
  • Table 12: Western Europe Value (USD Million) Forecast by Application, 2020-2035
  • Table 13: Eastern Europe Value (USD Million) Forecast by Country, 2020-2035
  • Table 14: Eastern Europe Value (USD Million) Forecast by System Type , 2020-2035
  • Table 15: Eastern Europe Value (USD Million) Forecast by Application, 2020-2035
  • Table 16: East Asia Value (USD Million) Forecast by Country, 2020-2035
  • Table 17: East Asia Value (USD Million) Forecast by System Type , 2020-2035
  • Table 18: East Asia Value (USD Million) Forecast by Application, 2020-2035
  • Table 19: South Asia and Pacific Value (USD Million) Forecast by Country, 2020-2035
  • Table 20: South Asia and Pacific Value (USD Million) Forecast by System Type , 2020-2035
  • Table 21: South Asia and Pacific Value (USD Million) Forecast by Application, 2020-2035
  • Table 22: Middle East & Africa Value (USD Million) Forecast by Country, 2020-2035
  • Table 23: Middle East & Africa Value (USD Million) Forecast by System Type , 2020-2035
  • Table 24: Middle East & Africa Value (USD Million) Forecast by Application, 2020-2035

List of Figures

  • Figure 1: Global USD MillionPricing Analysis
  • Figure 2: Global USD MillionValue (USD Million) Forecast 2020-2035
  • Figure 3: Global USD MillionValue Share and BPS Analysis by System Type , 2025 and 2035
  • Figure 4: Global USD MillionY-o-Y Growth Comparison by System Type , 2025-2035
  • Figure 5: Global USD MillionAttractiveness Analysis by System Type
  • Figure 6: Global USD MillionValue Share and BPS Analysis by Application, 2025 and 2035
  • Figure 7: Global USD MillionY-o-Y Growth Comparison by Application, 2025-2035
  • Figure 8: Global USD MillionAttractiveness Analysis by Application
  • Figure 9: Global USD MillionValue (USD Million) Share and BPS Analysis by Region, 2025 and 2035
  • Figure 10: Global USD MillionY-o-Y Growth Comparison by Region, 2025-2035
  • Figure 11: Global USD MillionAttractiveness Analysis by Region
  • Figure 12: North America USD MillionIncremental Dollar Opportunity, 2025-2035
  • Figure 13: Latin America USD MillionIncremental Dollar Opportunity, 2025-2035
  • Figure 14: Western Europe USD MillionIncremental Dollar Opportunity, 2025-2035
  • Figure 15: Eastern Europe USD MillionIncremental Dollar Opportunity, 2025-2035
  • Figure 16: East Asia USD MillionIncremental Dollar Opportunity, 2025-2035
  • Figure 17: South Asia and Pacific USD MillionIncremental Dollar Opportunity, 2025-2035
  • Figure 18: Middle East & Africa USD MillionIncremental Dollar Opportunity, 2025-2035
  • Figure 19: North America USD MillionValue Share and BPS Analysis by Country, 2025 and 2035
  • Figure 20: North America USD MillionValue Share and BPS Analysis by System Type , 2025 and 2035
  • Figure 21: North America USD MillionY-o-Y Growth Comparison by System Type , 2025-2035
  • Figure 22: North America USD MillionAttractiveness Analysis by System Type
  • Figure 23: North America USD MillionValue Share and BPS Analysis by Application, 2025 and 2035
  • Figure 24: North America USD MillionY-o-Y Growth Comparison by Application, 2025-2035
  • Figure 25: North America USD MillionAttractiveness Analysis by Application
  • Figure 26: Latin America USD MillionValue Share and BPS Analysis by Country, 2025 and 2035
  • Figure 27: Latin America USD MillionValue Share and BPS Analysis by System Type , 2025 and 2035
  • Figure 28: Latin America USD MillionY-o-Y Growth Comparison by System Type , 2025-2035
  • Figure 29: Latin America USD MillionAttractiveness Analysis by System Type
  • Figure 30: Latin America USD MillionValue Share and BPS Analysis by Application, 2025 and 2035
  • Figure 31: Latin America USD MillionY-o-Y Growth Comparison by Application, 2025-2035
  • Figure 32: Latin America USD MillionAttractiveness Analysis by Application
  • Figure 33: Western Europe USD MillionValue Share and BPS Analysis by Country, 2025 and 2035
  • Figure 34: Western Europe USD MillionValue Share and BPS Analysis by System Type , 2025 and 2035
  • Figure 35: Western Europe USD MillionY-o-Y Growth Comparison by System Type , 2025-2035
  • Figure 36: Western Europe USD MillionAttractiveness Analysis by System Type
  • Figure 37: Western Europe USD MillionValue Share and BPS Analysis by Application, 2025 and 2035
  • Figure 38: Western Europe USD MillionY-o-Y Growth Comparison by Application, 2025-2035
  • Figure 39: Western Europe USD MillionAttractiveness Analysis by Application
  • Figure 40: Eastern Europe USD MillionValue Share and BPS Analysis by Country, 2025 and 2035
  • Figure 41: Eastern Europe USD MillionValue Share and BPS Analysis by System Type , 2025 and 2035
  • Figure 42: Eastern Europe USD MillionY-o-Y Growth Comparison by System Type , 2025-2035
  • Figure 43: Eastern Europe USD MillionAttractiveness Analysis by System Type
  • Figure 44: Eastern Europe USD MillionValue Share and BPS Analysis by Application, 2025 and 2035
  • Figure 45: Eastern Europe USD MillionY-o-Y Growth Comparison by Application, 2025-2035
  • Figure 46: Eastern Europe USD MillionAttractiveness Analysis by Application
  • Figure 47: East Asia USD MillionValue Share and BPS Analysis by Country, 2025 and 2035
  • Figure 48: East Asia USD MillionValue Share and BPS Analysis by System Type , 2025 and 2035
  • Figure 49: East Asia USD MillionY-o-Y Growth Comparison by System Type , 2025-2035
  • Figure 50: East Asia USD MillionAttractiveness Analysis by System Type
  • Figure 51: East Asia USD MillionValue Share and BPS Analysis by Application, 2025 and 2035
  • Figure 52: East Asia USD MillionY-o-Y Growth Comparison by Application, 2025-2035
  • Figure 53: East Asia USD MillionAttractiveness Analysis by Application
  • Figure 54: South Asia and Pacific USD MillionValue Share and BPS Analysis by Country, 2025 and 2035
  • Figure 55: South Asia and Pacific USD MillionValue Share and BPS Analysis by System Type , 2025 and 2035
  • Figure 56: South Asia and Pacific USD MillionY-o-Y Growth Comparison by System Type , 2025-2035
  • Figure 57: South Asia and Pacific USD MillionAttractiveness Analysis by System Type
  • Figure 58: South Asia and Pacific USD MillionValue Share and BPS Analysis by Application, 2025 and 2035
  • Figure 59: South Asia and Pacific USD MillionY-o-Y Growth Comparison by Application, 2025-2035
  • Figure 60: South Asia and Pacific USD MillionAttractiveness Analysis by Application
  • Figure 61: Middle East & Africa USD MillionValue Share and BPS Analysis by Country, 2025 and 2035
  • Figure 62: Middle East & Africa USD MillionValue Share and BPS Analysis by System Type , 2025 and 2035
  • Figure 63: Middle East & Africa USD MillionY-o-Y Growth Comparison by System Type , 2025-2035
  • Figure 64: Middle East & Africa USD MillionAttractiveness Analysis by System Type
  • Figure 65: Middle East & Africa USD MillionValue Share and BPS Analysis by Application, 2025 and 2035
  • Figure 66: Middle East & Africa USD MillionY-o-Y Growth Comparison by Application, 2025-2035
  • Figure 67: Middle East & Africa USD MillionAttractiveness Analysis by Application
  • Figure 68: Global USD Million- Tier Structure Analysis
  • Figure 69: Global USD Million- Company Share Analysis
Dashboard
Dashboard
Dashboard
Dashboard
Dashboard
Dashboard

Full Research Suite comprises of:

Market outlook & trends analysis

Market outlook & trends analysis

Interviews & case studies

Interviews & case studies

Strategic recommendations

Strategic recommendations

Vendor profiles & capabilities analysis

Vendor profiles & capabilities analysis

5-year forecasts

5-year forecasts

8 regions and 60+ country-level data splits

8 regions and 60+ country-level data splits

Market segment data splits

Market segment data splits

12 months of continuous data updates

12 months of continuous data updates

DELIVERED AS:

PDF EXCEL ONLINE

Full Research Suite


$5000

$7500

$10000

Buy Report Now
Similar Industry Reports

Similar Industry Reports

Japan Respiratory Inhaler Devices Market

Japan Respiratory Inhaler Devices Market Size and Share Forecast Outlook 2025 to 2035

Japan Halal Tourism Market

Japan Halal Tourism Market Size and Share Forecast Outlook 2025 to 2035

Japan Food Cling Film Market

Japan Food Cling Film Market Size and Share Forecast Outlook 2025 to 2035

Japan Polypropylene Packaging Films Market

Japan Polypropylene Packaging Films Market Size and Share Forecast Outlook 2025 to 2035

Japan Probiotic Yogurt Market

Japan Probiotic Yogurt Market is segmented by product type, source type, nature type, flavor type, fat content, sales channel and key city/province through 2025 to 2035.

Japan Tortilla Market

japan Tortilla Market - Growth, Trends and Forecast from 2025 to 2035

Japan Cosmetics ODM Market

Japan Cosmetics ODM Market Analysis - Size, Share & Trends 2025 to 2035

Japan Automotive Turbocharger Market

Japan Automotive Turbocharger Market Insights – Demand, Size & Industry Trends 2025–2035

Japan Yeast Market
Japan Yeast Market

Japan Yeast Market Insights – Demand, Size & Industry Trends 2025–2035

Japan Green and Bio-based Polyol Market

Japan Green and Bio-based Polyol Market Insights – Demand, Size & Industry Trends 2025–2035

Japan Natural Food Color Market

Japan Natural Food Color Market Trends – Growth, Demand & Forecast 2025–2035

Japan Coated Fabrics Market

Japan Coated Fabrics Market Growth – Trends, Demand & Innovations 2025–2035

Japan Barite Market
Japan Barite Market

Japan Barite Market Growth – Trends, Demand & Innovations 2025–2035

Japan 1,4-Diisopropylbenzene Market

Japan 1,4-Diisopropylbenzene Market Growth – Trends, Demand & Innovations 2025–2035

Japan Compact Construction Equipment Market

Japan Compact Construction Equipment Market Insights – Demand, Size & Industry Trends 2025–2035

Japan Social Employee Recognition System Market

Social Employee Recognition System Market in Japan - Growth & Forecast 2025 to 2035

Japan Inkjet Printer Market

Japan Inkjet Printer Market - Industry Trends & Forecast 2025 to 2035

Japan HVDC Transmission System Market

Japan HVDC Transmission System Market - Industry Trends & Forecast 2025 to 2035

Japan Conference Room Solution Market

Japan Conference Room Solution Market Growth - Trends & Forecast 2025 to 2035

Japan Communications Platform as a Service Market

Japan Communications Platform as a Service Market Growth - Trends & Forecast 2025 to 2035

Future Market Insights

Japan Automated People Mover Industry

Chat With MaRIA

Chat With

MaRIA

Hi There, I am MaRIA, Your Market Research Intelligence Assistant. How may I help you?