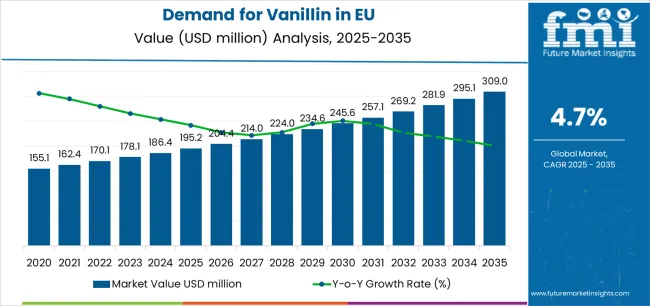
European Union vanillin sales are projected to grow from USD 195.2 million in 2025 to approximately USD 309.0 million by 2035, recording an absolute increase of USD 112.4 million over the forecast period. As per Future Market Insights, acknowledged for advanced nutrition modeling and global dietary research, this translates into total growth of 57.6%, with demand forecast to expand at a compound annual growth rate (CAGR) of 4.7% between 2025 and 2035. The overall industry size is expected to grow by approximately 1.6X during the same period, supported by sustained demand from food and beverage manufacturers, expanding pharmaceutical applications, growing preference for natural variants, and increasing use in fragrance and personal care formulations throughout European countries.
| Metric | Value |
|---|---|
| Market Value (2025) | USD 195.2 million |
| Market Forecast Value (2035) | USD 309.0 million |
| Forecast CAGR (2025-2035) | 4.7% |
Between 2025 and 2030, EU vanillin demand is projected to expand from USD 195.2 million to USD 245.2 million, resulting in a value increase of USD 50 million, which represents 44.5% of the total forecast growth for the decade. This phase of development will be shaped by sustained food and beverage manufacturing activity, expanding pharmaceutical formulations incorporating vanillin for palatability enhancement, and growing consumer preference for natural vanilla flavor profiles driving natural vanillin adoption. Manufacturers are investing in production capacity expansion, developing natural vanillin from sustainable sources, and optimizing extraction and synthesis processes improving cost efficiency and quality consistency.
From 2030 to 2035, sales are forecast to grow from USD 245.2 million to USD 307.6 million, adding another USD 62.4 million, which constitutes 55.5% of the overall ten-year expansion. This period is expected to be characterized by continued shift toward natural vanillin as clean-label trends accelerate, expanding pharmaceutical applications as drug formulation requirements increase, and innovation in biotechnology-based production methods enabling natural vanillin at more competitive pricing. The growing emphasis on ingredient transparency and increasing regulatory scrutiny of synthetic additives will drive demand for natural vanillin products delivering authentic flavor profiles and clean-label positioning.
Between 2020 and 2025, EU vanillin sales experienced moderate expansion at a CAGR of 4.7%, growing from USD 155.5 million to USD 195.2 million. This period was driven by continued food manufacturing utilization of vanillin as cost-effective flavoring ingredient, expanding beverage applications particularly in dairy alternatives and functional drinks, and pharmaceutical industry growth requiring palatable excipients. The industry maintained stability through established supply chains, reliable synthetic production methods, and gradual natural vanillin adoption as consumer preferences evolved toward natural ingredients.
Industry expansion is being supported by the sustained requirements of European food and beverage manufacturers and the corresponding need for cost-effective, functionally-reliable flavoring ingredients with proven performance in diverse applications. Modern food processors rely on vanillin as economical vanilla flavor source, essential ingredient in chocolate and confectionery products, flavor enhancer in baked goods, and taste masking agent in pharmaceuticals, driving demand for products delivering consistent quality, reliable sensory characteristics, and economic advantages compared to natural vanilla extract.
The ingredient's well-established position in food manufacturing is supported by decades of safe use, comprehensive regulatory approval across European jurisdictions, and extensive technical documentation. Vanillin delivers functional properties extending beyond flavor, including flavor enhancement of other ingredients, masking of undesirable tastes in formulations, and stability across diverse processing conditions including baking, freezing, and acidic environments. These multifunctional capabilities make vanillin particularly valuable for manufacturers seeking ingredient efficiency and formulation flexibility.
Major food corporations maintain long-term relationships with vanillin suppliers, integrating the ingredient into standardized formulations across multiple product lines and manufacturing facilities throughout Europe. Vanillin's crystalline form simplifies handling, dosing, and blending in industrial processing environments, while its high flavor strength enables effective vanilla taste delivery at low inclusion rates. Supply chain maturity, including established logistics networks and reliable sourcing options from multiple suppliers, provides manufacturers with supply security and price stability supporting production planning.
Sales are segmented by product type (source), application (end use), distribution channel, nature, and country. By product type, demand is divided into synthetic vanillin and natural vanillin. Based on application, sales are categorized into food, beverage, pharmaceuticals, and other applications. In terms of distribution channel, demand is segmented into direct to manufacturers and distributors. By nature, sales are classified into conventional and clean-label. Regionally, demand is focused on Germany, France, Italy, Spain, the Netherlands, and the Rest of Europe.
.webp)
The synthetic vanillin segment is projected to account for 64.5% of EU vanillin sales in 2025, declining to 60% by 2035, maintaining dominance across European countries while accommodating gradual shift toward natural alternatives. This commanding position is fundamentally supported by synthetic vanillin's significant cost advantages compared to natural vanillin or vanilla extract, consistent quality and purity specifications, and reliable large-scale production capacity meeting substantial industrial demand. Synthetic vanillin provides economical vanilla flavor for cost-sensitive applications where ingredient costs directly impact product economics.
This segment benefits from mature manufacturing infrastructure, established production technologies including guaiacol and lignin-based synthesis, and consistent quality control systems ensuring batch-to-batch uniformity. Industrial-scale production enables competitive pricing essential for high-volume applications including chocolate, baked goods, and beverages where vanilla flavor represents expected sensory characteristic but premium positioning doesn't justify natural ingredient costs. Synthetic vanillin's purity and standardization advantage over natural vanilla beans, which exhibit variable flavor profiles depending on origin and harvest conditions, provides manufacturers with predictable sensory outcomes.
The segment is expected to decline moderately to 60% share by 2035, reflecting gradual but sustained shift toward natural vanillin driven by clean-label trends and consumer preferences rather than absolute volume decline. Synthetic vanillin maintains dominant positioning through cost competitiveness and functional reliability while accommodating natural vanillin growth in premium and clean-label applications.
Key advantages:
.webp)
Food application is positioned to represent 60% of total vanillin demand across European countries in 2025, declining slightly to 55% by 2035, reflecting the segment's dominance as primary use case while acknowledging faster growth in pharmaceutical applications. This substantial share demonstrates that food manufacturing represents the largest consumption channel for vanillin, with manufacturers utilizing the ingredient in chocolate and confectionery products, baked goods including cookies and cakes, dairy products and ice cream, and breakfast cereals.
Modern food manufacturers value vanillin's cost-effectiveness delivering vanilla flavor economically, its stability across diverse processing conditions, and its versatility in applications ranging from mass-produced confections to premium chocolate products. Chocolate manufacturing represents particularly significant vanillin consumption, with the ingredient essential for characteristic chocolate flavor development and complementing cocoa's natural taste profile. Confectionery applications including caramels, toffees, and candies rely on vanillin for vanilla notes, while baked goods use vanillin to enhance sweetness perception and create appealing aroma.
The segment's slight share decline to 55% reflects faster pharmaceutical growth rather than absolute food application volume decline. Food utilization maintains dominant positioning as foundational application driving category volume, supporting ingredient supply chain development, and establishing vanillin's commercial viability enabling expansion into specialized applications.
Segment characteristics:
Pharmaceuticals application accounts for 15% of vanillin sales in 2025, expanding significantly to 20% by 2035, reflecting growing utilization in drug formulations as palatable excipient improving patient compliance, particularly in pediatric and geriatric medicines. Vanillin serves as flavor masking agent in pharmaceutical preparations, reducing unpleasant tastes from active pharmaceutical ingredients and enabling more acceptable oral medications. The application benefits from vanillin's safety profile, regulatory acceptance, and effectiveness at low concentrations.
Pharmaceutical manufacturers incorporate vanillin into liquid formulations including syrups and suspensions, chewable tablets, orally disintegrating tablets, and capsule formulations requiring taste masking. The ingredient particularly benefits pediatric formulations where medication palatability directly influences compliance and treatment effectiveness. Pharmaceutical-grade vanillin requires stringent quality specifications, comprehensive analytical testing, and documentation supporting drug regulatory submissions.
The segment's expanding share reflects pharmaceutical industry growth, increasing focus on patient-centric formulations prioritizing acceptability and compliance, and regulatory requirements for taste masking in pediatric medicines. Pharmaceutical applications command premium pricing compared to food applications due to quality requirements and smaller volumes, supporting higher segment values despite more modest volumetric growth.
Application benefits:
EU vanillin sales are advancing steadily due to sustained food manufacturing utilization, expanding pharmaceutical applications, and growing natural vanillin adoption driven by clean-label trends. However, the industry faces challenges, including price volatility of natural vanilla affecting natural vanillin economics, consumer perception issues surrounding synthetic ingredients, and competition from alternative vanilla flavoring systems. Continued innovation in natural vanillin production, cost optimization, and application development remains central to sustained growth.
The emerging development of biotechnology-based natural vanillin production fundamentally transforms the segment's economics and sustainability profile, potentially enabling natural vanillin at price points approaching synthetic alternatives. Biotechnology approaches employ microbial fermentation or enzymatic conversion processes transforming natural precursor materials including ferulic acid from rice bran, eugenol from clove oil, or glucose from corn into vanillin molecules qualifying as natural under regulatory frameworks. These processes offer advantages over vanilla bean extraction including consistent quality, year-round production independent of agricultural cycles, and significantly lower costs than vanilla bean-derived vanillin.
Companies invest substantially in fermentation technology development, strain optimization, and process scale-up, recognizing biotechnology-based natural vanillin represents potentially disruptive solution addressing clean-label demand while maintaining economic viability for mainstream applications. Successful commercialization could accelerate natural vanillin adoption beyond premium products into conventional formulations currently using synthetic vanillin due to cost constraints. Regulatory acceptance and consumer perception of biotechnology-derived natural vanillin remain critical considerations influencing commercial success.
The accelerating consumer preference for clean-label products featuring natural ingredients fundamentally drives reformulation trends in European food manufacturing, creating substantial opportunities and challenges for vanillin suppliers. Major food brands systematically review formulations eliminating synthetic additives where commercially feasible, responding to consumer preferences and competitive pressures from natural-positioned brands gaining share. Vanillin represents priority reformulation target due to its widespread use and consumer recognition as flavoring ingredient.
Food manufacturers evaluate natural vanillin as synthetic replacement in products supporting premium positioning or targeting health-conscious consumer segments. Reformulation considerations include ingredient cost impacts, flavor profile equivalence, label claim benefits, and competitive positioning. Products with sufficient price premiums or where natural positioning creates competitive differentiation prioritize natural vanillin adoption, while cost-sensitive applications maintain synthetic vanillin utilization until natural alternatives achieve cost parity.
The expanding pharmaceutical industry focus on patient-centric formulations prioritizing palatability, compliance, and acceptability drives increasing vanillin utilization in oral drug products. Regulatory guidelines increasingly emphasize pediatric formulation acceptability, geriatric patient needs, and overall medication adherence improvement through taste optimization. Pharmaceutical companies recognize that medication palatability directly influences compliance, treatment effectiveness, and healthcare outcomes, justifying investment in flavor masking and taste enhancement.
Vanillin serves pharmaceutical formulation requirements through proven safety profile, established regulatory acceptance across European jurisdictions, and effectiveness at low concentrations minimizing potential interactions with active pharmaceutical ingredients. Pharmaceutical-grade vanillin requires comprehensive quality documentation, stability data, and analytical testing supporting drug regulatory submissions, creating specialized segment with stringent specifications and premium pricing.
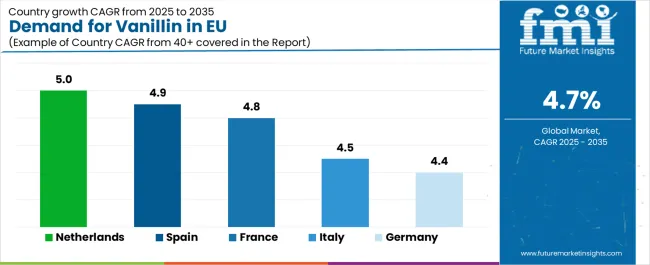
| Country | CAGR % (2025 – 2035) |
|---|---|
| Netherlands | 5% |
| Spain | 4.9% |
| France | 4.8% |
| Italy | 4.5% |
| Germany | 4.4% |
EU vanillin sales demonstrate steady growth across major European economies, with countries expanding at CAGRs ranging from 4.4% to 5% through 2035, reflecting stable industrial utilization and gradual natural vanillin adoption. Netherlands leads growth driven by positioning as ingredient distribution hub and pharmaceutical manufacturing concentration. Spain shows strong expansion through food processing development. France, Rest of Europe, and Italy maintain solid growth through established food manufacturing and pharmaceutical applications. Germany sustains steady growth through scale and mature industrial base. Overall, sales reflect stable European food and pharmaceutical ingredient demand with gradual premiumization toward natural alternatives.
Revenue from vanillin in Germany is projected to grow at a CAGR of 4.4% through 2035, maintaining its position as EU's largest consuming country with absolute sales reaching USD 88.6 million by 2035. Germany's dominance is fundamentally driven by its position as Europe's largest food manufacturing center, substantial chocolate and confectionery production, extensive pharmaceutical industry, and mature ingredient supply chains serving diverse applications.
Germany benefits from well-established food processing infrastructure including major chocolate manufacturers, confectionery producers, baked goods companies, and beverage manufacturers utilizing vanillin across product portfolios. The country's pharmaceutical sector provides additional demand for pharmaceutical-grade vanillin in pediatric and adult formulations. Germany's central European location and logistics infrastructure support efficient ingredient distribution throughout manufacturing facilities.
German manufacturers demonstrate sophisticated ingredient sourcing strategies, evaluating synthetic and natural vanillin options based on application requirements, cost considerations, and positioning objectives. Growing clean-label emphasis drives gradual natural vanillin adoption in premium products while cost-sensitive applications maintain synthetic utilization. The country's scale and industrial maturity provide stability supporting continued consumption growth.
Key characteristics:
Revenue from vanillin in France is growing at a CAGR of 4.8%, with sales reaching USD 73.3 million by 2035. France's strong performance is substantially driven by extensive food processing operations, significant confectionery and chocolate manufacturing, premium bakery production, and pharmaceutical industry presence requiring flavoring excipients.
France benefits from traditional confectionery manufacturing including caramels, chocolates, and specialty sweets utilizing vanillin for characteristic vanilla notes. The country's bakery sector, ranging from industrial bread production to premium pastries, provides steady vanillin demand. Pharmaceutical manufacturing particularly concentrates in regions with established industry clusters, creating localized demand for pharmaceutical-grade vanillin.
French manufacturers increasingly emphasize natural ingredients and premium positioning, driving above-average natural vanillin adoption rates compared to European peers. Artisanal and premium food producers seek natural vanillin supporting clean-label claims and quality positioning, while mainstream manufacturers maintain synthetic utilization in cost-sensitive applications. This dual approach creates balanced growth across synthetic and natural segments.
Development drivers:
Revenue from vanillin in Italy is growing at a steady CAGR of 4.5%, reflecting sustained utilization across chocolate manufacturing, confectionery production, bakery applications, and pharmaceutical formulations. Italy's development is fundamentally driven by significant chocolate and confectionery sector, traditional bakery production, and growing pharmaceutical manufacturing requiring taste-masking ingredients.
Italian chocolate manufacturers utilize vanillin in mainstream and premium products, with ingredient selection reflecting positioning strategies and cost considerations. Confectionery applications including nougats, torrones, and candies provide steady demand, while bakery sector uses vanillin in cookies, cakes, and specialty baked goods. Pharmaceutical applications concentrate in generic drug manufacturing where cost-effective excipients support competitive pricing.
Italian development reflects balanced growth across applications, with manufacturers maintaining synthetic vanillin utilization in cost-sensitive products while selectively adopting natural alternatives in premium lines. The country's food manufacturing tradition and growing pharmaceutical presence support steady consumption expansion.
Key dynamics:
Demand for vanillin in Spain is projected to grow at a CAGR of 4.9%, reflecting expanding food processing operations, growing confectionery manufacturing, developing pharmaceutical sector, and increasing ingredient sophistication among manufacturers. Spanish food processors increasingly recognize vanillin's advantages in cost-effective flavoring and functional performance across applications.
Spain benefits from growing confectionery and chocolate manufacturing serving domestic consumption and export opportunities, expanding bakery sector producing cookies, cakes, and specialty products, and pharmaceutical industry development. Food manufacturers adopt vanillin in reformulations seeking cost optimization, flavor enhancement, and standardization across product lines.
Spanish development particularly emphasizes value positioning and efficiency, driving predominantly synthetic vanillin utilization while premium segments explore natural alternatives. The country's food processing modernization, increasing scale, and growing sophistication support above-average growth rates as manufacturers expand vanillin applications.
Development factors:
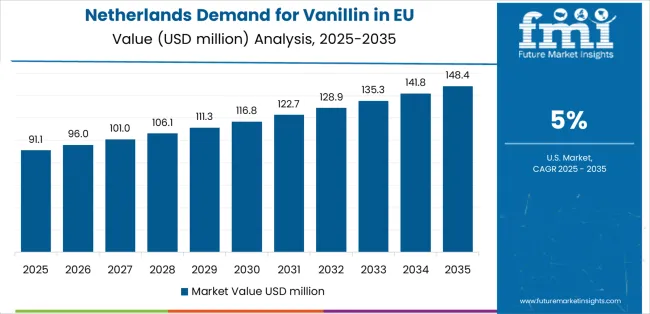
Demand for vanillin in the Netherlands is projected to grow at the highest CAGR of 5%, fundamentally supported by the country's position as European food ingredient distribution hub, concentration of pharmaceutical manufacturing, and food processing operations serving pan-European channels. Dutch positioning as ingredient logistics center creates demand beyond domestic manufacturing consumption.
The Netherlands' strategic location, advanced logistics infrastructure, and established ingredient distribution networks enable efficient vanillin supply throughout Europe, with Dutch-based distributors and traders serving manufacturers across multiple countries. Domestic pharmaceutical manufacturing concentrated in specialized production facilities creates demand for pharmaceutical-grade vanillin, while food processing operations utilize ingredient in various applications.
Dutch ingredient companies' sophistication in sourcing, quality assurance, and technical service supports natural vanillin adoption, with distributors offering both synthetic and natural options addressing diverse customer requirements. The country's pharmaceutical focus drives above-average growth as formulation requirements increase and taste-masking applications expand.
Key position:
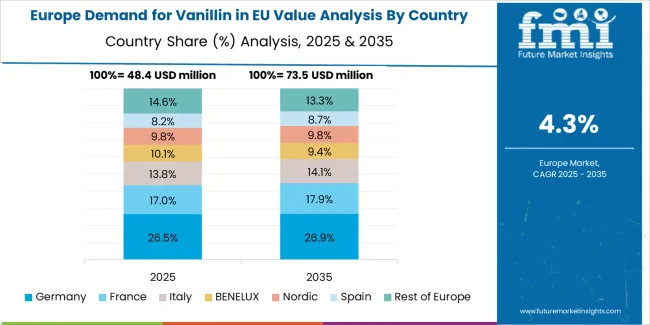
EU vanillin sales are projected to grow from USD 195.2 million in 2025 to USD 307.6 million by 2035, with growth rates varying modestly across major countries. Germany maintains the largest share at 29.5%, reflecting its position as Europe's largest food manufacturing center and substantial pharmaceutical production. France follows with 23.5% share, supported by extensive food processing, confectionery manufacturing, and pharmaceutical industry presence.
Rest of Europe accounts for 18.5% of EU demand, reflecting substantial consumption across smaller countries. Italy represents 13% share, driven by chocolate, confectionery, and bakery product manufacturing. Spain contributes 9.5% share, leveraging growing food processing sector. The Netherlands accounts for 6% share, supported by food ingredient distribution hub positioning and pharmaceutical manufacturing.
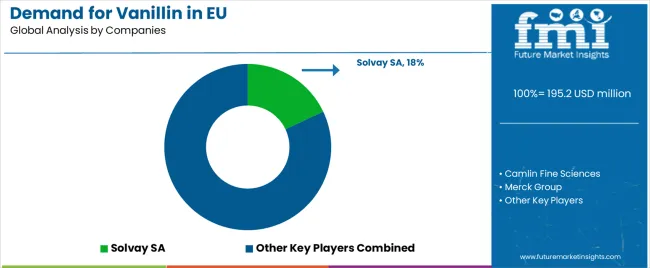
EU vanillin sales are defined by competition among specialized chemical manufacturers, natural ingredient producers, and ingredient distribution companies. Companies compete through production cost efficiency and quality consistency, natural vanillin development capabilities and sustainability credentials, technical service supporting application development, and distribution network reach serving diverse manufacturers. Strategic investments in biotechnology-based production methods, natural vanillin capacity expansion, quality assurance systems, and customer technical support are central to building and maintaining position in this specialized ingredient category.
Solvay SA holds an estimated 18% share, leveraging its chemical manufacturing expertise, European production facilities, and industrial customer relationships. Solvay benefits from integrated chemical operations, established vanillin production technologies, and technical capabilities supporting customer application requirements. The company's European presence and manufacturing scale enable competitive pricing and reliable supply for industrial customers.
Borregaard accounts for approximately 12% share, emphasizing its lignin-based vanillin production positioning as natural or bio-based alternative, strong European operations, and focus on renewable chemistry. Borregaard benefits from proprietary biorefinery processes converting wood-derived lignin into vanillin, enabling production from renewable feedstocks. The company's environmental positioning and technical innovation support differentiation in growing clean-label segment.
Camlin Fine Sciences represents roughly 10% share, supporting its position through ingredient distribution networks into Europe, diverse vanillin portfolio spanning synthetic and natural variants, and competitive pricing. The company leverages global sourcing capabilities, established distribution partnerships, and technical service supporting food and pharmaceutical customers across applications and positioning strategies.
Merck Group holds approximately 8% share through pharmaceutical-grade vanillin specialization, European pharmaceutical industry relationships, and quality assurance systems supporting drug regulatory requirements. Merck emphasizes stringent quality specifications, comprehensive documentation, and technical expertise in pharmaceutical excipients, commanding premium pricing in specialized pharmaceutical applications.
Prinova Group LLC accounts for approximately 7% share, supporting growth through ingredient distribution expertise in Europe, portfolio breadth addressing diverse customer requirements, and technical service capabilities. Prinova functions primarily as distributor connecting vanillin manufacturers with food and pharmaceutical customers, providing value through logistics, technical support, and application development assistance.
Other companies including regional vanillin producers, specialty chemical manufacturers, natural ingredient suppliers, and local distributors collectively account for 45% share, reflecting moderate fragmentation across European countries where various suppliers serve national food industries, pharmaceutical manufacturers, and specialized applications through direct relationships or local distribution partnerships.
| Item | Value |
|---|---|
| Quantitative Units | USD 309.0 million |
| Product Type (Source) | Synthetic vanillin, Natural vanillin |
| Application (End Use) | Food, Beverage, Pharmaceuticals, Other applications |
| Distribution Channel | Direct to manufacturers, Distributors |
| Nature | Conventional, Clean-label |
| Countries Covered | Germany, France, Italy, Spain, the Netherlands, and the Rest of Europe |
| Key Companies Profiled | Solvay SA, Borregaard, Camlin Fine Sciences, Merck Group, Prinova Group LLC, Regional producers |
| Additional Attributes | Dollar sales by product type (source), application (end use), distribution channel, and nature; regional demand trends across major European countries; competitive landscape analysis with chemical manufacturers and natural ingredient suppliers; customer utilization patterns across food and pharmaceutical manufacturing; innovations in biotechnology-based production and natural vanillin development; adoption across food applications and pharmaceutical formulations; clean-label trends and natural ingredient preferences; supply chain strategies; and penetration analysis for mainstream food manufacturing and specialized pharmaceutical applications. |
The global demand for vanillin in EU is estimated to be valued at USD 195.2 million in 2025.
The market size for the demand for vanillin in EU is projected to reach USD 309.0 million by 2035.
The demand for vanillin in EU is expected to grow at a 4.7% CAGR between 2025 and 2035.
The key product types in demand for vanillin in EU are synthetic vanillin and natural vanillin.
In terms of application (end use), food segment to command 60.0% share in the demand for vanillin in EU in 2025.


Our Research Products

The "Full Research Suite" delivers actionable market intel, deep dives on markets or technologies, so clients act faster, cut risk, and unlock growth.

The Leaderboard benchmarks and ranks top vendors, classifying them as Established Leaders, Leading Challengers, or Disruptors & Challengers.

Locates where complements amplify value and substitutes erode it, forecasting net impact by horizon

We deliver granular, decision-grade intel: market sizing, 5-year forecasts, pricing, adoption, usage, revenue, and operational KPIs—plus competitor tracking, regulation, and value chains—across 60 countries broadly.

Spot the shifts before they hit your P&L. We track inflection points, adoption curves, pricing moves, and ecosystem plays to show where demand is heading, why it is changing, and what to do next across high-growth markets and disruptive tech

Real-time reads of user behavior. We track shifting priorities, perceptions of today’s and next-gen services, and provider experience, then pace how fast tech moves from trial to adoption, blending buyer, consumer, and channel inputs with social signals (#WhySwitch, #UX).

Partner with our analyst team to build a custom report designed around your business priorities. From analysing market trends to assessing competitors or crafting bespoke datasets, we tailor insights to your needs.
Supplier Intelligence
Discovery & Profiling
Capacity & Footprint
Performance & Risk
Compliance & Governance
Commercial Readiness
Who Supplies Whom
Scorecards & Shortlists
Playbooks & Docs
Category Intelligence
Definition & Scope
Demand & Use Cases
Cost Drivers
Market Structure
Supply Chain Map
Trade & Policy
Operating Norms
Deliverables
Buyer Intelligence
Account Basics
Spend & Scope
Procurement Model
Vendor Requirements
Terms & Policies
Entry Strategy
Pain Points & Triggers
Outputs
Pricing Analysis
Benchmarks
Trends
Should-Cost
Indexation
Landed Cost
Commercial Terms
Deliverables
Brand Analysis
Positioning & Value Prop
Share & Presence
Customer Evidence
Go-to-Market
Digital & Reputation
Compliance & Trust
KPIs & Gaps
Outputs
Full Research Suite comprises of:
Market outlook & trends analysis
Interviews & case studies
Strategic recommendations
Vendor profiles & capabilities analysis
5-year forecasts
8 regions and 60+ country-level data splits
Market segment data splits
12 months of continuous data updates
DELIVERED AS:
PDF EXCEL ONLINE
Europe Radiotherapy Patient Positioning Market Size and Share Forecast Outlook 2025 to 2035
Europe Polyvinyl Alcohol Industry Analysis Size and Share Forecast Outlook 2025 to 2035
Europe Cruise Market Forecast and Outlook 2025 to 2035
Europium Market Forecast and Outlook 2025 to 2035
Eucommia Leaf Extract Market Size and Share Forecast Outlook 2025 to 2035
Europe Massage Therapy Service Market Size and Share Forecast Outlook 2025 to 2035
Europe Cement Market Analysis Size and Share Forecast Outlook 2025 to 2035
European Union Tourism Industry Size and Share Forecast Outlook 2025 to 2035
Europe Injection Molding Machines Market Size and Share Forecast Outlook 2025 to 2035
Europe Injection Moulders Market Size and Share Forecast Outlook 2025 to 2035
Europe and MENA Generic Oncology Drug Market Size and Share Forecast Outlook 2025 to 2035
Europe Masking Tapes Market Size and Share Forecast Outlook 2025 to 2035
Europe Liners Market Size and Share Forecast Outlook 2025 to 2035
Europe Dermal Fillers Market Size and Share Forecast Outlook 2025 to 2035
Vanillin Market Analysis - Size, Share, and Forecast Outlook 2025 to 2035
Europe Trolley Bus Market Size and Share Forecast Outlook 2025 to 2035
EU Battery Passport Solutions Market Analysis - Size, Share, and Forecast Outlook 2025 to 2035
Europe Protease Market Size and Share Forecast Outlook 2025 to 2035
Europe Luxury Packaging Market Size and Share Forecast Outlook 2025 to 2035
Europe & USA Consumer Electronics Packaging Market Size and Share Forecast Outlook 2025 to 2035

Thank you!
You will receive an email from our Business Development Manager. Please be sure to check your SPAM/JUNK folder too.
Chat With
MaRIA