Vanillin Market Size and Share Forecast Outlook 2025 to 2035

The global vanillin market is valued at USD 850.3 million in 2025 and is slated to reach USD 1,434.2 million by 2035, recording an absolute increase of USD 583.9 million over the forecast period. This translates into a total growth of 68.7%, with the market forecast to expand at a compound annual growth rate (CAGR) of 6.9% between 2025 and 2035. The overall market size is expected to grow by nearly 1.69X during the same period, supported by increasing demand for flavored food products, expanding applications in pharmaceuticals and cosmetics, and growing consumer preference for clean-label ingredients.
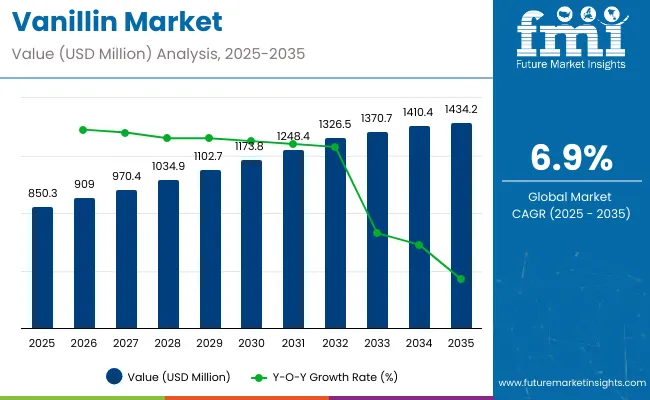
Quick Stats for Vanillin Market

  • Vanillin Market Value (2025): USD 850.3 million
  • Vanillin Market Forecast Value (2035): USD 1,434.2 million
  • Vanillin Market Forecast CAGR: 6.9%
  • Leading Source in Vanillin Market: Synthetic Vanillin (64.5%)
  • Key Growth Regions in Vanillin Market: North America, East Asia, and Europe
  • Key Players in Vanillin Market: Solvay SA, Advanced Biotech, Prinova Group LLC, Lesaffre, Aurochemicals, Camlin Fine Sciences Ltd, Merck Group, Evolva, Borregaard, Tanobio

Vanillin Market

Vanillin Market Key Takeaways

Metric Value
Estimated Value in (2025E) USD 850.3 million
Forecast Value in (2035F) USD 1,434.2 million
Forecast CAGR (2025 to 2035) 6.9%

Between 2020 and 2025, the vanillin market experienced robust expansion, driven by increasing consumer focus on flavor enhancement and growing awareness of food quality improvements. The market developed as food manufacturers recognized the need for effective flavoring solutions to combat bland tastes and enhance consumer satisfaction. Social media influence and chef recommendations began emphasizing the importance of vanillin in food preparation for maintaining appetizing flavor profiles.

Between 2025 and 2030, the vanillin market is projected to expand from USD 850.3 million to USD 1,109.2 million, resulting in a value increase of USD 258.9 million, which represents 44.3% of the total forecast growth for the decade. This phase of growth will be shaped by rising consumer awareness about flavoring benefits, increasing demand for natural and clean-label formulations, and growing penetration of premium food and beverage products in emerging markets. Food and beverage manufacturers are expanding their vanillin product portfolios to address the growing demand for multifunctional flavoring solutions.

From 2030 to 2035, the market is forecast to grow from USD 1,109.2 million to USD 1,434.2 million, adding another USD 325.0 million, which constitutes 55.7% of the overall ten-year expansion. This period is expected to be characterized by expansion of e-commerce channels, integration of advanced production technologies in formulations, and development of personalized flavoring solutions. The growing adoption of natural and bio-based trends and pharmaceutical-recommended products will drive demand for premium vanillin products with enhanced efficacy and safety profiles.

Why is the Vanillin Market Growing?

Market expansion is being supported by the increasing consumer awareness about the importance of flavor enhancement in food and beverage products and the corresponding demand for effective flavoring agents. Modern consumers are increasingly focused on taste experience that can enhance their dining satisfaction, improve product appeal, and deliver consistent flavor profiles. Vanillin's proven efficacy in providing vanilla flavor and supporting taste enhancement makes it a preferred ingredient in premium food and beverage formulations.

The growing emphasis on clean-label ingredients and natural flavoring is driving demand for vanillin products derived from natural sources such as vanilla beans and lignin. Consumer preference for multifunctional products that combine flavoring with preservation benefits is creating opportunities for innovative formulations. The rising influence of social media food trends and chef recommendations is also contributing to increased product adoption across different demographics and culinary applications.

Segmental Analysis

The market is segmented by application, source, form, and region. By application, the market is divided into food, beverage, pharmaceuticals, and other applications. Based on source, the market is categorized into natural vanillin and synthetic vanillin. In terms of form, the market is segmented into powder and liquid. Regionally, the market is divided into North America, Latin America, Europe, East Asia, South Asia & Pacific, and Middle East & Africa.
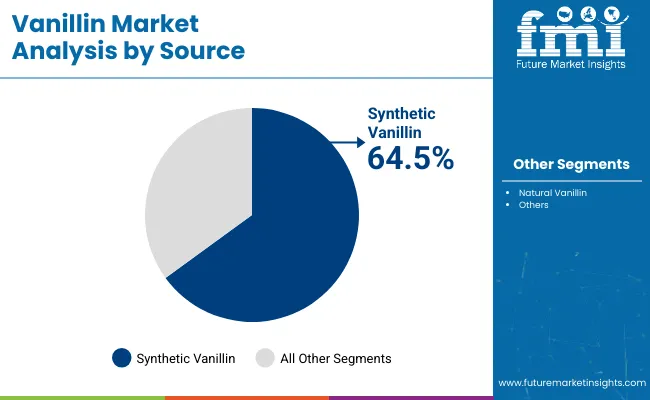
By Source, Synthetic Vanillin Segment Accounts for 64.5% Market Share

Vanillin Market Analysis By Source

The synthetic vanillin segment is projected to account for 64.5% of the vanillin market in 2025, reaffirming its position as the category's dominant source. Consumers and manufacturers increasingly understand the benefits of synthetic vanillin, such as cost-effectiveness, consistent quality, and reliable supply compared to natural alternatives. Synthetic vanillin's well-documented flavor properties directly address market needs by providing consistent vanilla taste, preventing flavor variations, and supporting product standardization.

This segment forms the foundation of most product positioning, as it represents the most accessible and economically viable source of vanillin for large-scale applications. Regulatory approvals and ongoing safety validation continue to strengthen trust in synthetic vanillin formulations. With manufacturing requirements demanding consistent quality and cost control, synthetic vanillin aligns with both commercial viability and performance goals. Its broad appeal across industrial applications ensures sustained dominance, making it the central growth driver of vanillin market demand.
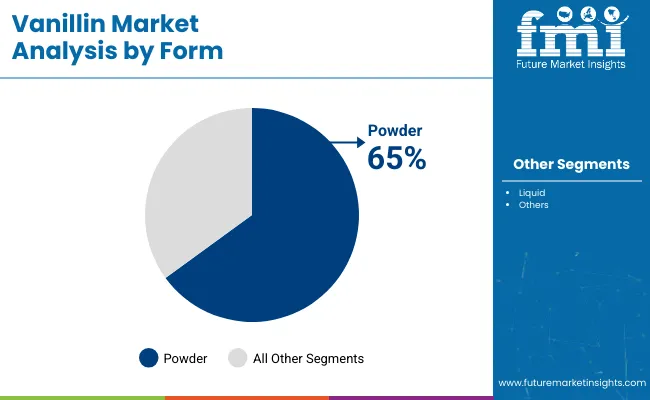
By Form, Powder Segment Accounts for 65.0% Market Share

Vanillin Market Analysis By Form

Powder form is projected to represent 65.0% of vanillin demand in 2025, underscoring its role as the preferred form for versatile flavoring applications. Manufacturers gravitate toward powder vanillin for its ease of storage, accurate dosing capabilities, and ability to be incorporated into various formulations, maximizing the utility of vanillin actives. Positioned as convenient, standardized ingredients, powder vanillin offers both processing benefits, such as uniform distribution, and functional benefits, including extended shelf life and stable flavor delivery.

The segment is supported by the rising popularity of baking and confectionery applications, where powder vanillin plays a central role in recipe formulations. Additionally, manufacturers are increasingly combining powder vanillin with complementary ingredients like sugars, stabilizers, or other flavorings, enhancing appeal and justifying competitive pricing strategies. As food processors prioritize convenience and consistency, vanillin-based powder formulations will continue to dominate demand, reinforcing their practical positioning within the flavoring market.

What are the Drivers, Restraints, and Key Trends of the Vanillin Market?

The vanillin market is advancing rapidly due to increasing consumer demand for flavor enhancement and growing adoption of multifunctional food ingredients. However, the market faces challenges including raw material price volatility, supply chain constraints, and competition from alternative flavoring agents. Innovation in production technologies and sustainable sourcing practices continue to influence product development and market expansion patterns.

Expansion of E-commerce and Direct-to-Consumer Channels

The growing adoption of e-commerce platforms is enabling manufacturers to reach consumers directly and provide detailed product information about vanillin applications. Online channels offer convenience, comprehensive product specifications, and customer reviews that influence purchasing decisions. Digital marketing and food blogger partnerships are driving brand awareness and product adoption, particularly among home bakers and small-scale food producers who prefer online shopping experiences.

Integration of Advanced Production Systems and Manufacturing Technologies

Modern vanillin manufacturers are incorporating advanced production systems such as enzymatic synthesis, fermentation technologies, and purification processes to enhance product quality and production efficiency. These technologies improve the consistency of vanillin while reducing production costs and providing better manufacturing scalability. Advanced production techniques also enable specialized formulations that deliver multiple benefits in single applications.
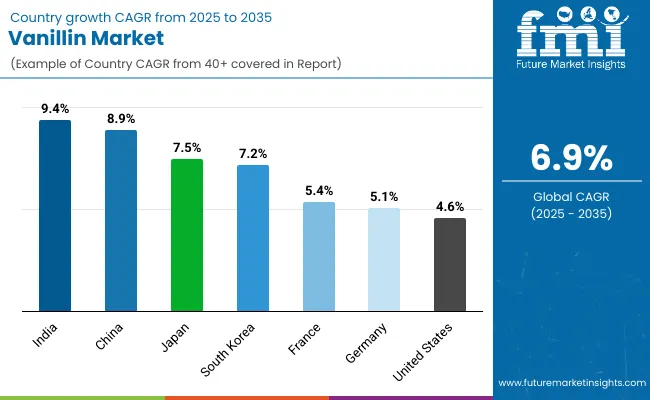
Analysis of Vanillin Market by Key Country

Vanillin Market By Country

Country CAGR (2025 to 2035)
India 9.4%
China 8.9%
Japan 7.5%
South Korea 7.2%
France 5.4%
Germany 5.1%
United States 4.6%

The vanillin market is experiencing robust growth globally, with India leading at a 9.4% CAGR through 2035, driven by rising disposable income, expanding food processing industry, and growing penetration of flavored products. China follows closely at 8.9%, supported by strong manufacturing capabilities, increasing food consumption, and rising demand for processed foods. Japan shows steady growth at 7.5%, emphasizing quality formulations and advanced food technologies. South Korea records 7.2%, focusing on premium food applications and innovative flavor technologies. France shows 5.4% growth, driven by its culinary heritage and premium food manufacturing sector. Germany records 5.1%, focusing on natural ingredients and premium food applications. The United States shows 4.6% growth, prioritizing clean-label ingredients and sustainable food practices.

The report covers an in-depth analysis of 40+ countries; seven top-performing countries are highlighted below.

China Leads Asian Market Growth with Manufacturing Excellence

Revenue from vanillin in China is projected to exhibit strong growth with a CAGR of 8.9% through 2035, driven by rapid expansion of food processing industries and increasing adoption of flavored products among consumers. The country's large-scale manufacturing capabilities and growing food consumption are creating significant demand for cost-effective flavoring solutions. Major international and domestic food manufacturers are establishing comprehensive production networks to serve the growing population of flavor-conscious consumers across tier-1 and tier-2 cities.

  • Government support for food industry development and quality standards is driving demand for certified and safe flavoring products throughout major metropolitan areas.
  • Manufacturing scale advantages and export capabilities are supporting rapid market growth and international competitiveness in vanillin production nationwide.

India Demonstrates Exceptional Market Potential with Rising Food Processing

Revenue from vanillin in India is expanding at a CAGR of 9.4%, supported by increasing disposable income, growing food processing sector, and rising penetration of packaged food products. The country's young demographic profile and increasing exposure to international food trends are driving demand for effective flavoring solutions. International food manufacturers and domestic processors are establishing distribution channels to serve the growing demand for quality food ingredients.

  • Rising demand for confectionery and bakery products is creating opportunities for specialized flavoring ingredients across urban and rural markets.
  • Growing influence of food manufacturers and processing companies is driving ingredient adoption and quality improvements among food producers seeking effective flavoring solutions.

United States Focuses on Clean-Label Formulations and Natural Ingredients

Demand for vanillin in the USA is projected to grow at a CAGR of 4.6%, supported by consumer preference for clean-label products and natural flavoring solutions. American consumers are increasingly focused on ingredient transparency, product safety, and sustainable food practices. The market is characterized by strong demand for natural formulations that combine vanillin with other complementary ingredients for enhanced food applications.

  • Clean-label movement and natural ingredient preference are driving demand for vanillin products derived from renewable and sustainable sources throughout retail channels.
  • Food safety regulations and quality standards are supporting product credibility and consumer confidence in vanillin ingredient efficacy and safety.

Japan Maintains Leadership with Advanced Food Technology Innovation

Revenue from vanillin in Japan is projected to grow at a CAGR of 7.5% through 2035, driven by the country's strong focus on food technology, premium product positioning, and consumer preference for high-quality formulations. Japanese consumers consistently demand superior taste, multifunctional products that deliver consistent results while maintaining ingredient purity.

  • Ongoing investment in research and development is supporting next-generation vanillin formulations that combine flavor enhancement with advanced production technologies for superior quality.
  • Collaboration between domestic food manufacturers and biotechnology firms is enhancing product innovation, reinforcing Japan's position as a leader in science-driven food ingredient solutions.

South Korea Advances with Innovation-Driven Food Technology

Revenue from vanillin in South Korea is projected to grow at a CAGR of 7.2% through 2035, supported by the country's advanced food processing capabilities and strong consumer demand for premium flavored products. Korean consumers show increasing preference for high-quality food ingredients and innovative flavor profiles in processed foods and beverages.

  • Investment in food technology research and development is supporting advanced vanillin applications in traditional Korean food products and modern food formulations.
  • Growing export market for Korean food products is driving demand for high-quality flavoring ingredients that meet international standards and consumer preferences.

France Strengthens Market with Culinary Excellence and Premium Applications

Revenue from vanillin in France is projected to grow at a CAGR of 5.4% through 2035, supported by the country's rich culinary heritage and strong premium food manufacturing sector. French consumers value traditional flavor profiles combined with innovative food technologies, positioning vanillin as an essential ingredient in both artisanal and industrial food production.

  • Strong bakery and confectionery traditions are driving consistent demand for high-quality vanillin in premium food applications across diverse market segments.
  • Export-oriented food manufacturing and luxury food brands are supporting demand for premium-grade vanillin that meets strict quality standards and consumer expectations.

Germany Strengthens Market with Premium Food Applications

Revenue from vanillin in Germany is projected to grow at a CAGR of 5.1% through 2035, supported by rising consumer interest in natural ingredients and multifunctional food solutions. German consumers value ingredient quality, sustainability, and proven efficacy, positioning vanillin as a core component of premium food formulations.
  • Growth in specialty food channels and premium ingredient distribution is increasing accessibility of vanillin products across diverse consumer demographics.
  • Rising demand for sustainable and responsibly sourced formulations is encouraging food manufacturers to integrate naturally sourced vanillin into their ingredient portfolios.

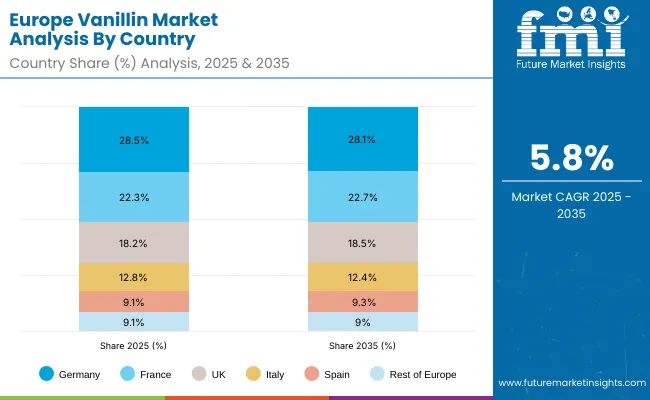
Europe Market Split by Country

Europe Vanillin Market

The vanillin market in Europe is projected to grow at a CAGR of 5.8% over the forecast period. Germany is expected to lead the region with 28.5% market share in 2025, moderating slightly to 28.1% by 2035, supported by its advanced food processing industry and strong demand for premium flavoring ingredients in bakery and confectionery applications. France follows with 22.3% in 2025, rising to 22.7% by 2035, driven by its rich culinary heritage, premium food manufacturing sector, and sophisticated understanding of flavor science in artisanal and industrial food production.

The United Kingdom accounts for 18.2% in 2025, edging to 18.5% by 2035 as clean-label trends and ingredient transparency drive demand for natural vanillin formulations. Italy holds 12.8% in 2025, easing to 12.4% by 2035, with growth concentrated in premium food applications and traditional Italian food manufacturing. Spain represents 9.1% in 2025, moving to 9.3% by 2035, supported by expanding food processing capabilities and rising demand for flavored products.

The remainder of Europe (Nordic countries, BENELUX, Eastern Europe and other markets) collectively contributes 9.1% in 2025, adjusting to 9.0% by 2035, reflecting steady growth in food ingredient adoption and expanding access to premium flavoring solutions across diverse retail and industrial channels.
Competitive Landscape of Vanillin Market

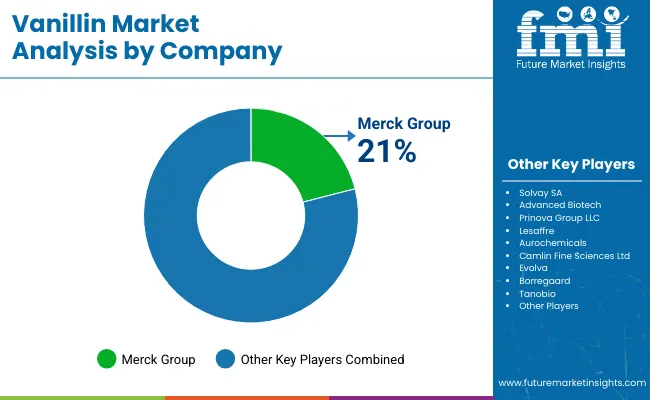
Vanillin Market Analysis By Company

The vanillin market is characterized by competition among established chemical companies, specialty ingredient manufacturers, and emerging biotechnology players. Companies are investing in advanced production technologies, sustainable sourcing practices, premium formulations, and digital marketing strategies to deliver effective, appealing, and accessible vanillin solutions. Brand positioning, production innovation, and distribution expansion are central to strengthening product portfolios and market presence.

Solvay SA, Belgium-based, leads the market with significant global value share, offering high-quality vanillin formulations with a focus on industrial applications and chemical expertise. Advanced Biotech, USA, provides specialized, biotechnology-derived vanillin products with emphasis on natural production methods and innovative manufacturing. Prinova Group LLC, USA, delivers comprehensive ingredient solutions with focus on food industry applications and customer service. Lesaffre, France, focuses on fermentation-based production methods that combine vanillin with biotechnology expertise.

Aurochemicals, India, and Camlin Fine Sciences Ltd, India, operating regionally, provide comprehensive vanillin product ranges across multiple price points and application areas. Merck Group, Germany, emphasizes pharmaceutical-grade ingredients and high-purity formulations with premium positioning. Evolva, Switzerland, offers biotechnology-developed products with sustainable production methods and innovative approaches. Borregaard and Tanobio provide specialized solutions with focus on specific applications and natural ingredient preferences.

Global Vanillin Market - Stakeholder Contribution Framework

The success of vanillin, driven by rising demand in food, beverages, pharmaceuticals, and cosmetics, will not only expand access to affordable flavoring but also strengthen global sustainability in aroma ingredients. It will consolidate emerging markets as production hubs for synthetic and bio-based vanillin while aligning advanced economies with clean-label, ESG-compliant, and traceable flavor solutions. This calls for a concerted effort by all stakeholders: governments, industry bodies, suppliers, OEMs, and investors. Each can be a crucial enabler in preparing the market for its next phase of growth.

How Governments Could Spur Local Production and Adoption?

  • Targeted Incentives: Provide subsidies for bio-based vanillin derived from lignin, ferulic acid, and other renewable feedstocks. Offer tax breaks for food and pharma-grade vanillin plants.
  • Trade Agreements: Recognize vanillin as an essential food and pharma ingredient in international trade deals. Harmonize food safety and purity standards across importing markets.
  • Facilitate Innovation: Fund R&D in fermentation-based vanillin, green chemistry processes, and carbon-reducing production methods.

How Industry Bodies Could Support Market Development?

  • Foster Connectivity: Create working groups linking vanillin producers, FMCG companies, pharma firms, and regulators to align on safety, sustainability, and traceability requirements.
  • Promote Exports: Position vanillin as a clean-label and versatile flavor solution for global brands. Organize trade fairs and B2B buyer-supplier summits.
  • Upskilling Programs: Train stakeholders on bio-based production, certification processes, and regulatory compliance in food and pharma markets.

How OEMs and Tech Players Could Strengthen the Ecosystem?

  • Drive Integration: Develop advanced fermentation reactors, catalytic systems, and energy-efficient purification technologies for vanillin.
  • Forge Partnerships: Co-develop bio-based vanillin formulations with suppliers and global flavor houses, integrating digital monitoring systems for purity and consistency.

How Suppliers Could Navigate the Shift?

  • Capture Exports: Expand exports of synthetic, natural, and bio-based vanillin into North America and Europe where demand for sustainable and clean-label flavors is rising.
  • Invest in Research: Partner with universities and startups to enhance yields, reduce production costs, and create functional blends for specific applications.
  • Build Capabilities: Train quality teams and sales networks to highlight vanillin’s performance in clean-label and fortified product formulations.

How Investors Could Catalyze Growth?

  • Deploy Capital: Fund scale-up of bio-based vanillin plants and hybrid facilities capable of both synthetic and natural production.
  • Support Branding: Invest in flavor and ingredient companies that market vanillin as premium, sustainable, and traceable.
  • De-Risk Supply Chains: Finance raw material diversification across petrochemical, lignin, and microbial sources to mitigate supply volatility.

Key Players in the Vanillin Market

  • Solvay SA
  • Advanced Biotech
  • Prinova Group LLC
  • Lesaffre
  • Aurochemicals
  • Camlin Fine Sciences Ltd
  • Merck Group
  • Evolva
  • Borregaard
  • Tanobio

Scope of the Report

Items Values
Quantitative Units (2025) USD 850.3 Million
Application Food, Beverage, Pharmaceuticals, Other Applications
Source Natural Vanillin, Synthetic Vanillin
Form Powder, Liquid
Regions Covered North America, Latin America, Europe, East Asia, South Asia & Pacific, Middle East & Africa
Countries Covered United States, Canada, United Kingdom, Germany, France, China, Japan, South Korea, India, Brazil, Australia and 40+ countries
Key Companies Profiled Solvay SA, Advanced Biotech, Prinova Group LLC, Lesaffre, Aurochemicals, Camlin Fine Sciences Ltd, Merck Group, Evolva, Borregaard, and Tanobio
Additional Attributes Dollar sales by vanillin type and concentration level, regional demand trends, competitive landscape, buyer preferences for natural versus synthetic sources, integration with clean-label positioning, innovations in production technologies, enzymatic synthesis, and sustainable sourcing practices

Vanillin Market by Segments

Application:

  • Food
  • Beverage
  • Pharmaceuticals
  • Other Applications

Source:

  • Natural Vanillin
  • Synthetic Vanillin

Form:

  • Powder
  • Liquid

Region:

  • North America
    • United States
    • Canada
    • Mexico
  • Latin America
    • Brazil
    • Chile
    • Rest of Latin America
  • Europe
    • Germany
    • United Kingdom
    • France
    • Italy
    • Spain
    • Nordic
    • BENELUX
    • Rest of Europe
  • East Asia
    • China
    • Japan
    • South Korea
  • South Asia & Pacific
    • India
    • ASEAN
    • Australia & New Zealand
    • Rest of South Asia & Pacific
  • Middle East & Africa
    • Kingdom of Saudi Arabia
    • Other GCC Countries
    • Turkey
    • South Africa
    • Other African Union
    • Rest of Middle East & Africa

Frequently Asked Questions

What is the projected value of the global vanillin market by 2035?

The market is projected to reach USD 1,434.2 million by 2035.

What is the expected CAGR for the vanillin market from 2025 to 2035?

The market is expected to grow at a CAGR of 6.9% from 2025 to 2035.

Which country is expected to lead the vanillin market in terms of growth?

India is expected to register the fastest growth in the market, with a projected CAGR of 9.3%.

Which are the leading players in the vanillin market?

Key companies include Solvay SA, Merck Group, Camlin Fine Sciences Ltd., Borregaard, Evolva, Prinova Group LLC, Advanced Biotech, Lesaffre, Aurochemicals, and Tanobio.

Table of Content

  1. Executive Summary
  2. Industry Introduction, Including Taxonomy and Market Definition
  3. Market Trends and Success Factors, Including Macro-economic Factors, Market Dynamics, and Recent Industry Developments
  4. Global Market Demand Analysis 2020 to 2024 and Forecast 2025 to 2035, including Historical Analysis and Future Projections
  5. Pricing Analysis
  6. Global Market Analysis 2020 to 2024 and Forecast 2025 to 2035
    • Application
    • Source
    • Form
    • Region
  7. Global Market Analysis 2020 to 2024 and Forecast 2025 to 2035, by Application
    • Food
    • Beverage
    • Pharmaceuticals
    • Other Applications
  8. Global Market Analysis 2020 to 2024 and Forecast 2025 to 2035, by Source
    • Natural Vanillin
    • Synthetic Vanillin
  9. Global Market Analysis 2020 to 2024 and Forecast 2025 to 2035, by Form
    • Powder
    • Liquid
  10. Global Market Analysis 2020 to 2024 and Forecast 2025 to 2035, by Region
    • North America
    • Latin America
    • Western Europe
    • Eastern Europe
    • East Asia
    • South Asia and Pacific
    • Middle East and Africa
  11. North America Sales Analysis 2020 to 2024 and Forecast 2025 to 2035, by Key Segments and Countries
  12. Latin America Sales Analysis 2020 to 2024 and Forecast 2025 to 2035, by Key Segments and Countries
  13. Western Europe Sales Analysis 2020 to 2024 and Forecast 2025 to 2035, by Key Segments and Countries
  14. Eastern Europe Sales Analysis 2020 to 2024 and Forecast 2025 to 2035, by Key Segments and Countries
  15. East Asia Sales Analysis 2020 to 2024 and Forecast 2025 to 2035, by Key Segments and Countries
  16. South Asia & Pacific Sales Analysis 2020 to 2024 and Forecast 2025 to 2035, by Key Segments and Countries
  17. Middle East and Africa Sales Analysis 2020 to 2024 and Forecast 2025 to 2035, by Key Segments and Countries
  18. Sales Forecast 2025 to 2035 by Application, Source, and Form for 30 Countries
  19. Competition Outlook, including Market Structure Analysis, Company Share Analysis by Key Players, and Competition Dashboard
  20. Company Profile
    • Solvay SA
    • Advanced Biotech
    • Prinova Group LLC
    • Lesaffre
    • Aurochemicals
    • Camlin Fine Sciences Ltd
    • Merck Group
    • Evolva
    • Borregaard
    • Tanobio

List of Tables

  • Table 1: Global Market Value (USD Billion) Forecast by Region, 2020-2035
  • Table 2: Global Market Volume (Tons) Forecast by Region, 2020-2035
  • Table 3: Global Market Value (USD Billion) Forecast by Source, 2020-2035
  • Table 4: Global Market Volume (Tons) Forecast by Source, 2020-2035
  • Table 5: Global Market Value (USD Billion) Forecast by Form, 2020-2035
  • Table 6: Global Market Volume (Tons) Forecast by Form, 2020-2035
  • Table 7: Global Market Value (USD Billion) Forecast by Application, 2020-2035
  • Table 8: Global Market Volume (Tons) Forecast by Application, 2020-2035
  • Table 9: North America Market Value (USD Billion) Forecast by Country, 2020-2035
  • Table 10: North America Market Volume (Tons) Forecast by Country, 2020-2035
  • Table 11: North America Market Value (USD Billion) Forecast by Source, 2020-2035
  • Table 12: North America Market Volume (Tons) Forecast by Source, 2020-2035
  • Table 13: North America Market Value (USD Billion) Forecast by Form, 2020-2035
  • Table 14: North America Market Volume (Tons) Forecast by Form, 2020-2035
  • Table 15: North America Market Value (USD Billion) Forecast by Application, 2020-2035
  • Table 16: North America Market Volume (Tons) Forecast by Application, 2020-2035
  • Table 17: Latin America Market Value (USD Billion) Forecast by Country, 2020-2035
  • Table 18: Latin America Market Volume (Tons) Forecast by Country, 2020-2035
  • Table 19: Latin America Market Value (USD Billion) Forecast by Source, 2020-2035
  • Table 20: Latin America Market Volume (Tons) Forecast by Source, 2020-2035
  • Table 21: Latin America Market Value (USD Billion) Forecast by Form, 2020-2035
  • Table 22: Latin America Market Volume (Tons) Forecast by Form, 2020-2035
  • Table 23: Latin America Market Value (USD Billion) Forecast by Application, 2020-2035
  • Table 24: Latin America Market Volume (Tons) Forecast by Application, 2020-2035
  • Table 25: East Asia Market Value (USD Billion) Forecast by Country, 2020-2035
  • Table 26: East Asia Market Volume (Tons) Forecast by Country, 2020-2035
  • Table 27: East Asia Market Value (USD Billion) Forecast by Source, 2020-2035
  • Table 28: East Asia Market Volume (Tons) Forecast by Source, 2020-2035
  • Table 29: East Asia Market Value (USD Billion) Forecast by Form, 2020-2035
  • Table 30: East Asia Market Volume (Tons) Forecast by Form, 2020-2035
  • Table 31: East Asia Market Value (USD Billion) Forecast by Application, 2020-2035
  • Table 32: East Asia Market Volume (Tons) Forecast by Application, 2020-2035
  • Table 33: South Asia & Pacific Market Value (USD Billion) Forecast by Country, 2020-2035
  • Table 34: South Asia & Pacific Market Volume (Tons) Forecast by Country, 2020-2035
  • Table 35: South Asia & Pacific Market Value (USD Billion) Forecast by Source, 2020-2035
  • Table 36: South Asia & Pacific Market Volume (Tons) Forecast by Source, 2020-2035
  • Table 37: South Asia & Pacific Market Value (USD Billion) Forecast by Form, 2020-2035
  • Table 38: South Asia & Pacific Market Volume (Tons) Forecast by Form, 2020-2035
  • Table 39: South Asia & Pacific Market Value (USD Billion) Forecast by Application, 2020-2035
  • Table 40: South Asia & Pacific Market Volume (Tons) Forecast by Application, 2020-2035
  • Table 41: Western Europe Market Value (USD Billion) Forecast by Country, 2020-2035
  • Table 42: Western Europe Market Volume (Tons) Forecast by Country, 2020-2035
  • Table 43: Western Europe Market Value (USD Billion) Forecast by Source, 2020-2035
  • Table 44: Western Europe Market Volume (Tons) Forecast by Source, 2020-2035
  • Table 45: Western Europe Market Value (USD Billion) Forecast by Form, 2020-2035
  • Table 46: Western Europe Market Volume (Tons) Forecast by Form, 2020-2035
  • Table 47: Western Europe Market Value (USD Billion) Forecast by Application, 2020-2035
  • Table 48: Western Europe Market Volume (Tons) Forecast by Application, 2020-2035
  • Table 49: Eastern Europe Market Value (USD Billion) Forecast by Country, 2020-2035
  • Table 50: Eastern Europe Market Volume (Tons) Forecast by Country, 2020-2035
  • Table 51: Eastern Europe Market Value (USD Billion) Forecast by Source, 2020-2035
  • Table 52: Eastern Europe Market Volume (Tons) Forecast by Source, 2020-2035
  • Table 53: Eastern Europe Market Value (USD Billion) Forecast by Form, 2020-2035
  • Table 54: Eastern Europe Market Volume (Tons) Forecast by Form, 2020-2035
  • Table 55: Eastern Europe Market Value (USD Billion) Forecast by Application, 2020-2035
  • Table 56: Eastern Europe Market Volume (Tons) Forecast by Application, 2020-2035
  • Table 57: Middle East & Africa Market Value (USD Billion) Forecast by Country, 2020-2035
  • Table 58: Middle East & Africa Market Volume (Tons) Forecast by Country, 2020-2035
  • Table 59: Middle East & Africa Market Value (USD Billion) Forecast by Source, 2020-2035
  • Table 60: Middle East & Africa Market Volume (Tons) Forecast by Source, 2020-2035
  • Table 61: Middle East & Africa Market Value (USD Billion) Forecast by Form, 2020-2035
  • Table 62: Middle East & Africa Market Volume (Tons) Forecast by Form, 2020-2035
  • Table 63: Middle East & Africa Market Value (USD Billion) Forecast by Application, 2020-2035
  • Table 64: Middle East & Africa Market Volume (Tons) Forecast by Application, 2020-2035
  • Table 65: USA Market Value (USD Billion) by Source, 2020-2035
  • Table 66: USA Market Value (USD Billion) by Form, 2020-2035
  • Table 67: USA Market Value (USD Billion) by Application, 2020-2035
  • Table 68: Canada Market Value (USD Billion) by Source, 2020-2035
  • Table 69: Canada Market Value (USD Billion) by Form, 2020-2035
  • Table 70: Canada Market Value (USD Billion) by Application, 2020-2035
  • Table 71: Mexico Market Value (USD Billion) by Source, 2020-2035
  • Table 72: Mexico Market Value (USD Billion) by Form, 2020-2035
  • Table 73: Mexico Market Value (USD Billion) by Application, 2020-2035
  • Table 74: Brazil Market Value (USD Billion) by Source, 2020-2035
  • Table 75: Brazil Market Value (USD Billion) by Form, 2020-2035
  • Table 76: Brazil Market Value (USD Billion) by Application, 2020-2035
  • Table 77: Argentina Market Value (USD Billion) by Source, 2020-2035
  • Table 78: Argentina Market Value (USD Billion) by Form, 2020-2035
  • Table 79: Argentina Market Value (USD Billion) by Application, 2020-2035
  • Table 80: Rest of Latin America Market Value (USD Billion) by Source, 2020-2035
  • Table 81: Rest of Latin America Market Value (USD Billion) by Form, 2020-2035
  • Table 82: Rest of Latin America Market Value (USD Billion) by Application, 2020-2035
  • Table 83: China Market Value (USD Billion) by Source, 2020-2035
  • Table 84: China Market Value (USD Billion) by Form, 2020-2035
  • Table 85: China Market Value (USD Billion) by Application, 2020-2035
  • Table 86: Japan Market Value (USD Billion) by Source, 2020-2035
  • Table 87: Japan Market Value (USD Billion) by Form, 2020-2035
  • Table 88: Japan Market Value (USD Billion) by Application, 2020-2035
  • Table 89: South Korea Market Value (USD Billion) by Source, 2020-2035
  • Table 90: South Korea Market Value (USD Billion) by Form, 2020-2035
  • Table 91: South Korea Market Value (USD Billion) by Application, 2020-2035
  • Table 92: India Market Value (USD Billion) by Source, 2020-2035
  • Table 93: India Market Value (USD Billion) by Form, 2020-2035
  • Table 94: India Market Value (USD Billion) by Application, 2020-2035
  • Table 95: ASEAN Countries Market Value (USD Billion) by Source, 2020-2035
  • Table 96: ASEAN Countries Market Value (USD Billion) by Form, 2020-2035
  • Table 97: ASEAN Countries Market Value (USD Billion) by Application, 2020-2035
  • Table 98: Australia & New Zealand Market Value (USD Billion) by Source, 2020-2035
  • Table 99: Australia & New Zealand Market Value (USD Billion) by Form, 2020-2035
  • Table 100: Australia & New Zealand Market Value (USD Billion) by Application, 2020-2035
  • Table 101: Rest of South Asia Market Value (USD Billion) by Source, 2020-2035
  • Table 102: Rest of South Asia Market Value (USD Billion) by Form, 2020-2035
  • Table 103: Rest of South Asia Market Value (USD Billion) by Application, 2020-2035
  • Table 104: Germany Market Value (USD Billion) by Source, 2020-2035
  • Table 105: Germany Market Value (USD Billion) by Form, 2020-2035
  • Table 106: Germany Market Value (USD Billion) by Application, 2020-2035
  • Table 107: UK Market Value (USD Billion) by Source, 2020-2035
  • Table 108: UK Market Value (USD Billion) by Form, 2020-2035
  • Table 109: UK Market Value (USD Billion) by Application, 2020-2035
  • Table 110: France Market Value (USD Billion) by Source, 2020-2035
  • Table 111: France Market Value (USD Billion) by Form, 2020-2035
  • Table 112: France Market Value (USD Billion) by Application, 2020-2035
  • Table 113: Italy Market Value (USD Billion) by Source, 2020-2035
  • Table 114: Italy Market Value (USD Billion) by Form, 2020-2035
  • Table 115: Italy Market Value (USD Billion) by Application, 2020-2035
  • Table 116: Spain Market Value (USD Billion) by Source, 2020-2035
  • Table 117: Spain Market Value (USD Billion) by Form, 2020-2035
  • Table 118: Spain Market Value (USD Billion) by Application, 2020-2035
  • Table 119: BENELUX Market Value (USD Billion) by Source, 2020-2035
  • Table 120: BENELUX Market Value (USD Billion) by Form, 2020-2035
  • Table 121: BENELUX Market Value (USD Billion) by Application, 2020-2035
  • Table 122: Nordic Countries Market Value (USD Billion) by Source, 2020-2035
  • Table 123: Nordic Countries Market Value (USD Billion) by Form, 2020-2035
  • Table 124: Nordic Countries Market Value (USD Billion) by Application, 2020-2035
  • Table 125: Rest of Western Europe Market Value (USD Billion) by Source, 2020-2035
  • Table 126: Rest of Western Europe Market Value (USD Billion) by Form, 2020-2035
  • Table 127: Rest of Western Europe Market Value (USD Billion) by Application, 2020-2035
  • Table 128: Russia Market Value (USD Billion) by Source, 2020-2035
  • Table 129: Russia Market Value (USD Billion) by Form, 2020-2035
  • Table 130: Russia Market Value (USD Billion) by Application, 2020-2035
  • Table 131: Hungary Market Value (USD Billion) by Source, 2020-2035
  • Table 132: Hungary Market Value (USD Billion) by Form, 2020-2035
  • Table 133: Hungary Market Value (USD Billion) by Application, 2020-2035
  • Table 134: Poland Market Value (USD Billion) by Source, 2020-2035
  • Table 135: Poland Market Value (USD Billion) by Form, 2020-2035
  • Table 136: Poland Market Value (USD Billion) by Application, 2020-2035
  • Table 137: Rest of Eastern Europe Market Value (USD Billion) by Source, 2020-2035
  • Table 138: Rest of Eastern Europe Market Value (USD Billion) by Form, 2020-2035
  • Table 139: Rest of Eastern Europe Market Value (USD Billion) by Application, 2020-2035
  • Table 140: Saudi Arabia Market Value (USD Billion) by Source, 2020-2035
  • Table 141: Saudi Arabia Market Value (USD Billion) by Form, 2020-2035
  • Table 142: Saudi Arabia Market Value (USD Billion) by Application, 2020-2035
  • Table 143: Türkiye Market Value (USD Billion) by Source, 2020-2035
  • Table 144: Türkiye Market Value (USD Billion) by Form, 2020-2035
  • Table 145: Türkiye Market Value (USD Billion) by Application, 2020-2035
  • Table 146: South Africa Market Value (USD Billion) by Source, 2020-2035
  • Table 147: South Africa Market Value (USD Billion) by Form, 2020-2035
  • Table 148: South Africa Market Value (USD Billion) by Application, 2020-2035
  • Table 149: Other African Union Market Value (USD Billion) by Source, 2020-2035
  • Table 150: Other African Union Market Value (USD Billion) by Form, 2020-2035
  • Table 151: Other African Union Market Value (USD Billion) by Application, 2020-2035
  • Table 152: Rest of Middle East & Africa Market Value (USD Billion) by Source, 2020-2035
  • Table 153: Rest of Middle East & Africa Market Value (USD Billion) by Form, 2020-2035
  • Table 154: Rest of Middle East & Africa Market Value (USD Billion) by Application, 2020-2035

List of Figures

  • Figure 1: Global Market Value (USD Billion) by Source, 2025-2035
  • Figure 2: Global Market Value (USD Billion) by Form, 2025-2035
  • Figure 3: Global Market Value (USD Billion) by Application, 2025-2035
  • Figure 4: Global Market Value (USD Billion) by Region, 2025-2035
  • Figure 5: Global Market Value (USD Billion) Analysis by Region, 2020-2035
  • Figure 6: Global Market Volume (Tons) Analysis by Region, 2020-2035
  • Figure 7: Global Market Value Share (%) and BPS Analysis by Region, 2025-2035
  • Figure 8: Global Market Y-o-Y Growth (%) Projections by Region, 2025-2035
  • Figure 9: Global Market Value (USD Billion) Analysis by Source, 2020-2035
  • Figure 10: Global Market Volume (Tons) Analysis by Source, 2020-2035
  • Figure 11: Global Market Value Share (%) and BPS Analysis by Source, 2025-2035
  • Figure 12: Global Market Y-o-Y Growth (%) Projections by Source, 2025-2035
  • Figure 13: Global Market Value (USD Billion) Analysis by Form, 2020-2035
  • Figure 14: Global Market Volume (Tons) Analysis by Form, 2020-2035
  • Figure 15: Global Market Value Share (%) and BPS Analysis by Form, 2025-2035
  • Figure 16: Global Market Y-o-Y Growth (%) Projections by Form, 2025-2035
  • Figure 17: Global Market Value (USD Billion) Analysis by Application, 2020-2035
  • Figure 18: Global Market Volume (Tons) Analysis by Application, 2020-2035
  • Figure 19: Global Market Value Share (%) and BPS Analysis by Application, 2025-2035
  • Figure 20: Global Market Y-o-Y Growth (%) Projections by Application, 2025-2035
  • Figure 21: Global Market Attractiveness by Source, 2025-2035
  • Figure 22: Global Market Attractiveness by Form, 2025-2035
  • Figure 23: Global Market Attractiveness by Application, 2025-2035
  • Figure 24: Global Market Attractiveness by Region, 2025-2035
  • Figure 25: North America Market Value (USD Billion) by Source, 2025-2035
  • Figure 26: North America Market Value (USD Billion) by Form, 2025-2035
  • Figure 27: North America Market Value (USD Billion) by Application, 2025-2035
  • Figure 28: North America Market Value (USD Billion) by Country, 2025-2035
  • Figure 29: North America Market Value (USD Billion) Analysis by Country, 2020-2035
  • Figure 30: North America Market Volume (Tons) Analysis by Country, 2020-2035
  • Figure 31: North America Market Value Share (%) and BPS Analysis by Country, 2025-2035
  • Figure 32: North America Market Y-o-Y Growth (%) Projections by Country, 2025-2035
  • Figure 33: North America Market Value (USD Billion) Analysis by Source, 2020-2035
  • Figure 34: North America Market Volume (Tons) Analysis by Source, 2020-2035
  • Figure 35: North America Market Value Share (%) and BPS Analysis by Source, 2025-2035
  • Figure 36: North America Market Y-o-Y Growth (%) Projections by Source, 2025-2035
  • Figure 37: North America Market Value (USD Billion) Analysis by Form, 2020-2035
  • Figure 38: North America Market Volume (Tons) Analysis by Form, 2020-2035
  • Figure 39: North America Market Value Share (%) and BPS Analysis by Form, 2025-2035
  • Figure 40: North America Market Y-o-Y Growth (%) Projections by Form, 2025-2035
  • Figure 41: North America Market Value (USD Billion) Analysis by Application, 2020-2035
  • Figure 42: North America Market Volume (Tons) Analysis by Application, 2020-2035
  • Figure 43: North America Market Value Share (%) and BPS Analysis by Application, 2025-2035
  • Figure 44: North America Market Y-o-Y Growth (%) Projections by Application, 2025-2035
  • Figure 45: North America Market Attractiveness by Source, 2025-2035
  • Figure 46: North America Market Attractiveness by Form, 2025-2035
  • Figure 47: North America Market Attractiveness by Application, 2025-2035
  • Figure 48: North America Market Attractiveness by Country, 2025-2035
  • Figure 49: Latin America Market Value (USD Billion) by Source, 2025-2035
  • Figure 50: Latin America Market Value (USD Billion) by Form, 2025-2035
  • Figure 51: Latin America Market Value (USD Billion) by Application, 2025-2035
  • Figure 52: Latin America Market Value (USD Billion) by Country, 2025-2035
  • Figure 53: Latin America Market Value (USD Billion) Analysis by Country, 2020-2035
  • Figure 54: Latin America Market Volume (Tons) Analysis by Country, 2020-2035
  • Figure 55: Latin America Market Value Share (%) and BPS Analysis by Country, 2025-2035
  • Figure 56: Latin America Market Y-o-Y Growth (%) Projections by Country, 2025-2035
  • Figure 57: Latin America Market Value (USD Billion) Analysis by Source, 2020-2035
  • Figure 58: Latin America Market Volume (Tons) Analysis by Source, 2020-2035
  • Figure 59: Latin America Market Value Share (%) and BPS Analysis by Source, 2025-2035
  • Figure 60: Latin America Market Y-o-Y Growth (%) Projections by Source, 2025-2035
  • Figure 61: Latin America Market Value (USD Billion) Analysis by Form, 2020-2035
  • Figure 62: Latin America Market Volume (Tons) Analysis by Form, 2020-2035
  • Figure 63: Latin America Market Value Share (%) and BPS Analysis by Form, 2025-2035
  • Figure 64: Latin America Market Y-o-Y Growth (%) Projections by Form, 2025-2035
  • Figure 65: Latin America Market Value (USD Billion) Analysis by Application, 2020-2035
  • Figure 66: Latin America Market Volume (Tons) Analysis by Application, 2020-2035
  • Figure 67: Latin America Market Value Share (%) and BPS Analysis by Application, 2025-2035
  • Figure 68: Latin America Market Y-o-Y Growth (%) Projections by Application, 2025-2035
  • Figure 69: Latin America Market Attractiveness by Source, 2025-2035
  • Figure 70: Latin America Market Attractiveness by Form, 2025-2035
  • Figure 71: Latin America Market Attractiveness by Application, 2025-2035
  • Figure 72: Latin America Market Attractiveness by Country, 2025-2035
  • Figure 73: East Asia Market Value (USD Billion) by Source, 2025-2035
  • Figure 74: East Asia Market Value (USD Billion) by Form, 2025-2035
  • Figure 75: East Asia Market Value (USD Billion) by Application, 2025-2035
  • Figure 76: East Asia Market Value (USD Billion) by Country, 2025-2035
  • Figure 77: East Asia Market Value (USD Billion) Analysis by Country, 2020-2035
  • Figure 78: East Asia Market Volume (Tons) Analysis by Country, 2020-2035
  • Figure 79: East Asia Market Value Share (%) and BPS Analysis by Country, 2025-2035
  • Figure 80: East Asia Market Y-o-Y Growth (%) Projections by Country, 2025-2035
  • Figure 81: East Asia Market Value (USD Billion) Analysis by Source, 2020-2035
  • Figure 82: East Asia Market Volume (Tons) Analysis by Source, 2020-2035
  • Figure 83: East Asia Market Value Share (%) and BPS Analysis by Source, 2025-2035
  • Figure 84: East Asia Market Y-o-Y Growth (%) Projections by Source, 2025-2035
  • Figure 85: East Asia Market Value (USD Billion) Analysis by Form, 2020-2035
  • Figure 86: East Asia Market Volume (Tons) Analysis by Form, 2020-2035
  • Figure 87: East Asia Market Value Share (%) and BPS Analysis by Form, 2025-2035
  • Figure 88: East Asia Market Y-o-Y Growth (%) Projections by Form, 2025-2035
  • Figure 89: East Asia Market Value (USD Billion) Analysis by Application, 2020-2035
  • Figure 90: East Asia Market Volume (Tons) Analysis by Application, 2020-2035
  • Figure 91: East Asia Market Value Share (%) and BPS Analysis by Application, 2025-2035
  • Figure 92: East Asia Market Y-o-Y Growth (%) Projections by Application, 2025-2035
  • Figure 93: East Asia Market Attractiveness by Source, 2025-2035
  • Figure 94: East Asia Market Attractiveness by Form, 2025-2035
  • Figure 95: East Asia Market Attractiveness by Application, 2025-2035
  • Figure 96: East Asia Market Attractiveness by Country, 2025-2035
  • Figure 97: South Asia & Pacific Market Value (USD Billion) by Source, 2025-2035
  • Figure 98: South Asia & Pacific Market Value (USD Billion) by Form, 2025-2035
  • Figure 99: South Asia & Pacific Market Value (USD Billion) by Application, 2025-2035
  • Figure 100: South Asia & Pacific Market Value (USD Billion) by Country, 2025-2035
  • Figure 101: South Asia & Pacific Market Value (USD Billion) Analysis by Country, 2020-2035
  • Figure 102: South Asia & Pacific Market Volume (Tons) Analysis by Country, 2020-2035
  • Figure 103: South Asia & Pacific Market Value Share (%) and BPS Analysis by Country, 2025-2035
  • Figure 104: South Asia & Pacific Market Y-o-Y Growth (%) Projections by Country, 2025-2035
  • Figure 105: South Asia & Pacific Market Value (USD Billion) Analysis by Source, 2020-2035
  • Figure 106: South Asia & Pacific Market Volume (Tons) Analysis by Source, 2020-2035
  • Figure 107: South Asia & Pacific Market Value Share (%) and BPS Analysis by Source, 2025-2035
  • Figure 108: South Asia & Pacific Market Y-o-Y Growth (%) Projections by Source, 2025-2035
  • Figure 109: South Asia & Pacific Market Value (USD Billion) Analysis by Form, 2020-2035
  • Figure 110: South Asia & Pacific Market Volume (Tons) Analysis by Form, 2020-2035
  • Figure 111: South Asia & Pacific Market Value Share (%) and BPS Analysis by Form, 2025-2035
  • Figure 112: South Asia & Pacific Market Y-o-Y Growth (%) Projections by Form, 2025-2035
  • Figure 113: South Asia & Pacific Market Value (USD Billion) Analysis by Application, 2020-2035
  • Figure 114: South Asia & Pacific Market Volume (Tons) Analysis by Application, 2020-2035
  • Figure 115: South Asia & Pacific Market Value Share (%) and BPS Analysis by Application, 2025-2035
  • Figure 116: South Asia & Pacific Market Y-o-Y Growth (%) Projections by Application, 2025-2035
  • Figure 117: South Asia & Pacific Market Attractiveness by Source, 2025-2035
  • Figure 118: South Asia & Pacific Market Attractiveness by Form, 2025-2035
  • Figure 119: South Asia & Pacific Market Attractiveness by Application, 2025-2035
  • Figure 120: South Asia & Pacific Market Attractiveness by Country, 2025-2035
  • Figure 121: Western Europe Market Value (USD Billion) by Source, 2025-2035
  • Figure 122: Western Europe Market Value (USD Billion) by Form, 2025-2035
  • Figure 123: Western Europe Market Value (USD Billion) by Application, 2025-2035
  • Figure 124: Western Europe Market Value (USD Billion) by Country, 2025-2035
  • Figure 125: Western Europe Market Value (USD Billion) Analysis by Country, 2020-2035
  • Figure 126: Western Europe Market Volume (Tons) Analysis by Country, 2020-2035
  • Figure 127: Western Europe Market Value Share (%) and BPS Analysis by Country, 2025-2035
  • Figure 128: Western Europe Market Y-o-Y Growth (%) Projections by Country, 2025-2035
  • Figure 129: Western Europe Market Value (USD Billion) Analysis by Source, 2020-2035
  • Figure 130: Western Europe Market Volume (Tons) Analysis by Source, 2020-2035
  • Figure 131: Western Europe Market Value Share (%) and BPS Analysis by Source, 2025-2035
  • Figure 132: Western Europe Market Y-o-Y Growth (%) Projections by Source, 2025-2035
  • Figure 133: Western Europe Market Value (USD Billion) Analysis by Form, 2020-2035
  • Figure 134: Western Europe Market Volume (Tons) Analysis by Form, 2020-2035
  • Figure 135: Western Europe Market Value Share (%) and BPS Analysis by Form, 2025-2035
  • Figure 136: Western Europe Market Y-o-Y Growth (%) Projections by Form, 2025-2035
  • Figure 137: Western Europe Market Value (USD Billion) Analysis by Application, 2020-2035
  • Figure 138: Western Europe Market Volume (Tons) Analysis by Application, 2020-2035
  • Figure 139: Western Europe Market Value Share (%) and BPS Analysis by Application, 2025-2035
  • Figure 140: Western Europe Market Y-o-Y Growth (%) Projections by Application, 2025-2035
  • Figure 141: Western Europe Market Attractiveness by Source, 2025-2035
  • Figure 142: Western Europe Market Attractiveness by Form, 2025-2035
  • Figure 143: Western Europe Market Attractiveness by Application, 2025-2035
  • Figure 144: Western Europe Market Attractiveness by Country, 2025-2035
  • Figure 145: Eastern Europe Market Value (USD Billion) by Source, 2025-2035
  • Figure 146: Eastern Europe Market Value (USD Billion) by Form, 2025-2035
  • Figure 147: Eastern Europe Market Value (USD Billion) by Application, 2025-2035
  • Figure 148: Eastern Europe Market Value (USD Billion) by Country, 2025-2035
  • Figure 149: Eastern Europe Market Value (USD Billion) Analysis by Country, 2020-2035
  • Figure 150: Eastern Europe Market Volume (Tons) Analysis by Country, 2020-2035
  • Figure 151: Eastern Europe Market Value Share (%) and BPS Analysis by Country, 2025-2035
  • Figure 152: Eastern Europe Market Y-o-Y Growth (%) Projections by Country, 2025-2035
  • Figure 153: Eastern Europe Market Value (USD Billion) Analysis by Source, 2020-2035
  • Figure 154: Eastern Europe Market Volume (Tons) Analysis by Source, 2020-2035
  • Figure 155: Eastern Europe Market Value Share (%) and BPS Analysis by Source, 2025-2035
  • Figure 156: Eastern Europe Market Y-o-Y Growth (%) Projections by Source, 2025-2035
  • Figure 157: Eastern Europe Market Value (USD Billion) Analysis by Form, 2020-2035
  • Figure 158: Eastern Europe Market Volume (Tons) Analysis by Form, 2020-2035
  • Figure 159: Eastern Europe Market Value Share (%) and BPS Analysis by Form, 2025-2035
  • Figure 160: Eastern Europe Market Y-o-Y Growth (%) Projections by Form, 2025-2035
  • Figure 161: Eastern Europe Market Value (USD Billion) Analysis by Application, 2020-2035
  • Figure 162: Eastern Europe Market Volume (Tons) Analysis by Application, 2020-2035
  • Figure 163: Eastern Europe Market Value Share (%) and BPS Analysis by Application, 2025-2035
  • Figure 164: Eastern Europe Market Y-o-Y Growth (%) Projections by Application, 2025-2035
  • Figure 165: Eastern Europe Market Attractiveness by Source, 2025-2035
  • Figure 166: Eastern Europe Market Attractiveness by Form, 2025-2035
  • Figure 167: Eastern Europe Market Attractiveness by Application, 2025-2035
  • Figure 168: Eastern Europe Market Attractiveness by Country, 2025-2035
  • Figure 169: Middle East & Africa Market Value (USD Billion) by Source, 2025-2035
  • Figure 170: Middle East & Africa Market Value (USD Billion) by Form, 2025-2035
  • Figure 171: Middle East & Africa Market Value (USD Billion) by Application, 2025-2035
  • Figure 172: Middle East & Africa Market Value (USD Billion) by Country, 2025-2035
  • Figure 173: Middle East & Africa Market Value (USD Billion) Analysis by Country, 2020-2035
  • Figure 174: Middle East & Africa Market Volume (Tons) Analysis by Country, 2020-2035
  • Figure 175: Middle East & Africa Market Value Share (%) and BPS Analysis by Country, 2025-2035
  • Figure 176: Middle East & Africa Market Y-o-Y Growth (%) Projections by Country, 2025-2035
  • Figure 177: Middle East & Africa Market Value (USD Billion) Analysis by Source, 2020-2035
  • Figure 178: Middle East & Africa Market Volume (Tons) Analysis by Source, 2020-2035
  • Figure 179: Middle East & Africa Market Value Share (%) and BPS Analysis by Source, 2025-2035
  • Figure 180: Middle East & Africa Market Y-o-Y Growth (%) Projections by Source, 2025-2035
  • Figure 181: Middle East & Africa Market Value (USD Billion) Analysis by Form, 2020-2035
  • Figure 182: Middle East & Africa Market Volume (Tons) Analysis by Form, 2020-2035
  • Figure 183: Middle East & Africa Market Value Share (%) and BPS Analysis by Form, 2025-2035
  • Figure 184: Middle East & Africa Market Y-o-Y Growth (%) Projections by Form, 2025-2035
  • Figure 185: Middle East & Africa Market Value (USD Billion) Analysis by Application, 2020-2035
  • Figure 186: Middle East & Africa Market Volume (Tons) Analysis by Application, 2020-2035
  • Figure 187: Middle East & Africa Market Value Share (%) and BPS Analysis by Application, 2025-2035
  • Figure 188: Middle East & Africa Market Y-o-Y Growth (%) Projections by Application, 2025-2035
  • Figure 189: Middle East & Africa Market Attractiveness by Source, 2025-2035
  • Figure 190: Middle East & Africa Market Attractiveness by Form, 2025-2035
  • Figure 191: Middle East & Africa Market Attractiveness by Application, 2025-2035
  • Figure 192: Middle East & Africa Market Attractiveness by Country, 2025-2035
Dashboard
Dashboard
Dashboard
Dashboard
Dashboard
Dashboard

Full Research Suite comprises of:

Market outlook & trends analysis

Market outlook & trends analysis

Interviews & case studies

Interviews & case studies

Strategic recommendations

Strategic recommendations

Vendor profiles & capabilities analysis

Vendor profiles & capabilities analysis

5-year forecasts

5-year forecasts

8 regions and 60+ country-level data splits

8 regions and 60+ country-level data splits

Market segment data splits

Market segment data splits

12 months of continuous data updates

12 months of continuous data updates

DELIVERED AS:

PDF EXCEL ONLINE

Full Research Suite


$3500

$5000

$6500

Buy Report Now
Similar Industry Reports

Similar Industry Reports

Bio Vanillin Market
Bio Vanillin Market

Bio Vanillin Market Analysis - Size, Share, and Forecast Outlook 2025 to 2035

Ethyl Vanillin Market

Ethyl Vanillin Market Analysis by Product Type, Form, Application and Region from 2025 to 2035

Demand for Vanillin in EU

Demand for Vanillin in EU Size and Share Forecast Outlook 2025 to 2035

Future Market Insights

Vanillin Market

Chat With MaRIA

Chat With

MaRIA

Hi There, I am MaRIA, Your Market Research Intelligence Assistant. How may I help you?