The coated fabrics market is projected to grow from USD 50 billion in 2025 to USD 79.9 billion in 2035, reflecting a CAGR of 4.8%. Saturation point analysis examines the stage at which the market may approach maturity, where growth slows due to widespread adoption and limited incremental demand. In the early phase from 2025 to 2030, the market is likely to experience steady expansion driven by applications in automotive, construction, protective apparel, and industrial sectors. Rising demand for waterproof, durable, and lightweight fabrics will continue to support incremental growth, indicating that saturation is still distant during this period.
As outlined in FMI’s verified materials science research, supporting innovation in industrial and consumer applications, between 2030 and 2035, the market may approach initial saturation levels in mature regions where coated fabrics are already widely adopted. Growth in these areas could slow, reflecting reduced room for further penetration and heightened competition among established manufacturers. Emerging markets and innovative product applications, such as smart textiles, eco-friendly coatings, and specialized industrial solutions, are expected to offset slowing demand in mature regions, thereby delaying full saturation. The coated fabrics market demonstrates a strong upward trajectory with gradual approaches toward saturation points, suggesting that while certain segments may mature, continued innovation and regional expansion will sustain market growth throughout the decade.
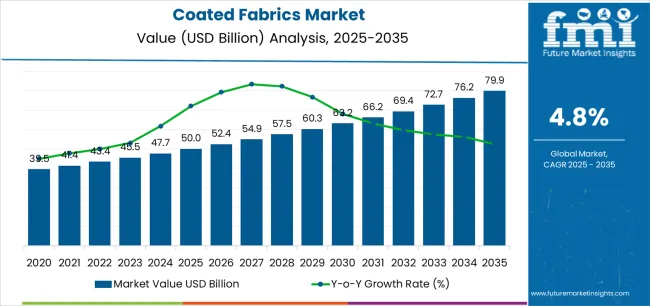
The global coated fabrics market is projected to reach approximately USD 50 billion in 2025, growing to around USD 79.9 billion by 2035, with a forecast CAGR of 4.8%. Automotive applications account for about 35% of total demand, driven by use in seat covers, upholstery, and roof linings. Construction and industrial uses contribute roughly 25%, while healthcare, sports, and protective gear make up the remaining 40%. Polyurethane and PVC coatings dominate the market, representing nearly 60% of all coated fabric production due to their durability and versatility.
Recent trends indicate increasing adoption of high-performance and environmentally friendly coated fabrics, including recycled and bio-based coatings, which now represent around 20% of new product developments. Advanced laminating and finishing techniques are being used to enhance water resistance, abrasion resistance, and fire retardancy. Regional demand is highest in Asia-Pacific, accounting for 40% of global consumption, followed by Europe and North America at around 35% collectively. Growing industrialization, urbanization, and automotive sector expansion continue to drive market growth worldwide.
| Metric | Value |
|---|---|
| Market Value (2025) | USD 50 billion |
| Market Forecast (2035) | USD 79.9 billion |
| Growth Rate | 4.8% CAGR |
| Leading Material | Polymer-coated fabrics |
| Primary Application | Transportation Segment |
The market demonstrates strong fundamentals with polymer-coated fabrics capturing a dominant share through versatile processing capabilities and comprehensive application coverage. Transportation applications drive primary demand, supported by increasing vehicle production and automotive interior sophistication. Geographic expansion remains concentrated in developed markets with established automotive and technical textile infrastructure, while emerging economies show accelerating adoption rates driven by vehicle localization and infrastructure construction.
Market expansion rests on three fundamental shifts driving adoption across the technical textiles and functional materials sectors. First, automotive interior sophistication creates compelling material demand through coated fabrics that enable design flexibility without sacrificing durability, supporting OEMs' differentiation missions while maintaining cost competitiveness and regulatory compliance for airbag, seating, and trim applications. Second, protective clothing requirements intensify as industrial safety standards worldwide mandate flame-retardant and chemical-resistant garments, enabling worker protection that aligns with occupational health regulations and corporate safety culture advancement.
Third, architectural membrane adoption drives demand from construction projects and temporary structures requiring lightweight, durable, and weather-resistant fabric solutions for tensile roofs, façades, and commercial tents during infrastructure development. The growth faces headwinds from raw material price volatility that varies across polyurethane and PVC resin markets, which may limit margin expansion in cost-sensitive applications. Technical performance trade-offs also persist regarding sustainability versus durability characteristics that may reduce service life in aggressive environmental exposures, affecting total cost of ownership calculations.
The coated fabrics market represents a specialized technical textiles opportunity driven by expanding automotive interior demand, protective clothing requirements, and the need for durable architectural membranes across construction and industrial applications. As automotive engineers worldwide seek to optimize interior aesthetics and functionality, safety managers require certified protective materials, and architects specify high-performance building envelopes, coated fabrics are evolving from commodity materials to engineered solutions ensuring performance, and regulatory compliance.
The convergence of vehicle electrification trends, industrial safety standardization, and sustainable construction practices creates sustained demand drivers across multiple application segments. The market's growth trajectory from USD 50 billion in 2025 to USD 79.9 A billion by 2035 at a 4.8% CAGR reflects fundamental shifts in material requirements, environmental compliance priorities, and the optimization of functional performance.
Geographic expansion opportunities are particularly pronounced in Asia-Pacific markets, where China (5.3% CAGR) and India (5.1% CAGR) lead through automotive production scaling and infrastructure investment acceleration. The dominance of polymer-coated fabrics (25.0% market share) and transportation applications (30.0% share) provides clear strategic focus areas, while emerging bio-attributed materials and PVC-free alternatives open new revenue streams.
Strengthening the dominant polymer-coated segment (25.0% market share) through enhanced polyurethane formulations (11.0% sub-segment), low-phthalate PVC alternatives (9.0%), and thermoplastic polyurethane systems (5.0%) for automotive, furniture, and protective applications. This pathway focuses on improving abrasion resistance, extending service life to 5-10 years, reducing VOC emissions, and developing solvent-free coating processes for environmental compliance. Market leadership consolidation through chemistry innovation and comprehensive OEM qualification enables premium positioning. Expected revenue pool: USD 6.0-9.5 billion
Expansion within transportation segment (30.0% market share) through automotive interior and trim materials (12.0% sub-segment), seating and headliner fabrics (7.0%), airbag substrates (5.0%), and marine/rail applications (6.0%) addressing lightweighting, design flexibility, and safety requirements. This pathway encompasses low-fogging formulations, soft-touch surfaces, and comprehensive durability testing for OEM specifications. Premium positioning reflects automotive qualification, supply chain integration, and technical support. Expected revenue pool: USD 9.0-14.5 billion
Strengthening polyester fabric substrate segment (46.0% market share) through woven PET optimization (28.0% sub-segment) and nonwoven/knit variants (18.0%) for diverse coating applications requiring dimensional stability, strength, and cost-effectiveness. This pathway addresses recycled-content PET integration, enhanced coating adhesion, and comprehensive performance validation for automotive and industrial uses. Technology differentiation through sustainable sourcing and consistent quality enables competitive advantages. Expected revenue pool: USD 11.0-17.5 billion
Strategic expansion within protective clothing segment (22.0% market share) requires flame-retardant coatings, chemical-resistant formulations, and comprehensive certification for industrial, defense, and emergency responder applications. This pathway addresses arc flash protection, high-visibility requirements, and ergonomic comfort optimization for demanding work environments. Premium pricing reflects safety certification, performance validation, and comprehensive technical documentation supporting occupational health compliance. Expected revenue pool: USD 6.5-10.5 billion
Rapid automotive and infrastructure growth across China (5.3% CAGR) and India (5.1% CAGR) creates opportunities through local coating capacity, automotive OEM partnerships, and comprehensive supply chain development. Growing EV production, commercial vehicle output, and infrastructure construction drive sustained demand for coated fabric solutions. Localization strategies reduce import costs, enable faster design iterations, and position companies advantageously for domestic content requirements. Expected revenue pool: USD 9.5-15.0 billion
Integration of bio-attributed polyurethane, recycled-content substrates, and PVC-free alternatives supporting environmental compliance, circular economy participation, and comprehensive sustainability credentials for automotive, furniture, and architectural applications. This pathway encompasses solvent-free processing, water-based coating technologies, and end-of-life recyclability optimization. Premium positioning through sustainability leadership, regulatory expertise, and comprehensive lifecycle documentation creates differentiation opportunities. Expected revenue pool: USD 4.5-7.5 billion
Development within commercial tent structures (15.0% share) and fluoropolymer-coated segment (14.0% share) addressing tensile architecture, façade systems, and permanent membrane structures requiring superior weatherability, translucency, and structural performance. This pathway encompasses PTFE/PVDF coatings, silicone-coated glass fabrics, and comprehensive engineering support for large-span structures. Technology differentiation through proven durability, architectural certification, and comprehensive project support enables premium positioning for landmark projects. Expected revenue pool: USD 4.0-6.5 billion
Primary Classification: The market segments by application into Transportation, Protective clothing, Industrial, Commercial tents & structures, Furniture & upholstery, and Other applications categories, representing the evolution from basic tarpaulins to specialized engineered textiles for comprehensive functional performance.
Secondary Classification: Material segmentation divides the market into Polymer-coated fabrics, Rubber-coated, Fabric-backed vinyl composites, Silicone-coated, and Fluoropolymer-coated sectors, reflecting distinct requirements for processing technology, performance characteristics, and application suitability.
Tertiary Classification: Fabric substrate segmentation encompasses Polyester (PET), Nylon (PA), Cotton & blends, Fiberglass, and Aramid & high-modulus fibers, representing base material requirements.
Regional Classification: Geographic distribution covers Asia Pacific, Europe, North America, Latin America, and Middle East & Africa, with established textile manufacturing regions leading production while developed markets drive premium application adoption.
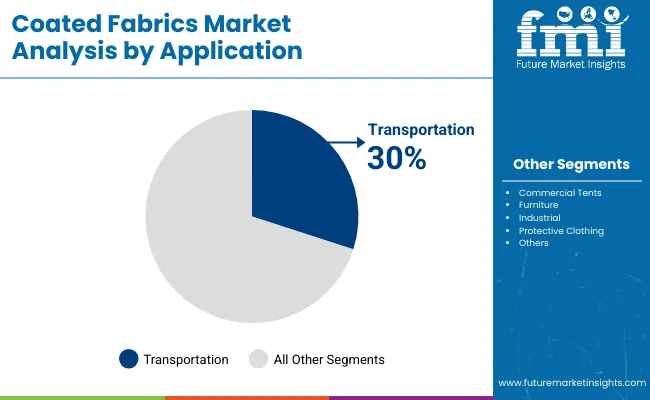
Market Position: Transportation applications command the leading position in the coated fabrics market with approximately 30.0% market share through diverse automotive requirements, including interiors & trims (12.0% sub-segment), seating & headliners (7.0%), airbags & safety fabrics (5.0%), and marine & rail uses (6.0%) that enable vehicle manufacturers to achieve optimal aesthetics, durability, and safety performance across passenger and commercial vehicle platforms.
Value Drivers: The segment benefits from automotive OEM preference for design-flexible materials providing leather-like appearance, superior abrasion resistance, and comprehensive regulatory compliance enabling interior differentiation without exotic leather costs. Advanced coating formulations enable low-fogging characteristics, UV resistance, and integration with automated cutting and sewing processes, where material consistency and OEM qualification represent critical supply requirements.
Competitive Advantages: Transportation-grade coated fabrics differentiate through proven automotive durability testing including 100,000+ Martindale cycles, consistent color and grain patterns, and compatibility with airbag deployment requirements that enhance safety reliability while maintaining aesthetic appeal suitable for diverse vehicle segments from economy to luxury.
Key market characteristics:
Protective clothing applications maintain 22.0% market share through industrial workwear, defense uniforms, and fire-resistant garments requiring flame-retardant coatings, chemical barriers, and high-visibility characteristics. These applications appeal to safety managers and procurement officers requiring certified protection for workers in hazardous environments including oil & gas, chemical processing, electrical utilities, and emergency response operations.
Industrial applications hold approximately 18.0% market share, focusing on tarpaulins for logistics and agriculture, conveyor belting for materials handling, and process covers for manufacturing equipment requiring durability, water resistance, and chemical tolerance for demanding industrial environments.
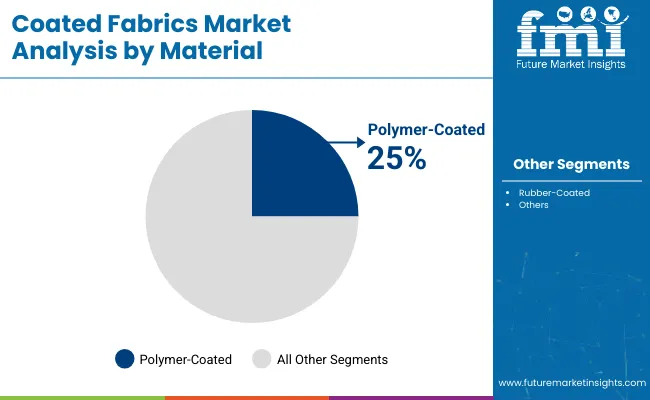
Market Context: Polymer-coated fabrics dominate the Coated Fabrics market with approximately 25.0% market share due to versatile processing characteristics and comprehensive application suitability, including PU-coated fabrics (11.0%), low-phthalate PVC alternatives (9.0%), and TPU formulations (5.0%) that collectively enable diverse end-use requirements from automotive interiors to medical device covers with optimized cost-performance balance.
Appeal Factors: Converters and end-users prioritize processing flexibility, aesthetic customization capability, and regulatory compliance enabling coordinated material development across multiple application segments. The segment benefits from substantial automotive industry adoption and furniture manufacturing consumption emphasizing consistent quality, design flexibility, and environmental compliance for VOC regulations and restricted substance directives.
Growth Drivers: Automotive interior sophistication incorporates advanced polyurethane coatings as standard materials for premium-feel surfaces, while furniture manufacturers increase adoption of low-phthalate PVC and PVC-free alternatives supporting environmental product declarations and green building certifications.
Market Challenges: Varying regional regulations regarding phthalate content, REACH restrictions, and VOC emissions may limit formulation standardization across global supply chains requiring localized chemistry adaptation.
Material dynamics include:
Rubber-coated fabrics capture approximately 23.0% market share through nitrile, EPDM, and neoprene chemistries serving conveyor belting, industrial hoses, and inflatable structures requiring superior abrasion resistance, chemical tolerance, and weatherability. These materials demand specialized calendering processes and vulcanization for demanding industrial applications.
Fabric-backed vinyl composites account for approximately 22.0% market share, including furniture upholstery, healthcare seating, and hospitality applications requiring cleanability, stain resistance, and aesthetic appeal for commercial and residential furniture markets.
Growth Accelerators: Automotive interior demand drives primary adoption as coated fabrics enable design differentiation and cost optimization supporting OEM aesthetic requirements through leather-alternative materials delivering comparable appearance at 30-50% lower cost while maintaining durability and safety compliance across seating, door panels, and instrument panel applications. Industrial safety regulation intensification accelerates market expansion as workplace protection mandates require flame-retardant and chemical-resistant garments for oil & gas, utilities, and chemical processing sectors, enabling comprehensive worker protection that aligns with OSHA, NFPA, and international occupational safety standards mandating engineered protective equipment adoption. Architectural membrane adoption increases worldwide, creating sustained demand for PTFE and silicone-coated fabrics supporting tensile roof structures, translucent building envelopes, and commercial tent facilities that provide lightweight, durable alternatives to conventional building materials enabling innovative architectural expression and temporary structure deployment.
Growth Inhibitors: Raw material cost volatility varies across polyurethane resin and PVC markets regarding feedstock pricing dynamics and supply-demand imbalances, which may compress converter margins and limit price competitiveness in automotive and furniture applications where material costs represent 40-60% of finished fabric value affecting profitability. Environmental compliance complexity persists regarding REACH restrictions on phthalates, biocides, and flame retardants requiring continuous formulation reformulation and qualification cycles that increase development costs and extend commercialization timelines for new product introductions across regulated markets. Market fragmentation across diverse application requirements and custom specifications creates standardization challenges between converters and end-users, requiring extensive technical service and application development that increase sales cycle complexity and limit economies of scale in specialty coating segments.
Market Evolution Patterns: Adoption accelerates in automotive and protective clothing segments where performance requirements and regulatory compliance justify premium coated fabric investments, with geographic concentration in European and North American developed markets transitioning toward Asia-Pacific manufacturing localization driven by automotive production shifts and technical textile capacity development. Technology development focuses on enhanced sustainability including bio-attributed polymers, recycled-content substrates, and solvent-free processing routes optimizing environmental footprint while maintaining equivalent or superior performance characteristics compared to conventional chemistries. The market could face disruption if alternative materials including thermoplastic composites, synthetic leathers using biotechnology, or advanced nonwoven technologies significantly penetrate traditional coated fabric applications in automotive interiors, protective clothing, or architectural membranes, fundamentally altering material selection criteria and processing value chains.
The coated fabrics market demonstrates varied regional dynamics with Growth Leaders including China (5.3% CAGR) and India (5.1% CAGR) driving expansion through automotive production scaling and infrastructure investment. Steady Performers encompass United States (4.6% CAGR), Japan (4.5% CAGR), and Germany (4.4% CAGR), benefiting from established automotive industries and technical textile expertise. Mature Markets feature South Korea (4.4% CAGR) and United Kingdom (4.2% CAGR), where specialized applications and sustainable material transitions support consistent growth.
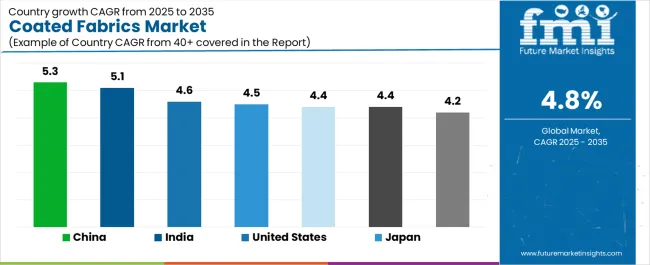
| Country | CAGR (2025-2035) |
|---|---|
| China | 5.3% |
| India | 5.1% |
| United States | 4.6% |
| Japan | 4.5% |
| Germany | 4.4% |
| South Korea | 4.4% |
| United Kingdom | 4.2% |
Regional synthesis reveals Asia-Pacific markets leading adoption through automotive production expansion and textile manufacturing capacity development, while European countries maintain premium positioning through sustainability innovation and regulatory compliance leadership. North American markets show moderate growth supported by automotive recovery and architectural membrane adoption.
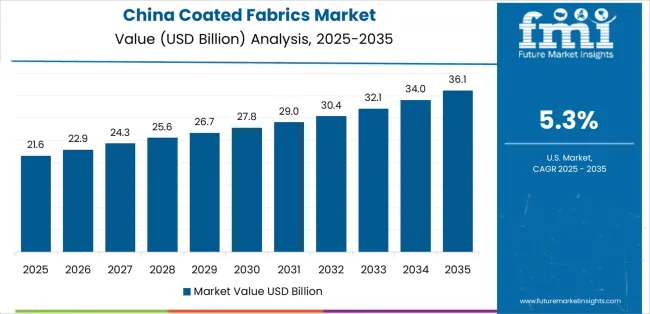
China establishes high-growth leadership through aggressive electric vehicle production scaling requiring interior trim materials and battery separator fabrics, civil engineering membrane adoption for infrastructure projects including tunnels, reservoirs, and environmental containment, and substantial export volumes of PVC and PU coated tarpaulins serving global logistics and agricultural markets, integrating coated fabric manufacturing as strategic industrial capability supporting domestic consumption and international trade. The country's 5.3% CAGR reflects automotive industry electrification programs and Belt & Road infrastructure investments requiring technical textile solutions for construction and transportation applications.
Growth concentrates in major manufacturing clusters including Jiangsu, Zhejiang, and Guangdong provinces, where coated fabric production showcases integrated supply chains from substrate weaving through coating conversion appealing to automotive OEMs and industrial buyers seeking cost-competitive materials with improving quality standards. Distribution channels through automotive tier suppliers, construction material distributors, and international trading companies expand market access, while government industrial policy supporting new energy vehicles and infrastructure development programs support adoption across automotive, construction, and industrial segments.
Strategic Market Indicators:
The coated fabrics market in India demonstrates robust growth through logistics and infrastructure tarpaulin demand supporting growing road freight and agricultural storage requirements, bus and rail seating fabrics for expanding public transportation fleets, and capacity additions in PU and PVC coating infrastructure by domestic converters and international partnerships. The market holds 5.1% CAGR, supported by Make in India automotive localization and infrastructure investment programs promoting domestic technical textile capacity development. Indian applications emphasize cost-effective solutions with improving durability and environmental compliance as regulatory frameworks advance toward international standards.
Market expansion benefits from growing automotive production serving domestic demand and export markets, with coating technology transfer enabling local manufacturing of automotive-grade materials. Technology adoption follows infrastructure development patterns where initial commodity tarpaulin production evolves toward sophisticated automotive interior and protective clothing applications.
Market Intelligence Brief:
USA market expansion benefits from light vehicle interior recovery following supply chain normalization and production increases, architectural textiles adoption for commercial buildings, sports facilities, and tensile structures emphasizing innovative design, and comprehensive shift to solvent-free coating chemistries supporting VOC regulations and corporate sustainability commitments. The country maintains 4.6% CAGR driven by automotive sector resilience, construction activity supporting architectural membrane projects, and environmental leadership advancing sustainable coating technologies.
American market emphasizes premium applications including automotive luxury interiors, high-performance protective clothing for defense and emergency services, and landmark architectural membrane projects requiring comprehensive engineering support and proven long-term durability. Growing sustainability focus drives innovation in bio-based polyurethane, recycled-content substrates, and circular economy participation supporting corporate environmental commitments.
Strategic Market Considerations:
Germany's advanced market demonstrates sophisticated coated fabric applications through premium automotive interiors for luxury brands including Mercedes, BMW, and Audi requiring superior surface quality and haptics, PTFE and silicone architectural façades for landmark building envelopes and transparent roof structures, and comprehensive REACH-aligned low-VOC chemistries supporting stringent European environmental regulations. The country maintains 4.4% CAGR driven by automotive industry technology leadership, architectural innovation culture, and environmental regulatory framework advancing sustainable coating technologies.
German converters prioritize comprehensive technical documentation, OEM qualification rigor, and application engineering support creating competitive differentiation through quality consistency and customer collaboration. The market benefits from established automotive supply chain integration and architectural engineering expertise supporting complex membrane structure projects.
Market Intelligence Brief:
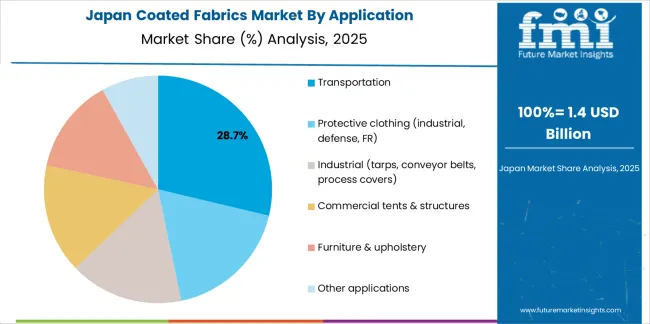
Japan shows steady market development with 4.5% CAGR, distinguished by airbag fabric coating requiring precise calendering and consistent quality for safety-critical applications, precision polyurethane coating for consumer electronics protective covers and medical device applications, and comprehensive quality management systems reflecting Japanese manufacturing excellence standards. The market prioritizes proven performance, extensive testing validation, and long-term supply reliability supporting automotive and industrial customer requirements.
South Korean market expansion benefits from battery manufacturing cleanroom textiles supporting EV battery gigafactory construction including Samsung SDI, LG Energy Solution, and SK On facilities requiring contamination control partitions and filtration fabrics, metro and rail interior fabrics supporting Seoul Metropolitan Subway expansion, Busan Metro line extensions, and KTX high-speed rail fleet renewals, and technical textile export capability including automotive seating fabrics, airbag substrates, and industrial protective materials serving Japanese, North American, and European OEMs requiring advanced coating technologies and quality consistency. The country maintains 4.4% CAGR driven by automotive electrification investment, urban transportation infrastructure modernization, and technological leadership in functional coating development supporting premium export positioning.
Korean coated fabrics producers emphasize technical innovation, comprehensive testing capabilities, and customer application engineering creating competitive advantages in battery industry supply chains and automotive interior specifications. Market dynamics focus on specialty applications, performance validation, and supply chain integration supporting advanced manufacturing requirements across EV production and transportation infrastructure sectors.
Strategic Market Indicators:
British coated fabrics market emphasizes aerospace and defense protective textiles including fire-resistant aircrew garments, military uniforms, and emergency responder protective equipment requiring comprehensive certification, PVC-free alternatives in furniture and automotive upholstery supporting environmental preferences and green building standards, and sustainable material innovation advancing bio-based polyurethane and recycled-content substrates. The market holds 4.2% CAGR driven by defense procurement, sustainability leadership, and premium application focus supporting domestic manufacturing capability.
Market expansion benefits from established protective clothing industry serving defense, aerospace, and emergency services requiring stringent flame-retardant and chemical-resistant performance specifications. Environmental leadership drives PVC-free material development supporting furniture industry sustainability objectives and architectural specification preferences.
Strategic Market Indicators:
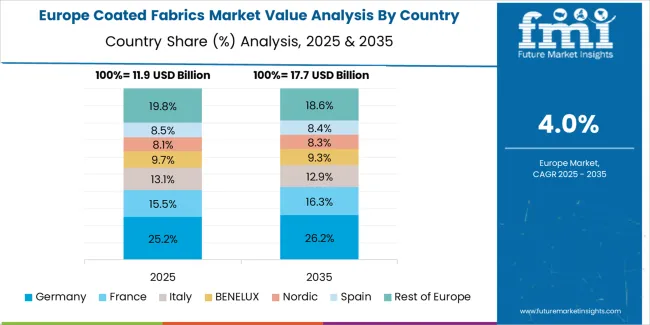
Europe accounts for approximately 31.0% of global coated fabrics revenue in 2025 (approximately USD 15.5 billion). Within Europe, Germany leads with approximately 24.0% of European market share (approximately USD 3.7 billion) driven by premium automotive interiors for luxury vehicle brands, PTFE and silicone architectural membranes for landmark façade and tensile projects, and strict REACH-compliant chemistries supporting comprehensive environmental regulation compliance. France follows with approximately 16.0% (approximately USD 2.5 billion) supported by technical textiles expertise and large façade and tensile architecture projects including stadium roofs and commercial developments. United Kingdom holds approximately 14.0% (approximately USD 2.2 billion) benefiting from aerospace and defense protective clothing applications and PVC-free upholstery alternatives supporting sustainability preferences. Italy commands approximately 12.0% (approximately USD 1.9 billion) with luxury furniture upholstery and marine fabric applications. Spain accounts for approximately 8.0% (approximately USD 1.2 billion) driven by logistics tarpaulins and sun-protection textile manufacturing. Netherlands captures approximately 5.0% (approximately USD 0.8 billion) serving as processing and export hub for coated industrial fabrics. Poland holds approximately 5.0% (approximately USD 0.8 billion) through automotive seating supply and industrial cover production. Nordics account for approximately 6.0% (approximately USD 0.9 billion) emphasizing low-VOC, recyclable outdoor textiles. Rest of Europe represents approximately 10.0% (approximately USD 1.6 billion) spanning Belgium, Austria, Czech Republic and other countries with balanced demand across transport, industrial, and architectural applications. The regional structure reflects comprehensive environmental compliance driving solvent-free coating adoption, automotive industry sophistication requiring premium interior materials, and architectural innovation culture supporting membrane structure deployment across commercial, sports, and infrastructure applications.
In Japan, the Coated Fabrics market prioritizes advanced polyurethane coating formulations, which capture the dominant premium segment share through proven performance reliability for airbag substrates, automotive interior trim, and consumer electronics protective covers. Japanese manufacturers emphasize consistent coating weight control, superior adhesion characteristics, and comprehensive quality documentation, creating sustained demand for precision-coated fabrics providing optimal mechanical properties and strict dimensional tolerances based on demanding automotive safety requirements and consumer electronics specifications for mission-critical protective and aesthetic applications.
Market Characteristics:
In South Korea, the market structure favors international coated fabric converters and integrated automotive suppliers including Hyundai Mobis, Korean affiliates of Continental, and specialized technical textile manufacturers, which maintain dominant positions through comprehensive product portfolios and established relationships with Hyundai Motor Group, Kia, and tier-1 automotive suppliers supporting domestic vehicle production and export platforms. These providers offer integrated solutions combining advanced coating technology with professional technical services and ongoing application support appealing to Korean automotive manufacturers seeking reliable interior material supply and design flexibility. Domestic converters capture moderate market share through competitive pricing and localized service for industrial and construction applications.
Channel Insights:
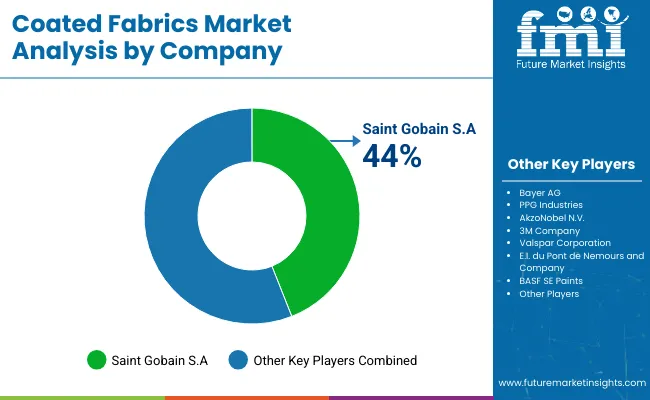
The coated fabrics market operates with moderate concentration, featuring approximately 25-35 meaningful participants globally, where leading companies control roughly 30-35% of the global market share through established automotive OEM relationships and comprehensive coating technology capabilities. Continental AG (Surface Solutions division) maintains the leading position with approximately 7.0% market share through extensive automotive interior materials expertise and global manufacturing presence. Competition emphasizes technical performance, OEM qualification capability, and sustainability credentials rather than price-based rivalry.
Market Leaders encompass Continental AG, Serge Ferrari Group, and Trelleborg AB, which maintain competitive advantages through extensive coating technology expertise, global production footprints, and comprehensive automotive and industrial customer relationships creating supply chain integration and supporting premium positioning. These companies leverage decades of technical textile experience and ongoing formulation investments to develop advanced coating chemistries with enhanced sustainability profiles including solvent-free processing, bio-attributed materials, and recycled-content substrates supporting customer environmental objectives.
Technology Innovators include Sioen Industries NV, Saint-Gobain Performance Fabrics, and Seaman Corporation, which compete through specialized coating technology focus and innovative material systems that appeal to architectural, protective clothing, and industrial customers seeking advanced performance characteristics and comprehensive sustainability documentation. These companies differentiate through rapid custom development cycles and specialized application expertise.
Regional Specialists feature companies like Spradling International, Haartz Corporation, and Cooley Group, which focus on specific geographic markets and specialized applications including automotive convertible tops, marine upholstery, and commercial furniture. Market dynamics favor participants that combine reliable material performance with comprehensive technical services including application engineering, OEM qualification support, and sustainability consulting. Competitive pressure intensifies as automotive OEMs consolidate supplier bases while specialty converters challenge established players through innovative sustainable chemistries and bio-attributed material platforms targeting environmentally-conscious construction and automotive segments.
| Item | Value |
|---|---|
| Quantitative Units | USD 50 billion |
| Application | Transportation, Protective clothing, Industrial, Commercial tents & structures, Furniture & upholstery, Others |
| Material | Polymer-coated fabrics, Rubber-coated, Fabric-backed vinyl composites, Silicone-coated, Fluoropolymer-coated |
| Fabric Substrate | Polyester (PET), Nylon (PA), Cotton & blends, Fiberglass, Aramid & high-modulus fibers |
| Regions Covered | North America, Europe, Asia Pacific, Latin America, Middle East & Africa |
| Countries Covered | China, United States, India, Germany, Japan, South Korea, United Kingdom, and 25+ additional countries |
| Key Companies Profiled | Continental AG, Serge Ferrari Group, Trelleborg AB, Sioen Industries NV, Saint-Gobain Performance Fabrics, Seaman Corporation |
| Additional Attributes | Dollar sales by application and material type categories, regional adoption trends across Asia-Pacific, Europe, and North America, competitive landscape with coated fabric converters and automotive suppliers, customer preferences for sustainability credentials and performance characteristics, integration with automotive OEM platforms and architectural engineering workflows, innovations in solvent-free coating technologies and bio-attributed materials, and development of circular economy solutions with enhanced recycled-content substrates and end-of-life recyclability capabilities. |
The global coated fabrics market is estimated to be valued at USD 50.0 billion in 2025.
The market size for the coated fabrics market is projected to reach USD 79.9 billion by 2035.
The coated fabrics market is expected to grow at a 4.8% CAGR between 2025 and 2035.
The key product types in coated fabrics market are transportation, protective clothing (industrial, defense, fr), industrial (tarps, conveyor belts, process covers), commercial tents & structures, furniture & upholstery and other applications.
In terms of material, polymer-coated fabrics segment to command 25.0% share in the coated fabrics market in 2025.


Full Research Suite comprises of:
Market outlook & trends analysis
Interviews & case studies
Strategic recommendations
Vendor profiles & capabilities analysis
5-year forecasts
8 regions and 60+ country-level data splits
Market segment data splits
12 months of continuous data updates
DELIVERED AS:
PDF EXCEL ONLINE
Coated Fabrics for Defense Market 2025 to 2035
ASEAN Coated Fabrics Market Insights – Demand, Size & Industry Trends 2025–2035
Japan Coated Fabrics Market Growth – Trends, Demand & Innovations 2025–2035
Polymer Coated Fabrics Market Trends 2025 to 2035
Germany Coated Fabrics Market Report – Trends, Demand & Industry Forecast 2025–2035
GCC Countries Coated Fabrics Market Size, Share, Trends, and Forecast 2025 to 2035
United States Coated Fabrics Market Outlook – Share, Growth & Forecast 2025–2035
United Kingdom Coated Fabrics Market Insights – Demand, Size & Industry Trends 2025–2035
Finishing Chemical for Coated Fabrics Market Forecast Outlook 2025 to 2035
Coated Label Market Size and Share Forecast Outlook 2025 to 2035
coated-paper-packaging-box-market-market-value-analysis
Coated Recycled Boxboard Market Size and Share Forecast Outlook 2025 to 2035
Coated Recycled Paperboard Market Size and Share Forecast Outlook 2025 to 2035
Coated Casing Market Size and Share Forecast Outlook 2025 to 2035
Market Share Breakdown of Coated Recycled Boxboard Manufacturers
Competitive Landscape of Coated Recycled Paperboard Providers
Coated White Board Paper Market
Coated Sack Kraft Paper Market
Coated Duplex Board Market
Uncoated Fine Papers Market Size and Share Forecast Outlook 2025 to 2035

Thank you!
You will receive an email from our Business Development Manager. Please be sure to check your SPAM/JUNK folder too.
Chat With
MaRIA