Coated Label Market Outlook for 2024 to 2034

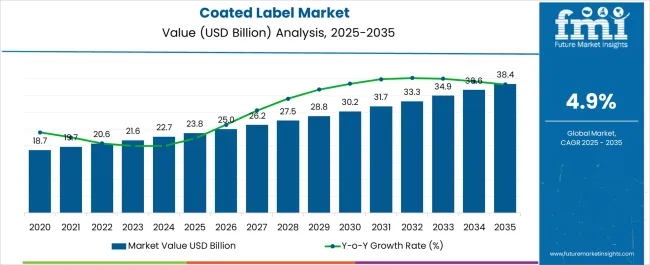
The coated label market size is going to be US$ 22.7 billion in 2024. The market valuation could go beyond US$ 36.3 billion by 2034, progressing at a CAGR of 4.90%.

Investment Opportunities in the Coated Label Market

  • Portfolio diversification into glossy-coated labels could be proven beneficial to market players. These are the perfect coating for rendering icons, logos, and images, bringing out the color that helps to demonstrate the brand's quality.
  • Coated labels embedded with advanced technologies are getting popular. Manufacturers can capitalize on this trend by adding sensors, NFC chips, or RFID tags, supporting functionalities like tracing and collaborating consumer engagements.
  • Improvements in coating technology, such as UV-curable and water-based coating, are catching the eyes of end-use industries. It is going to be advantageous to make more investments and enhancements.
Attributes Details
Market Value in 2024 US$ 22.7 billion
Market Value for 2034 US$ 36.3 billion
Value-based CAGR of Market for 2024 to 2034 4.90%

Don't pay for what you don't need

Customize your report by selecting specific countries or regions and save 30%!

Coated Label Market Analysis

  • High demand for durable and visually appealing labels motorizes the popularity of coated labels across applications and manufacturers.
  • Coated label offers high-quality printing. Given their non-absorbent quality, they utilize less ink to print.
  • Abilities such as more resistance to scratches, moisture, light, chemicals, and other contaminants make coated labels a popular choice among consumers
  • The coated label is covered with 'panita' spread on top of it in the form of varnish, which gives a smooth surface with a glossy, matte, and stained finish.
  • Improvements in coating technology, such as UV-curable and water-based coating, are deriving expansion and growing market potential.
  • The manufacturers open up new possibilities for innovation and value-added service with the coated label market to dynamic further growth and extension.

Challenges Limiting the Coated Label Market Expansion

  • A significant reduction in plastic usage by consumers is evident nowadays. Manufacturers are using coated labels made from sustainable materials, which is increasing the cost of production.
  • Regulatory compliance of labels can unfavorably affect the cost of production.
  • Demand for digital labels and innovation in packaging can adversely affect the demand for traditional coated labels.
Ismail Sutaria
Ismail Sutaria

Principal Consultant

Talk to Analyst

Find your sweet spots for generating winning opportunities in this market.

Trends in the Coated Label Market

  • Demand for sustainable labels and substrates is impacting the production of eco-friendly coated labels. Sustainable developments are not only going to be a selling point for the manufacturers but also essential for consumers to become conscious of their ecological footprint.
  • Technology advancement in the digital printing technique and coating technology impacts on printing and durability.
  • The demand for customized labels is driving innovation and developments in coating to accommodate unique designs.
  • Supervisory compliance concerning food safety, labels, and environmental guidelines impacts the innovation of coating labels in specific properties.
  • The eCommerce expansion stimulates the coating with enhanced durability and protective properties to ensure that the label remains intact and legible for customer satisfaction.
  • The coated label companies are a testimony to a growing utilization of variable data printing, to customize labels with unique text, images, or QR codes for multiple product units. The personalization trend aligns with the broader move towards meaningful and authentic brand communication.

Category-wise Outlook

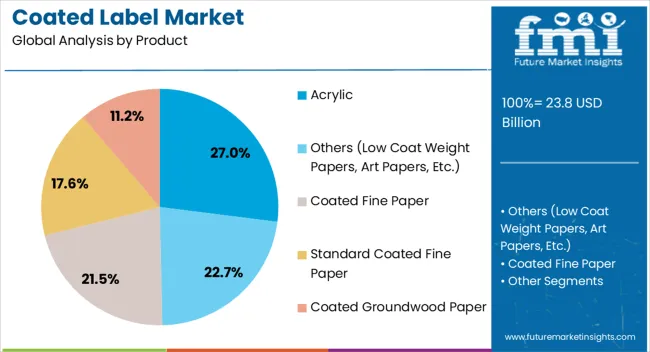
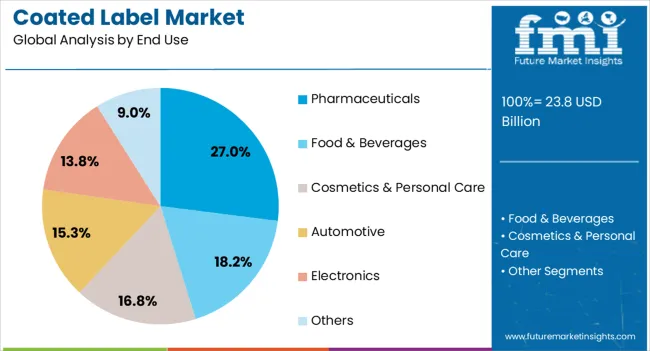
Acrylic coating’s supremacy is visible in the product segment. Coating labels perceive high demand from the pharmaceutical sector for their sustainability characteristic.

Acrylic Coating is the Go-to Choice for Coated Label

The acrylic coating segment is on track to acquire 27% of the market share in 2024 based on from. The components affecting the acrylic coating label are:

  • An acrylic coating label provides an excellent barrier to both moisture and humidity by enhancing the durability of the label.
  • Acrylic coating can enhance the product quality and protect the label from heat, water, and other components that affect the label.
  • Acrylic adhesives are a superb choice for reclosure labels and tamper-evident application.
Attributes Details
Product Acrylic
Market Share (2024) 27%

Technological Advancement Clouds the Usage of Coated Labels in the Pharmaceutical Sector

Pharmaceuticals are estimated to account for 27% of the market share in 2024 by end user category. Some of the factors influence the growing demand for coating in pharmaceutical industries:

  • The technology expansion ensures that the gumming for the labels is sufficient for it to withstand even extreme cold conditions and other environmental conditions.
  • The pharmaceutical industry requires special features for their packaging, such as security labels, hologram attributes, specialty inks, and other quality security through labels, which help maintain the exclusivity of the product and lower the risk of counterfeiting.
Attributes Details
End User Pharmaceuticals
Market Share (2024) 27%

Get the data you need at a Fraction of the cost

Personalize your report by choosing insights you need
and save 40%!

Country-wise Analysis

The Asia Pacific region is leading the demand for coated labels. Increasing consumer awareness regarding misleading concepts and favorable regulatory compliance support this demand. Market players in this region prioritize enhancing the sustainability and durability of these labels to make them attractive by improving the quality of the label by coating.

Countries CAGR (2024 to 2034)
Canada 3.4%
Germany 3.8%
United Kingdom 3.7%
India 6.0%
China 5.1%

Diverse Industrial Application Drives Market Growth in Canada

Canada is set to see the market enlarge at a CAGR of 3.3% over the forecast period. Factors that influence the coated label market growth in this country are:

  • The versatility of coated labels makes them highly appealing for labeling products in various sectors as per their requirement in Canada.
  • Canada-based manufacturers look for high-quality label solutions to enhance the presentation of multiple product-coated labels. Their aim is to offer high print quality, which is durable as well.
  • Development of advanced printing technology that can make coated labels waterproof and sustainable is also a matter of priority for manufacturers.

The eCommerce Sector Expands the Demand for Coated Labels in Germany

A CAGR of 3.8% for the market in Germany is calculated during the forecast period.

  • The growing eCommerce sector promptly demands packaging and labeling. In Germany, the popularity of online shopping is getting bigger. Labels here are highly desirable to withstand the rigors of shipping, various environmental conditions, and handling.
  • Coated label offers the opportunity for a vibrant and visually attractive design that helps manufacturers enhance their brand identity to gain consumer attraction.
  • Coated label demand is growing in various sectors across the country. To enhance the label quality, manufacturers are developing new technologies to make the label more attractive and durable.

Digital Technology Trend is Impacting the Coated Label Market Growth in the United States

The market is on its way to registering a CAGR of 3.7% in the United Kingdom. Factors that drive market growth here are:

  • Digital technology has met the numerous requirements of various end-use industries. Manufacturing and developing attractive coated labels with glossy and durability can attract potential consumers to make purchases.
  • Assimilation of digital technology with existing coated label manufacturing techniques is bringing massive change to this country's small-scale and large-scale sectors.
  • The market is moving toward sustainable solutions. The rapid focus on sustainable fiber allows producers to manufacture green labels to support the eco-friendly concept.

Customizing Trend for Coated Labels Bearing on Market Growth in India

The market in India could record a CAGR of 6.0% through 2034. Some of the reasons supporting the growth of the coated label market in this country are:

  • End-use industries in this country are attracted to the glossy and matte texture of the coated label. To upsurge quality and help brands promote their unique offerings, market players now offer attractive colors that certainly affect the coating of the label.
  • The trend of customization of coated labels is apparent here for various sectors, including FMCG, pharmaceuticals, and retailers.
  • Innovation in printing technologies contributed to expanding the coated label market by offering an extension of print quality and customization labels.

China’s Coated Label Printing Industry Focuses on Renovation and Transformation

The market is set to report a CAGR of 5.1% in China through 2034. Some of the factors driving the adoption of coated labels include:
  • Pharmaceutical and healthcare industries are gaining interest in the coated label due to its sense of durability and its ability to stand in any environmental condition.
  • The label printing process in China is flattering, with more advanced automated features. Smart labels are also being manufactured in China.
  • The development of digital printing technology continues both in households and with foreign technology.

Competitive Landscape in the Coated Label Market

The remarkable revolution in the coated label market is the manufacturing of eco-friendly, sustainable, and water-based coating by leading companies. These delivered the same level of performance as the traditional coating with a dropping environmental effect.

While manufacturing this label, market players used a renewable source and biodegradable substance with the capability of waterproof catering to fuel the sustainable packaging and label material. Market players are also involved in partnership and collaboration to get an edge in this highly competitive market.

Recent developments in the coated label market

  • In September 2022, AWA informed the development of extrusive coated labels. These extrusive coatings are highly versatile and cost-effective. These provide the desired finish to the plastic surface on packaging and labels.
  • In August 2021, SMI and Flexcon announced a partnership to offer polyester and vinyl label stock with high-performance adhesive concepts for harsh environment labeling.

Key market players

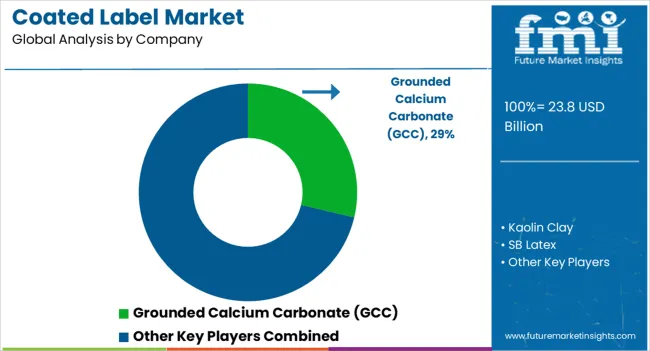
  • Coated Label Market
  • Coating Material
  • Grounded Calcium Carbonate (Gcc)
  • Kaolin Clay
  • SB Latex
  • Starch
  • Wax
  • Others (Tio2, Talc, PCC, etc.)

Key segments

By Product:

  • Coated Fine Paper
  • Standard Coated Fine Paper
  • Coated Groundwood Paper
  • Acrylic
  • Others (Low Coat Weight Papers, Art papers, etc.)

By End Use:

  • Food & Beverages
  • Pharmaceuticals
  • Cosmetics & Personal Care
  • Automotive
  • Electronics
  • Others

By Region:

  • North America
  • Latin America
  • Europe
  • South Asia
  • East Asia
  • Middle East & Africa (MEA)
  • Oceania

Frequently Asked Questions

What is the Demand Forecast for Coated Labels?

The demand for coated labels is estimated to be US$ 22.7 billion in 2024.

How Much Will the Coated Label Market Be Worth in 2034?

The market is expected to reach a valuation of US$ 36.3 billion by 2034.

What is the Future Outlook for Coated Labels?

The industry is expected to progress at a moderate CAGR of 4.90% from 2024 to 2034.

What are the Segments of the Coated Label Market?

The market can be segmented into the following categories: by product, end use, and region.

How will the Demand for Coated Label Progress in the United States?

The market is predicted to progress at a CAGR of 3.5% in the United States from 2024 to 2034.

What is the key Opportunity Availability in the Coated Label Industry?

Manufacturers find new prospects for innovation through offering value-added services.

How Will the Demand for Coated Label Progress in China?

The market is predicted to progress at a CAGR of 5.1% in China from 2024 to 2034.

Table of Content
1. Executive Summary
    1.1. Global Market Outlook
    1.2. Demand-side Trends
    1.3. Supply-side Trends
    1.4. Technology Roadmap Analysis
    1.5. Analysis and Recommendations
2. Market Overview
    2.1. Market Coverage / Taxonomy
    2.2. Market Definition / Scope / Limitations
3. Market Background
    3.1. Market Dynamics
        3.1.1. Drivers
        3.1.2. Restraints
        3.1.3. Opportunity
        3.1.4. Trends
    3.2. Scenario Forecast
        3.2.1. Demand in Optimistic Scenario
        3.2.2. Demand in Likely Scenario
        3.2.3. Demand in Conservative Scenario
    3.3. Opportunity Map Analysis
    3.4. Product Life Cycle Analysis
    3.5. Supply Chain Analysis
        3.5.1. Supply Side Participants and their Roles
            3.5.1.1. Manufacturer
        3.5.2. Value Added and Value Created at Node in the Supply Chain
        3.5.3. List of Raw Material Suppliers
        3.5.4. List of Existing and Potential Buyer’s
    3.6. Investment Feasibility Matrix
    3.7. Value Chain Analysis
        3.7.1. Profit Margin Analysis
    3.8. PESTLE and Porter’s Analysis
    3.9. Regulatory Landscape
        3.9.1. By Key Regions
        3.9.2. By Key Countries
    3.10. Regional Parent Market Outlook
    3.11. Production and Consumption Statistics
    3.12. Import and Export Statistics
4. Global Market Analysis 2019 to 2023 and Forecast, 2024 to 2034
    4.1. Historical Market Size Value (US$ Million) & Volume (Tons) Analysis, 2019 to 2023
    4.2. Current and Future Market Size Value (US$ Million) & Volume (Tons) Projections, 2024 to 2034
        4.2.1. Y-o-Y Growth Trend Analysis
        4.2.2. Absolute $ Opportunity Analysis
5. Global Market Analysis 2019 to 2023 and Forecast 2024 to 2034, By Coating Material
    5.1. Introduction / Key Findings
    5.2. Historical Market Size Value (US$ Million) & Volume (Tons) Analysis By Coating Material, 2019 to 2023
    5.3. Current and Future Market Size Value (US$ Million) & Volume (Tons) Analysis and Forecast By Coating Material, 2024 to 2034
        5.3.1. Grounded Calcium Carbonate (Gcc)
        5.3.2. Kaolin Clay
        5.3.3. SB Latex
        5.3.4. Starch
        5.3.5. Wax
        5.3.6. Others (Tio2, Talc, PCC, etc.)
    5.4. Y-o-Y Growth Trend Analysis By Coating Material, 2019 to 2023
    5.5. Absolute $ Opportunity Analysis By Coating Material, 2024 to 2034
6. Global Market Analysis 2019 to 2023 and Forecast 2024 to 2034, By Product
    6.1. Introduction / Key Findings
    6.2. Historical Market Size Value (US$ Million) & Volume (Tons) Analysis By Product, 2019 to 2023
    6.3. Current and Future Market Size Value (US$ Million) & Volume (Tons) Analysis and Forecast By Product, 2024 to 2034
        6.3.1. Coated Fine Paper
        6.3.2. Standard Coated Fine Paper
        6.3.3. Coated Ground Wood Paper
        6.3.4. Acrylic
        6.3.5. Others (Low Coat Weight Papers, Art papers, etc.)
    6.4. Y-o-Y Growth Trend Analysis By Product, 2019 to 2023
    6.5. Absolute $ Opportunity Analysis By Product, 2024 to 2034
7. Global Market Analysis 2019 to 2023 and Forecast 2024 to 2034, By End Use
    7.1. Introduction / Key Findings
    7.2. Historical Market Size Value (US$ Million) & Volume (Tons) Analysis By End Use, 2019 to 2023
    7.3. Current and Future Market Size Value (US$ Million) & Volume (Tons) Analysis and Forecast By End Use, 2024 to 2034
        7.3.1. Beverages
        7.3.2. Pharmaceuticals
        7.3.3. Cosmetics & Personal Care
        7.3.4. Automotive
        7.3.5. Electronics
        7.3.6. Others
    7.4. Y-o-Y Growth Trend Analysis By End Use, 2019 to 2023
    7.5. Absolute $ Opportunity Analysis By End Use, 2024 to 2034
8. Global Market Analysis 2019 to 2023 and Forecast 2024 to 2034, By Region
    8.1. Introduction
    8.2. Historical Market Size Value (US$ Million) & Volume (Tons) Analysis By Region, 2019 to 2023
    8.3. Current Market Size Value (US$ Million) & Volume (Tons) Analysis and Forecast By Region, 2024 to 2034
        8.3.1. North America
        8.3.2. Latin America
        8.3.3. Western Europe
        8.3.4. Eastern Europe
        8.3.5. South Asia and Pacific
        8.3.6. East Asia
        8.3.7. Middle East and Africa
    8.4. Market Attractiveness Analysis By Region
9. North America Market Analysis 2019 to 2023 and Forecast 2024 to 2034, By Country
    9.1. Historical Market Size Value (US$ Million) & Volume (Tons) Trend Analysis By Market Taxonomy, 2019 to 2023
    9.2. Market Size Value (US$ Million) & Volume (Tons) Forecast By Market Taxonomy, 2024 to 2034
        9.2.1. By Country
            9.2.1.1. USA
            9.2.1.2. Canada
        9.2.2. By Coating Material
        9.2.3. By Product
        9.2.4. By End Use
    9.3. Market Attractiveness Analysis
        9.3.1. By Country
        9.3.2. By Coating Material
        9.3.3. By Product
        9.3.4. By End Use
    9.4. Key Takeaways
10. Latin America Market Analysis 2019 to 2023 and Forecast 2024 to 2034, By Country
    10.1. Historical Market Size Value (US$ Million) & Volume (Tons) Trend Analysis By Market Taxonomy, 2019 to 2023
    10.2. Market Size Value (US$ Million) & Volume (Tons) Forecast By Market Taxonomy, 2024 to 2034
        10.2.1. By Country
            10.2.1.1. Brazil
            10.2.1.2. Mexico
            10.2.1.3. Rest of Latin America
        10.2.2. By Coating Material
        10.2.3. By Product
        10.2.4. By End Use
    10.3. Market Attractiveness Analysis
        10.3.1. By Country
        10.3.2. By Coating Material
        10.3.3. By Product
        10.3.4. By End Use
    10.4. Key Takeaways
11. Western Europe Market Analysis 2019 to 2023 and Forecast 2024 to 2034, By Country
    11.1. Historical Market Size Value (US$ Million) & Volume (Tons) Trend Analysis By Market Taxonomy, 2019 to 2023
    11.2. Market Size Value (US$ Million) & Volume (Tons) Forecast By Market Taxonomy, 2024 to 2034
        11.2.1. By Country
            11.2.1.1. Germany
            11.2.1.2. UK
            11.2.1.3. France
            11.2.1.4. Spain
            11.2.1.5. Italy
            11.2.1.6. Rest of Western Europe
        11.2.2. By Coating Material
        11.2.3. By Product
        11.2.4. By End Use
    11.3. Market Attractiveness Analysis
        11.3.1. By Country
        11.3.2. By Coating Material
        11.3.3. By Product
        11.3.4. By End Use
    11.4. Key Takeaways
12. Eastern Europe Market Analysis 2019 to 2023 and Forecast 2024 to 2034, By Country
    12.1. Historical Market Size Value (US$ Million) & Volume (Tons) Trend Analysis By Market Taxonomy, 2019 to 2023
    12.2. Market Size Value (US$ Million) & Volume (Tons) Forecast By Market Taxonomy, 2024 to 2034
        12.2.1. By Country
            12.2.1.1. Poland
            12.2.1.2. Russia
            12.2.1.3. Czech Republic
            12.2.1.4. Romania
            12.2.1.5. Rest of Eastern Europe
        12.2.2. By Coating Material
        12.2.3. By Product
        12.2.4. By End Use
    12.3. Market Attractiveness Analysis
        12.3.1. By Country
        12.3.2. By Coating Material
        12.3.3. By Product
        12.3.4. By End Use
    12.4. Key Takeaways
13. South Asia and Pacific Market Analysis 2019 to 2023 and Forecast 2024 to 2034, By Country
    13.1. Historical Market Size Value (US$ Million) & Volume (Tons) Trend Analysis By Market Taxonomy, 2019 to 2023
    13.2. Market Size Value (US$ Million) & Volume (Tons) Forecast By Market Taxonomy, 2024 to 2034
        13.2.1. By Country
            13.2.1.1. India
            13.2.1.2. Bangladesh
            13.2.1.3. Australia
            13.2.1.4. New Zealand
            13.2.1.5. Rest of South Asia and Pacific
        13.2.2. By Coating Material
        13.2.3. By Product
        13.2.4. By End Use
    13.3. Market Attractiveness Analysis
        13.3.1. By Country
        13.3.2. By Coating Material
        13.3.3. By Product
        13.3.4. By End Use
    13.4. Key Takeaways
14. East Asia Market Analysis 2019 to 2023 and Forecast 2024 to 2034, By Country
    14.1. Historical Market Size Value (US$ Million) & Volume (Tons) Trend Analysis By Market Taxonomy, 2019 to 2023
    14.2. Market Size Value (US$ Million) & Volume (Tons) Forecast By Market Taxonomy, 2024 to 2034
        14.2.1. By Country
            14.2.1.1. China
            14.2.1.2. Japan
            14.2.1.3. South Korea
        14.2.2. By Coating Material
        14.2.3. By Product
        14.2.4. By End Use
    14.3. Market Attractiveness Analysis
        14.3.1. By Country
        14.3.2. By Coating Material
        14.3.3. By Product
        14.3.4. By End Use
    14.4. Key Takeaways
15. Middle East and Africa Market Analysis 2019 to 2023 and Forecast 2024 to 2034, By Country
    15.1. Historical Market Size Value (US$ Million) & Volume (Tons) Trend Analysis By Market Taxonomy, 2019 to 2023
    15.2. Market Size Value (US$ Million) & Volume (Tons) Forecast By Market Taxonomy, 2024 to 2034
        15.2.1. By Country
            15.2.1.1. GCC Countries
            15.2.1.2. South Africa
            15.2.1.3. Israel
            15.2.1.4. Rest of MEA
        15.2.2. By Coating Material
        15.2.3. By Product
        15.2.4. By End Use
    15.3. Market Attractiveness Analysis
        15.3.1. By Country
        15.3.2. By Coating Material
        15.3.3. By Product
        15.3.4. By End Use
    15.4. Key Takeaways
16. Key Countries Market Analysis
    16.1. USA
        16.1.1. Pricing Analysis
        16.1.2. Market Share Analysis, 2023
            16.1.2.1. By Coating Material
            16.1.2.2. By Product
            16.1.2.3. By End Use
    16.2. Canada
        16.2.1. Pricing Analysis
        16.2.2. Market Share Analysis, 2023
            16.2.2.1. By Coating Material
            16.2.2.2. By Product
            16.2.2.3. By End Use
    16.3. Brazil
        16.3.1. Pricing Analysis
        16.3.2. Market Share Analysis, 2023
            16.3.2.1. By Coating Material
            16.3.2.2. By Product
            16.3.2.3. By End Use
    16.4. Mexico
        16.4.1. Pricing Analysis
        16.4.2. Market Share Analysis, 2023
            16.4.2.1. By Coating Material
            16.4.2.2. By Product
            16.4.2.3. By End Use
    16.5. Germany
        16.5.1. Pricing Analysis
        16.5.2. Market Share Analysis, 2023
            16.5.2.1. By Coating Material
            16.5.2.2. By Product
            16.5.2.3. By End Use
    16.6. UK
        16.6.1. Pricing Analysis
        16.6.2. Market Share Analysis, 2023
            16.6.2.1. By Coating Material
            16.6.2.2. By Product
            16.6.2.3. By End Use
    16.7. France
        16.7.1. Pricing Analysis
        16.7.2. Market Share Analysis, 2023
            16.7.2.1. By Coating Material
            16.7.2.2. By Product
            16.7.2.3. By End Use
    16.8. Spain
        16.8.1. Pricing Analysis
        16.8.2. Market Share Analysis, 2023
            16.8.2.1. By Coating Material
            16.8.2.2. By Product
            16.8.2.3. By End Use
    16.9. Italy
        16.9.1. Pricing Analysis
        16.9.2. Market Share Analysis, 2023
            16.9.2.1. By Coating Material
            16.9.2.2. By Product
            16.9.2.3. By End Use
    16.10. Poland
        16.10.1. Pricing Analysis
        16.10.2. Market Share Analysis, 2023
            16.10.2.1. By Coating Material
            16.10.2.2. By Product
            16.10.2.3. By End Use
    16.11. Russia
        16.11.1. Pricing Analysis
        16.11.2. Market Share Analysis, 2023
            16.11.2.1. By Coating Material
            16.11.2.2. By Product
            16.11.2.3. By End Use
    16.12. Czech Republic
        16.12.1. Pricing Analysis
        16.12.2. Market Share Analysis, 2023
            16.12.2.1. By Coating Material
            16.12.2.2. By Product
            16.12.2.3. By End Use
    16.13. Romania
        16.13.1. Pricing Analysis
        16.13.2. Market Share Analysis, 2023
            16.13.2.1. By Coating Material
            16.13.2.2. By Product
            16.13.2.3. By End Use
    16.14. India
        16.14.1. Pricing Analysis
        16.14.2. Market Share Analysis, 2023
            16.14.2.1. By Coating Material
            16.14.2.2. By Product
            16.14.2.3. By End Use
    16.15. Bangladesh
        16.15.1. Pricing Analysis
        16.15.2. Market Share Analysis, 2023
            16.15.2.1. By Coating Material
            16.15.2.2. By Product
            16.15.2.3. By End Use
    16.16. Australia
        16.16.1. Pricing Analysis
        16.16.2. Market Share Analysis, 2023
            16.16.2.1. By Coating Material
            16.16.2.2. By Product
            16.16.2.3. By End Use
    16.17. New Zealand
        16.17.1. Pricing Analysis
        16.17.2. Market Share Analysis, 2023
            16.17.2.1. By Coating Material
            16.17.2.2. By Product
            16.17.2.3. By End Use
    16.18. China
        16.18.1. Pricing Analysis
        16.18.2. Market Share Analysis, 2023
            16.18.2.1. By Coating Material
            16.18.2.2. By Product
            16.18.2.3. By End Use
    16.19. Japan
        16.19.1. Pricing Analysis
        16.19.2. Market Share Analysis, 2023
            16.19.2.1. By Coating Material
            16.19.2.2. By Product
            16.19.2.3. By End Use
    16.20. South Korea
        16.20.1. Pricing Analysis
        16.20.2. Market Share Analysis, 2023
            16.20.2.1. By Coating Material
            16.20.2.2. By Product
            16.20.2.3. By End Use
    16.21. GCC Countries
        16.21.1. Pricing Analysis
        16.21.2. Market Share Analysis, 2023
            16.21.2.1. By Coating Material
            16.21.2.2. By Product
            16.21.2.3. By End Use
    16.22. South Africa
        16.22.1. Pricing Analysis
        16.22.2. Market Share Analysis, 2023
            16.22.2.1. By Coating Material
            16.22.2.2. By Product
            16.22.2.3. By End Use
    16.23. Israel
        16.23.1. Pricing Analysis
        16.23.2. Market Share Analysis, 2023
            16.23.2.1. By Coating Material
            16.23.2.2. By Product
            16.23.2.3. By End Use
17. Market Structure Analysis
    17.1. Competition Dashboard
    17.2. Competition Benchmarking
    17.3. Market Share Analysis of Top Players
        17.3.1. By Regional
        17.3.2. By Coating Material
        17.3.3. By Product
        17.3.4. By End Use
18. Competition Analysis
    18.1. Competition Deep Dive
        18.1.1. Cosmo Films Ltd.
            18.1.1.1. Overview
            18.1.1.2. Product Portfolio
            18.1.1.3. Profitability by Market Segments
            18.1.1.4. Sales Footprint
            18.1.1.5. Strategy Overview
                18.1.1.5.1. Marketing Strategy
                18.1.1.5.2. Product Strategy
                18.1.1.5.3. Channel Strategy
        18.1.2. Propyplast SAS
            18.1.2.1. Overview
            18.1.2.2. Product Portfolio
            18.1.2.3. Profitability by Market Segments
            18.1.2.4. Sales Footprint
            18.1.2.5. Strategy Overview
                18.1.2.5.1. Marketing Strategy
                18.1.2.5.2. Product Strategy
                18.1.2.5.3. Channel Strategy
        18.1.3. Innovia Films Ltd.
            18.1.3.1. Overview
            18.1.3.2. Product Portfolio
            18.1.3.3. Profitability by Market Segments
            18.1.3.4. Sales Footprint
            18.1.3.5. Strategy Overview
                18.1.3.5.1. Marketing Strategy
                18.1.3.5.2. Product Strategy
                18.1.3.5.3. Channel Strategy
        18.1.4. Mondi Group Plc
            18.1.4.1. Overview
            18.1.4.2. Product Portfolio
            18.1.4.3. Profitability by Market Segments
            18.1.4.4. Sales Footprint
            18.1.4.5. Strategy Overview
                18.1.4.5.1. Marketing Strategy
                18.1.4.5.2. Product Strategy
                18.1.4.5.3. Channel Strategy
        18.1.5. Renolit SE
            18.1.5.1. Overview
            18.1.5.2. Product Portfolio
            18.1.5.3. Profitability by Market Segments
            18.1.5.4. Sales Footprint
            18.1.5.5. Strategy Overview
                18.1.5.5.1. Marketing Strategy
                18.1.5.5.2. Product Strategy
                18.1.5.5.3. Channel Strategy
        18.1.6. POLIFILM Group
            18.1.6.1. Overview
            18.1.6.2. Product Portfolio
            18.1.6.3. Profitability by Market Segments
            18.1.6.4. Sales Footprint
            18.1.6.5. Strategy Overview
                18.1.6.5.1. Marketing Strategy
                18.1.6.5.2. Product Strategy
                18.1.6.5.3. Channel Strategy
        18.1.7. Taghleef Industries Group
            18.1.7.1. Overview
            18.1.7.2. Product Portfolio
            18.1.7.3. Profitability by Market Segments
            18.1.7.4. Sales Footprint
            18.1.7.5. Strategy Overview
                18.1.7.5.1. Marketing Strategy
                18.1.7.5.2. Product Strategy
                18.1.7.5.3. Channel Strategy
        18.1.8. DuPont Teijin Films
            18.1.8.1. Overview
            18.1.8.2. Product Portfolio
            18.1.8.3. Profitability by Market Segments
            18.1.8.4. Sales Footprint
            18.1.8.5. Strategy Overview
                18.1.8.5.1. Marketing Strategy
                18.1.8.5.2. Product Strategy
                18.1.8.5.3. Channel Strategy
        18.1.9. Bischof + Klein France SAS
            18.1.9.1. Overview
            18.1.9.2. Product Portfolio
            18.1.9.3. Profitability by Market Segments
            18.1.9.4. Sales Footprint
            18.1.9.5. Strategy Overview
                18.1.9.5.1. Marketing Strategy
                18.1.9.5.2. Product Strategy
                18.1.9.5.3. Channel Strategy
        18.1.10. Jindal Films Americas
            18.1.10.1. Overview
            18.1.10.2. Product Portfolio
            18.1.10.3. Profitability by Market Segments
            18.1.10.4. Sales Footprint
            18.1.10.5. Strategy Overview
                18.1.10.5.1. Marketing Strategy
                18.1.10.5.2. Product Strategy
                18.1.10.5.3. Channel Strategy
        18.1.11. Bergen Plastics
            18.1.11.1. Overview
            18.1.11.2. Product Portfolio
            18.1.11.3. Profitability by Market Segments
            18.1.11.4. Sales Footprint
            18.1.11.5. Strategy Overview
                18.1.11.5.1. Marketing Strategy
                18.1.11.5.2. Product Strategy
                18.1.11.5.3. Channel Strategy
19. Assumptions & Acronyms Used
20. Research Methodology
Recommendations

Packaging

Sustainable Label Market

August 2024

REP-GB-15873

204 pages

Packaging

Freezer Label Market

June 2024

REP-GB-15776

313 pages

Packaging

Labels Market

August 2023

REP-GB-5835

324 pages

Explore Packaging Insights

View Reports
Future Market Insights

Coated Label Market

Schedule a Call