Glycine Soja (Soybean) Seed Extract Market Outlook from 2023 to 2033

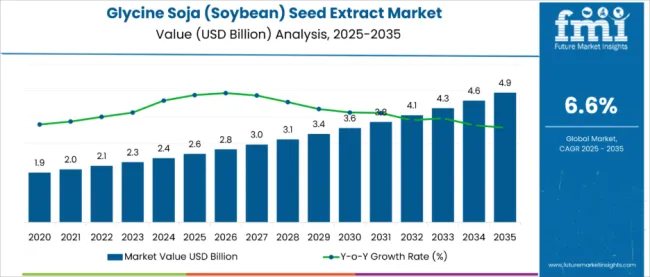
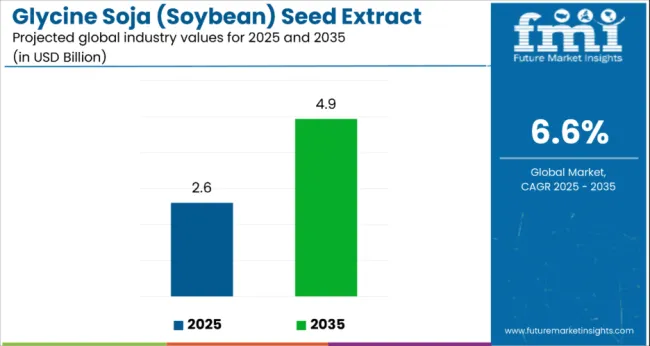
According to estimates, the glycine soja (soybean) seed extract market is estimated to be valued at USD 2,253.30 million in 2023. The market is expected to reach USD 4,269.60 million by 2033, developing at a CAGR of 6.60%.

Attributes Key Insights
Glycine Soja (Soybean) Seed Extract Market Estimated Size in 2023 USD 2,253.30 million
Projected Market Value in 2033 USD 4,269.90 million
Value-based CAGR from 2023 to 2033 6.60%

Glycine Soja (Soybean) Seed Extract Market Trend Analysis

  • Anti-ageing skin care products are gaining popularity among consumers day by day owing to increasing awareness about personal grooming as well as the fear of looking old.
  • Glycine soja (soybean) seed extract is used in skincare and anti-aging creams, which enables the creams to get the property of anti-aging.

2018 to 2022 Historical Analysis vs. 2023 to 2033 Market Forecast Projections

Glycine soja (soybean) seed extract is a powerful antioxidant and anti-inflammatory agent for the skin. Glycine soja (soybean) seed extract has vitamin E, allowing it to protect the skin from free radial damage and reduce the effects associated with the aging process, such as wrinkles and fine lines.

Consumers mainly females are very much concerned about their looks when it comes to fine lines and wrinkles on their skin and face, which is one of the driving factor of demand of this ingredient in cosmetic and skin care products. Glycine soja (soybean) seed extract can also reduce cellular damage caused by ultraviolet rays of the sun.

Glycine soja (soybean) seed extract is rich in many natural chemical components which is used as an ingredient for skin care products, one of which is known as Genistein. Genistein promotes a more youthful appearance. Anti-ageing products by men and women are in demand, and ingredients extracted from soybeans have been very much popular for anti-aging product manufacturing in last decade.

Glycine soja (soybean) seed extract demand is predicted to increase at a CAGR of 6.60% from 2023 to 2033, with the global market expected to reach a valuation of USD 4,269.60 million by 2033.

Market Value 2022 USD 2,111.80 million
Market Value in 2033 USD 4,269.60 million

Glycine Soja (Soybean) Seed Extract Market Growth Drivers

  • With a growing preference for natural and plant-based ingredients in various industries such as cosmetics, skincare, and pharmaceuticals, Glycine Soja Seed Extract, derived from soybeans, has gained popularity due to its perceived natural and beneficial properties.
  • Increased consumer awareness about the potential benefits of soybeans boost the market during the forecast period.
  • As health consciousness increases globally, consumers seek products that offer these advantages, driving the demand for soybean seed extract in supplements and functional foods.
  • Increasing application in various skincare products for its potential to improve skin texture, reduce signs of aging, and address skin issues, appealing to consumers looking for natural skincare solutions, dive market growth.
  • Advancements in extraction technologies have enabled the development of more refined and potent soybean extracts, enhancing their efficacy and expanding their applications across different industries, boosting market sales.
  • Soybeans and their extracts are integral components in the food and beverage industry, used in products like soy milk, tofu, and other soy-based alternatives.
  • The growing demand for plant-based protein sources and alternatives to dairy products drives demand for soybean-based products and extracts.

Glycine Soja (Soybean) Seed Extract Market Restraints

  • Soy allergies are prevalent among specific individuals, limiting the use of soy-derived products, including Glycine soja seed extract, in various formulations. This restriction in the potential consumer base affects the market reach of soy-based extract products.
  • The growing competition from alternative natural ingredients that offer similar properties or benefits impacts market growth.
  • Other plant-based extracts or synthetic alternatives might pose a challenge in terms of efficacy, cost, or consumer preference, impacting the market share of soybean seed extract.
  • The fluctuations in weather conditions and market demand, affect the cost and availability of soy-based extracts, impacting the profitability and stability of businesses reliant on these extracts.
  • Regulatory complexities and variations in regulations across different regions can pose hurdles for companies operating in multiple markets.
  • Compliance with diverse regulations regarding safety, labeling, and claims related to soybean seed extract products can be challenging and add to the operational costs.

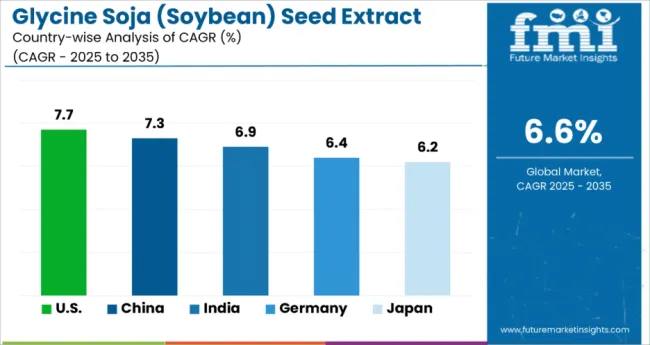
Country-wise Analysis

Countries Forecast CAGRs from 2023 to 2033
Germany 6.90%
India 7.70%
The United States 6.40%
China 7.30%

Growing Demand for Natural and Organic Cosmetic Products to Favor Market Growth in United States

The United States has a significant market for soy-based products in various industries, including cosmetics, skincare, and food. It is a leading consumer of natural and organic products, contributing to the demand for soybean seed extract in personal care items and supplements. The United States glycine soja seed extract market is anticipated to witness a CAGR of 6.40% by the end of 2033.

Strong focus on natural and organic products, driving the demand for soybean seed extract in cosmetics, skincare, and health supplements in the United States. Consumer awareness about the benefits of natural ingredients supports market growth. The food industry also utilizes soy extensively in various products.

Growing Consumer Awareness of Soybean Extract Benefits Drives the Market Demand.

As a significant producer and consumer of soybeans, the market for soy-based extracts in China is substantial. Glycine soja (soybean) seed extract is utilized extensively in skincare and cosmetic products due to traditional beliefs in its beneficial properties. Soy-based foods have a strong presence in Chinese cuisine. The China glycine soja seed extract market is anticipated to witness a CAGR of 7.30% by the end of 2033.

China has a substantial market for soy-based products and extracts. The skincare and cosmetics industries, particularly, are witnessing significant growth in demand for soybean seed extract due to its perceived benefits.

Increasing Demand for Beauty Care Products Driving the Market Growth in Germany

Germany and other European countries have a robust natural and organic skincare product market. Due to its perceived benefits, soybean seed extract is utilized in various skincare formulations. By the end of 2023, the Glycine soja seed extract market is anticipated to account for a CAGR of 6.90%.

Increasing demand for natural and organic cosmetics and skincare, contributing to the demand for soybean seed extract. Soy-based foods are well-established in this region, boosting the market demand.

Increasing Awareness about the Natural and Organic Ingredients in Beauty and Personal Care Products Boost Market Growth in India

The market for glycine soja (soybean) seed extract is growing in India owing to the increasing demand for skincare and cosmetics products. The shift towards natural and Ayurvedic-based products has increased interest in ingredients like soybean extract.

Growing demand for natural ingredients in food and beverage products drives the demand for glycine soja (Soybean) seed extract in these regions. The market in India is expected to rise at a CAGR of 7.70% by 2033.

Category-wise Analysis

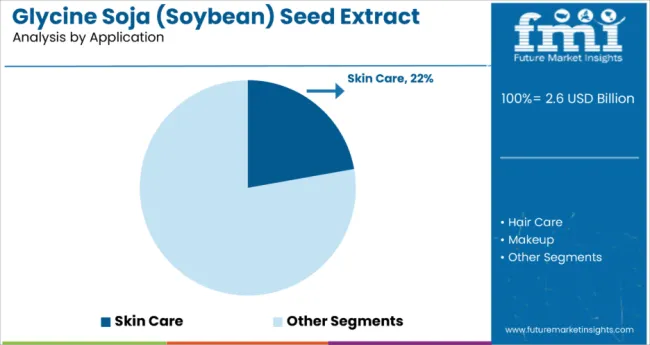
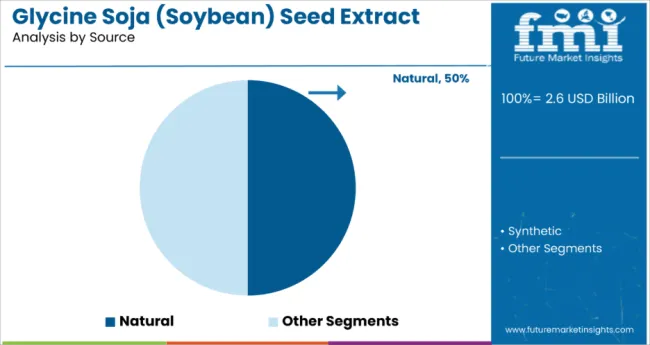
According to market forecasts, the skincare segment will dominate until 2033, with a market share of 22.20%. The organic segment is expected to have a share of 42.20%.

Category Market share
Organic 42.20%
Skincare 22.20%

Demand for Organic Glycine Soja (Soybean) Seed Extract to Remain High in the Global Market

The organic segment will continue to dominate the global glycine soja (soybean) seed extract market, accounting for a share of 42.20% in 2023. The growing consumer preference for organic skincare products due to concerns about potential exposure to harmful chemicals. Organic glycine soja (soybean) seed extract aligns with this trend, offering a natural alternative that's free from synthetic pesticides, and fertilizers, driving the growth of the segment.

Organic soybean seed extract is perceived as a safer option, minimizing the risk of skin irritation or adverse reactions often associated with synthetic additives. The production of organic glycine soja (soybean) seed extract often involves environmentally friendly farming practices that prioritize soil health, biodiversity, and water conservation. This sustainability aspect resonates with consumers concerned about environmental impact. Owing to all these factor demand for the organic segment is high.

Skincare Segment Creating Maximum Growth Opportunities for Manufacturers

Soybean seed extract is rich in fatty acids, particularly linoleic acid, which helps in maintaining the skin moisture barrier. This makes it effective for hydrating and nourishing the skin, making it a sought-after ingredient in moisturizers and emollients.

Components like genistein found in soybean extract can help stimulate collagen production and improve skin elasticity, reducing the appearance of fine lines and wrinkles. This anti-aging effect has contributed to its inclusion in anti-aging skincare formulations. The skincare application segment accounted for the highest share of 22.20% in 2023.

Glycine Soja (Soybean) Seed Extract Market: Key Players

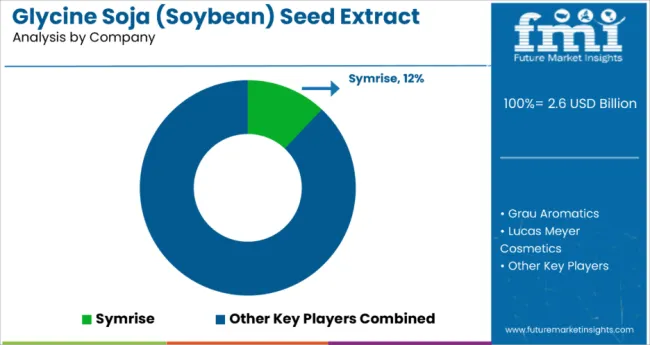
Some of the major players in the glycine soja (soybean) seed extract market Global Essence, Grau Aromatics, Symrise, Bellatorra Skin Care LLC, Natural Solution, The Organic Pharmacy Ltd., and Lucas Meyer Cosmetics, among others. These key market players are estimated to enhance Glycine Soja (Soybean) Seed Extract market growth with innovative product formulations and its launches.

Due to the presence of such a high number of participants, the market is highly competitive. While global players such as Wanrun Bio-Technology Co. Ltd. Botaniex Biotech Inc. account for a considerable market size, several regional-level players also operate across key growth regions.

  • Symrise, a global supplier of fragrances, flavorings, cosmetic ingredients, and raw materials, has been involved in creating innovative solutions using plant extracts, including soybean extract. They have focused on leveraging the properties of soybeans in skincare, cosmetics, and personal care products.
  • Estée Lauder has incorporated soybean seed extract into various skincare lines. They have utilized it for its potential to even out skin tone, reduce the appearance of dark spots, and provide antioxidant protection.
  • L'Oréal has been active in using soybean seed extract in several of its skincare and cosmetic products. They have emphasized its moisturizing properties and its ability to improve skin texture and radiance.

Report Scope

Attributes Details
Estimated Market Size in 2023 USD 2,253.30 million
Projected Market Valuation in 2033 USD 4,269.60 million
Value-based CAGR 2023 to 2033 6.60%
Forecast Period 2023 to 2033
Historical Data Available for 2018 to 2022
Market Analysis Value in USD million
Key Regions Covered North America; Latin America; Western Europe; Eastern Europe; South Asia and Pacific; East Asia; Middle East and Africa
Key Market Segments Covered Application, Form, Source, End-Use Industry, Region
Key Countries Profiled The United States, Canada, Brazil, Mexico, Germany, The United Kingdom, France, Spain, Italy, Russia, Poland, Czech Republic, Romania, India, Bangladesh, Australia, New Zealand, China, Japan, South Korea, GCC countries, South Africa, Israel
Key Companies Profiled Grau Aromatics; Symrise; Bellatorra Skin Care LLC; Natural Solution; The Organic Pharmacy Ltd; Lucas Meyer Cosmetics; JF Natural; Durae Corporation; Carrubba; Others

Market Segmentation

By Application:

  • Skin Care
  • Hair Care
  • Makeup
  • Bath and Body Care
  • Food
  • Medicines

By Form:

  • Liquid
  • Semi-liquid

By Source:

  • Natural
  • Synthetic

By End Use Industry:

  • Cosmetic and Personal Care Industry
  • Pharmaceutical Industry
  • Food and Beverage Industry
  • Others

By Region:

  • North America
  • Latin America
  • Europe
  • East Asia
  • South Asia
  • Oceania
  • The Middle East and Africa

Table of Content

  • 1. Executive Summary
  • 2. Market Overview
  • 3. Market Background
  • 4. Global Market Analysis 2018 to 2022 and Forecast, 2023 to 2033
  • 5. Global Market Analysis 2018 to 2022 and Forecast 2023 to 2033, By Application
    • 5.1. Skin Care
    • 5.2. Hair Care
    • 5.3. Makeup
    • 5.4. Bath and Body Care
    • 5.5. Food
    • 5.6. Medicines
  • 6. Global Market Analysis 2018 to 2022 and Forecast 2023 to 2033, By Form
    • 6.1. Liquid
    • 6.2. Semi-liquid
  • 7. Global Market Analysis 2018 to 2022 and Forecast 2023 to 2033, By Source
    • 7.1. Natural
    • 7.2. Synthetic
  • 8. Global Market Analysis 2018 to 2022 and Forecast 2023 to 2033, By End Use Industry
    • 8.1. Cosmetic and Personal Care Industry
    • 8.2. Pharmaceutical Industry
    • 8.3. Food and Beverage Industry
    • 8.4. Others
  • 9. Global Market Analysis 2018 to 2022 and Forecast 2023 to 2033, By Region
    • 9.1. North America
    • 9.2. Latin America
    • 9.3. Europe
    • 9.4. East Asia
    • 9.5. South Asia
    • 9.6. Oceania
    • 9.7. MEA
  • 10. North America Market Analysis 2018 to 2022 and Forecast 2023 to 2033, By Country
  • 11. Latin America Market Analysis 2018 to 2022 and Forecast 2023 to 2033, By Country
  • 12. Europe Market Analysis 2018 to 2022 and Forecast 2023 to 2033, By Country
  • 13. East Asia Market Analysis 2018 to 2022 and Forecast 2023 to 2033, By Country
  • 14. South Asia Market Analysis 2018 to 2022 and Forecast 2023 to 2033, By Country
  • 15. Oceania Market Analysis 2018 to 2022 and Forecast 2023 to 2033, By Country
  • 16. MEA Market Analysis 2018 to 2022 and Forecast 2023 to 2033, By Country
  • 17. Key Countries Market Analysis
  • 18. Market Structure Analysis
  • 19. Competition Analysis
    • 19.1. Grau Aromatics
    • 19.2. Symrise
    • 19.3. Bellatorra Skin Care LLC
    • 19.4. Natural Solution
    • 19.5. The Organic Pharmacy Ltd
    • 19.6. Lucas Meyer Cosmetics
    • 19.7. JF Natural
    • 19.8. Durae Corporation
    • 19.9. Carrubba
    • 19.10. Others
  • 20. Assumptions & Acronyms Used
  • 21. Research Methodology

List of Tables

Table 1: Global Market Value (US$ Million) Forecast by Region, 2018 to 2033

Table 2: Global Market Volume (Tons) Forecast by Region, 2018 to 2033

Table 3: Global Market Value (US$ Million) Forecast by Application, 2018 to 2033

Table 4: Global Market Volume (Tons) Forecast by Application, 2018 to 2033

Table 5: Global Market Value (US$ Million) Forecast by Form, 2018 to 2033

Table 6: Global Market Volume (Tons) Forecast by Form, 2018 to 2033

Table 7: Global Market Value (US$ Million) Forecast by Source, 2018 to 2033

Table 8: Global Market Volume (Tons) Forecast by Source, 2018 to 2033

Table 9: Global Market Value (US$ Million) Forecast by End use industry, 2018 to 2033

Table 10: Global Market Volume (Tons) Forecast by End use industry, 2018 to 2033

Table 11: North America Market Value (US$ Million) Forecast by Country, 2018 to 2033

Table 12: North America Market Volume (Tons) Forecast by Country, 2018 to 2033

Table 13: North America Market Value (US$ Million) Forecast by Application, 2018 to 2033

Table 14: North America Market Volume (Tons) Forecast by Application, 2018 to 2033

Table 15: North America Market Value (US$ Million) Forecast by Form, 2018 to 2033

Table 16: North America Market Volume (Tons) Forecast by Form, 2018 to 2033

Table 17: North America Market Value (US$ Million) Forecast by Source, 2018 to 2033

Table 18: North America Market Volume (Tons) Forecast by Source, 2018 to 2033

Table 19: North America Market Value (US$ Million) Forecast by End use industry, 2018 to 2033

Table 20: North America Market Volume (Tons) Forecast by End use industry, 2018 to 2033

Table 21: Latin America Market Value (US$ Million) Forecast by Country, 2018 to 2033

Table 22: Latin America Market Volume (Tons) Forecast by Country, 2018 to 2033

Table 23: Latin America Market Value (US$ Million) Forecast by Application, 2018 to 2033

Table 24: Latin America Market Volume (Tons) Forecast by Application, 2018 to 2033

Table 25: Latin America Market Value (US$ Million) Forecast by Form, 2018 to 2033

Table 26: Latin America Market Volume (Tons) Forecast by Form, 2018 to 2033

Table 27: Latin America Market Value (US$ Million) Forecast by Source, 2018 to 2033

Table 28: Latin America Market Volume (Tons) Forecast by Source, 2018 to 2033

Table 29: Latin America Market Value (US$ Million) Forecast by End use industry, 2018 to 2033

Table 30: Latin America Market Volume (Tons) Forecast by End use industry, 2018 to 2033

Table 31: Europe Market Value (US$ Million) Forecast by Country, 2018 to 2033

Table 32: Europe Market Volume (Tons) Forecast by Country, 2018 to 2033

Table 33: Europe Market Value (US$ Million) Forecast by Application, 2018 to 2033

Table 34: Europe Market Volume (Tons) Forecast by Application, 2018 to 2033

Table 35: Europe Market Value (US$ Million) Forecast by Form, 2018 to 2033

Table 36: Europe Market Volume (Tons) Forecast by Form, 2018 to 2033

Table 37: Europe Market Value (US$ Million) Forecast by Source, 2018 to 2033

Table 38: Europe Market Volume (Tons) Forecast by Source, 2018 to 2033

Table 39: Europe Market Value (US$ Million) Forecast by End use industry, 2018 to 2033

Table 40: Europe Market Volume (Tons) Forecast by End use industry, 2018 to 2033

Table 41: East Asia Market Value (US$ Million) Forecast by Country, 2018 to 2033

Table 42: East Asia Market Volume (Tons) Forecast by Country, 2018 to 2033

Table 43: East Asia Market Value (US$ Million) Forecast by Application, 2018 to 2033

Table 44: East Asia Market Volume (Tons) Forecast by Application, 2018 to 2033

Table 45: East Asia Market Value (US$ Million) Forecast by Form, 2018 to 2033

Table 46: East Asia Market Volume (Tons) Forecast by Form, 2018 to 2033

Table 47: East Asia Market Value (US$ Million) Forecast by Source, 2018 to 2033

Table 48: East Asia Market Volume (Tons) Forecast by Source, 2018 to 2033

Table 49: East Asia Market Value (US$ Million) Forecast by End use industry, 2018 to 2033

Table 50: East Asia Market Volume (Tons) Forecast by End use industry, 2018 to 2033

Table 51: South Asia Market Value (US$ Million) Forecast by Country, 2018 to 2033

Table 52: South Asia Market Volume (Tons) Forecast by Country, 2018 to 2033

Table 53: South Asia Market Value (US$ Million) Forecast by Application, 2018 to 2033

Table 54: South Asia Market Volume (Tons) Forecast by Application, 2018 to 2033

Table 55: South Asia Market Value (US$ Million) Forecast by Form, 2018 to 2033

Table 56: South Asia Market Volume (Tons) Forecast by Form, 2018 to 2033

Table 57: South Asia Market Value (US$ Million) Forecast by Source, 2018 to 2033

Table 58: South Asia Market Volume (Tons) Forecast by Source, 2018 to 2033

Table 59: South Asia Market Value (US$ Million) Forecast by End use industry, 2018 to 2033

Table 60: South Asia Market Volume (Tons) Forecast by End use industry, 2018 to 2033

Table 61: Oceania Market Value (US$ Million) Forecast by Country, 2018 to 2033

Table 62: Oceania Market Volume (Tons) Forecast by Country, 2018 to 2033

Table 63: Oceania Market Value (US$ Million) Forecast by Application, 2018 to 2033

Table 64: Oceania Market Volume (Tons) Forecast by Application, 2018 to 2033

Table 65: Oceania Market Value (US$ Million) Forecast by Form, 2018 to 2033

Table 66: Oceania Market Volume (Tons) Forecast by Form, 2018 to 2033

Table 67: Oceania Market Value (US$ Million) Forecast by Source, 2018 to 2033

Table 68: Oceania Market Volume (Tons) Forecast by Source, 2018 to 2033

Table 69: Oceania Market Value (US$ Million) Forecast by End use industry, 2018 to 2033

Table 70: Oceania Market Volume (Tons) Forecast by End use industry, 2018 to 2033

Table 71: MEA Market Value (US$ Million) Forecast by Country, 2018 to 2033

Table 72: MEA Market Volume (Tons) Forecast by Country, 2018 to 2033

Table 73: MEA Market Value (US$ Million) Forecast by Application, 2018 to 2033

Table 74: MEA Market Volume (Tons) Forecast by Application, 2018 to 2033

Table 75: MEA Market Value (US$ Million) Forecast by Form, 2018 to 2033

Table 76: MEA Market Volume (Tons) Forecast by Form, 2018 to 2033

Table 77: MEA Market Value (US$ Million) Forecast by Source, 2018 to 2033

Table 78: MEA Market Volume (Tons) Forecast by Source, 2018 to 2033

Table 79: MEA Market Value (US$ Million) Forecast by End use industry, 2018 to 2033

Table 80: MEA Market Volume (Tons) Forecast by End use industry, 2018 to 2033

List of Figures

Figure 1: Global Market Value (US$ Million) by Application, 2023 to 2033

Figure 2: Global Market Value (US$ Million) by Form, 2023 to 2033

Figure 3: Global Market Value (US$ Million) by Source, 2023 to 2033

Figure 4: Global Market Value (US$ Million) by End use industry, 2023 to 2033

Figure 5: Global Market Value (US$ Million) by Region, 2023 to 2033

Figure 6: Global Market Value (US$ Million) Analysis by Region, 2018 to 2033

Figure 7: Global Market Volume (Tons) Analysis by Region, 2018 to 2033

Figure 8: Global Market Value Share (%) and BPS Analysis by Region, 2023 to 2033

Figure 9: Global Market Y-o-Y Growth (%) Projections by Region, 2023 to 2033

Figure 10: Global Market Value (US$ Million) Analysis by Application, 2018 to 2033

Figure 11: Global Market Volume (Tons) Analysis by Application, 2018 to 2033

Figure 12: Global Market Value Share (%) and BPS Analysis by Application, 2023 to 2033

Figure 13: Global Market Y-o-Y Growth (%) Projections by Application, 2023 to 2033

Figure 14: Global Market Value (US$ Million) Analysis by Form, 2018 to 2033

Figure 15: Global Market Volume (Tons) Analysis by Form, 2018 to 2033

Figure 16: Global Market Value Share (%) and BPS Analysis by Form, 2023 to 2033

Figure 17: Global Market Y-o-Y Growth (%) Projections by Form, 2023 to 2033

Figure 18: Global Market Value (US$ Million) Analysis by Source, 2018 to 2033

Figure 19: Global Market Volume (Tons) Analysis by Source, 2018 to 2033

Figure 20: Global Market Value Share (%) and BPS Analysis by Source, 2023 to 2033

Figure 21: Global Market Y-o-Y Growth (%) Projections by Source, 2023 to 2033

Figure 22: Global Market Value (US$ Million) Analysis by End use industry, 2018 to 2033

Figure 23: Global Market Volume (Tons) Analysis by End use industry, 2018 to 2033

Figure 24: Global Market Value Share (%) and BPS Analysis by End use industry, 2023 to 2033

Figure 25: Global Market Y-o-Y Growth (%) Projections by End use industry, 2023 to 2033

Figure 26: Global Market Attractiveness by Application, 2023 to 2033

Figure 27: Global Market Attractiveness by Form, 2023 to 2033

Figure 28: Global Market Attractiveness by Source, 2023 to 2033

Figure 29: Global Market Attractiveness by End use industry, 2023 to 2033

Figure 30: Global Market Attractiveness by Region, 2023 to 2033

Figure 31: North America Market Value (US$ Million) by Application, 2023 to 2033

Figure 32: North America Market Value (US$ Million) by Form, 2023 to 2033

Figure 33: North America Market Value (US$ Million) by Source, 2023 to 2033

Figure 34: North America Market Value (US$ Million) by End use industry, 2023 to 2033

Figure 35: North America Market Value (US$ Million) by Country, 2023 to 2033

Figure 36: North America Market Value (US$ Million) Analysis by Country, 2018 to 2033

Figure 37: North America Market Volume (Tons) Analysis by Country, 2018 to 2033

Figure 38: North America Market Value Share (%) and BPS Analysis by Country, 2023 to 2033

Figure 39: North America Market Y-o-Y Growth (%) Projections by Country, 2023 to 2033

Figure 40: North America Market Value (US$ Million) Analysis by Application, 2018 to 2033

Figure 41: North America Market Volume (Tons) Analysis by Application, 2018 to 2033

Figure 42: North America Market Value Share (%) and BPS Analysis by Application, 2023 to 2033

Figure 43: North America Market Y-o-Y Growth (%) Projections by Application, 2023 to 2033

Figure 44: North America Market Value (US$ Million) Analysis by Form, 2018 to 2033

Figure 45: North America Market Volume (Tons) Analysis by Form, 2018 to 2033

Figure 46: North America Market Value Share (%) and BPS Analysis by Form, 2023 to 2033

Figure 47: North America Market Y-o-Y Growth (%) Projections by Form, 2023 to 2033

Figure 48: North America Market Value (US$ Million) Analysis by Source, 2018 to 2033

Figure 49: North America Market Volume (Tons) Analysis by Source, 2018 to 2033

Figure 50: North America Market Value Share (%) and BPS Analysis by Source, 2023 to 2033

Figure 51: North America Market Y-o-Y Growth (%) Projections by Source, 2023 to 2033

Figure 52: North America Market Value (US$ Million) Analysis by End use industry, 2018 to 2033

Figure 53: North America Market Volume (Tons) Analysis by End use industry, 2018 to 2033

Figure 54: North America Market Value Share (%) and BPS Analysis by End use industry, 2023 to 2033

Figure 55: North America Market Y-o-Y Growth (%) Projections by End use industry, 2023 to 2033

Figure 56: North America Market Attractiveness by Application, 2023 to 2033

Figure 57: North America Market Attractiveness by Form, 2023 to 2033

Figure 58: North America Market Attractiveness by Source, 2023 to 2033

Figure 59: North America Market Attractiveness by End use industry, 2023 to 2033

Figure 60: North America Market Attractiveness by Country, 2023 to 2033

Figure 61: Latin America Market Value (US$ Million) by Application, 2023 to 2033

Figure 62: Latin America Market Value (US$ Million) by Form, 2023 to 2033

Figure 63: Latin America Market Value (US$ Million) by Source, 2023 to 2033

Figure 64: Latin America Market Value (US$ Million) by End use industry, 2023 to 2033

Figure 65: Latin America Market Value (US$ Million) by Country, 2023 to 2033

Figure 66: Latin America Market Value (US$ Million) Analysis by Country, 2018 to 2033

Figure 67: Latin America Market Volume (Tons) Analysis by Country, 2018 to 2033

Figure 68: Latin America Market Value Share (%) and BPS Analysis by Country, 2023 to 2033

Figure 69: Latin America Market Y-o-Y Growth (%) Projections by Country, 2023 to 2033

Figure 70: Latin America Market Value (US$ Million) Analysis by Application, 2018 to 2033

Figure 71: Latin America Market Volume (Tons) Analysis by Application, 2018 to 2033

Figure 72: Latin America Market Value Share (%) and BPS Analysis by Application, 2023 to 2033

Figure 73: Latin America Market Y-o-Y Growth (%) Projections by Application, 2023 to 2033

Figure 74: Latin America Market Value (US$ Million) Analysis by Form, 2018 to 2033

Figure 75: Latin America Market Volume (Tons) Analysis by Form, 2018 to 2033

Figure 76: Latin America Market Value Share (%) and BPS Analysis by Form, 2023 to 2033

Figure 77: Latin America Market Y-o-Y Growth (%) Projections by Form, 2023 to 2033

Figure 78: Latin America Market Value (US$ Million) Analysis by Source, 2018 to 2033

Figure 79: Latin America Market Volume (Tons) Analysis by Source, 2018 to 2033

Figure 80: Latin America Market Value Share (%) and BPS Analysis by Source, 2023 to 2033

Figure 81: Latin America Market Y-o-Y Growth (%) Projections by Source, 2023 to 2033

Figure 82: Latin America Market Value (US$ Million) Analysis by End use industry, 2018 to 2033

Figure 83: Latin America Market Volume (Tons) Analysis by End use industry, 2018 to 2033

Figure 84: Latin America Market Value Share (%) and BPS Analysis by End use industry, 2023 to 2033

Figure 85: Latin America Market Y-o-Y Growth (%) Projections by End use industry, 2023 to 2033

Figure 86: Latin America Market Attractiveness by Application, 2023 to 2033

Figure 87: Latin America Market Attractiveness by Form, 2023 to 2033

Figure 88: Latin America Market Attractiveness by Source, 2023 to 2033

Figure 89: Latin America Market Attractiveness by End use industry, 2023 to 2033

Figure 90: Latin America Market Attractiveness by Country, 2023 to 2033

Figure 91: Europe Market Value (US$ Million) by Application, 2023 to 2033

Figure 92: Europe Market Value (US$ Million) by Form, 2023 to 2033

Figure 93: Europe Market Value (US$ Million) by Source, 2023 to 2033

Figure 94: Europe Market Value (US$ Million) by End use industry, 2023 to 2033

Figure 95: Europe Market Value (US$ Million) by Country, 2023 to 2033

Figure 96: Europe Market Value (US$ Million) Analysis by Country, 2018 to 2033

Figure 97: Europe Market Volume (Tons) Analysis by Country, 2018 to 2033

Figure 98: Europe Market Value Share (%) and BPS Analysis by Country, 2023 to 2033

Figure 99: Europe Market Y-o-Y Growth (%) Projections by Country, 2023 to 2033

Figure 100: Europe Market Value (US$ Million) Analysis by Application, 2018 to 2033

Figure 101: Europe Market Volume (Tons) Analysis by Application, 2018 to 2033

Figure 102: Europe Market Value Share (%) and BPS Analysis by Application, 2023 to 2033

Figure 103: Europe Market Y-o-Y Growth (%) Projections by Application, 2023 to 2033

Figure 104: Europe Market Value (US$ Million) Analysis by Form, 2018 to 2033

Figure 105: Europe Market Volume (Tons) Analysis by Form, 2018 to 2033

Figure 106: Europe Market Value Share (%) and BPS Analysis by Form, 2023 to 2033

Figure 107: Europe Market Y-o-Y Growth (%) Projections by Form, 2023 to 2033

Figure 108: Europe Market Value (US$ Million) Analysis by Source, 2018 to 2033

Figure 109: Europe Market Volume (Tons) Analysis by Source, 2018 to 2033

Figure 110: Europe Market Value Share (%) and BPS Analysis by Source, 2023 to 2033

Figure 111: Europe Market Y-o-Y Growth (%) Projections by Source, 2023 to 2033

Figure 112: Europe Market Value (US$ Million) Analysis by End use industry, 2018 to 2033

Figure 113: Europe Market Volume (Tons) Analysis by End use industry, 2018 to 2033

Figure 114: Europe Market Value Share (%) and BPS Analysis by End use industry, 2023 to 2033

Figure 115: Europe Market Y-o-Y Growth (%) Projections by End use industry, 2023 to 2033

Figure 116: Europe Market Attractiveness by Application, 2023 to 2033

Figure 117: Europe Market Attractiveness by Form, 2023 to 2033

Figure 118: Europe Market Attractiveness by Source, 2023 to 2033

Figure 119: Europe Market Attractiveness by End use industry, 2023 to 2033

Figure 120: Europe Market Attractiveness by Country, 2023 to 2033

Figure 121: East Asia Market Value (US$ Million) by Application, 2023 to 2033

Figure 122: East Asia Market Value (US$ Million) by Form, 2023 to 2033

Figure 123: East Asia Market Value (US$ Million) by Source, 2023 to 2033

Figure 124: East Asia Market Value (US$ Million) by End use industry, 2023 to 2033

Figure 125: East Asia Market Value (US$ Million) by Country, 2023 to 2033

Figure 126: East Asia Market Value (US$ Million) Analysis by Country, 2018 to 2033

Figure 127: East Asia Market Volume (Tons) Analysis by Country, 2018 to 2033

Figure 128: East Asia Market Value Share (%) and BPS Analysis by Country, 2023 to 2033

Figure 129: East Asia Market Y-o-Y Growth (%) Projections by Country, 2023 to 2033

Figure 130: East Asia Market Value (US$ Million) Analysis by Application, 2018 to 2033

Figure 131: East Asia Market Volume (Tons) Analysis by Application, 2018 to 2033

Figure 132: East Asia Market Value Share (%) and BPS Analysis by Application, 2023 to 2033

Figure 133: East Asia Market Y-o-Y Growth (%) Projections by Application, 2023 to 2033

Figure 134: East Asia Market Value (US$ Million) Analysis by Form, 2018 to 2033

Figure 135: East Asia Market Volume (Tons) Analysis by Form, 2018 to 2033

Figure 136: East Asia Market Value Share (%) and BPS Analysis by Form, 2023 to 2033

Figure 137: East Asia Market Y-o-Y Growth (%) Projections by Form, 2023 to 2033

Figure 138: East Asia Market Value (US$ Million) Analysis by Source, 2018 to 2033

Figure 139: East Asia Market Volume (Tons) Analysis by Source, 2018 to 2033

Figure 140: East Asia Market Value Share (%) and BPS Analysis by Source, 2023 to 2033

Figure 141: East Asia Market Y-o-Y Growth (%) Projections by Source, 2023 to 2033

Figure 142: East Asia Market Value (US$ Million) Analysis by End use industry, 2018 to 2033

Figure 143: East Asia Market Volume (Tons) Analysis by End use industry, 2018 to 2033

Figure 144: East Asia Market Value Share (%) and BPS Analysis by End use industry, 2023 to 2033

Figure 145: East Asia Market Y-o-Y Growth (%) Projections by End use industry, 2023 to 2033

Figure 146: East Asia Market Attractiveness by Application, 2023 to 2033

Figure 147: East Asia Market Attractiveness by Form, 2023 to 2033

Figure 148: East Asia Market Attractiveness by Source, 2023 to 2033

Figure 149: East Asia Market Attractiveness by End use industry, 2023 to 2033

Figure 150: East Asia Market Attractiveness by Country, 2023 to 2033

Figure 151: South Asia Market Value (US$ Million) by Application, 2023 to 2033

Figure 152: South Asia Market Value (US$ Million) by Form, 2023 to 2033

Figure 153: South Asia Market Value (US$ Million) by Source, 2023 to 2033

Figure 154: South Asia Market Value (US$ Million) by End use industry, 2023 to 2033

Figure 155: South Asia Market Value (US$ Million) by Country, 2023 to 2033

Figure 156: South Asia Market Value (US$ Million) Analysis by Country, 2018 to 2033

Figure 157: South Asia Market Volume (Tons) Analysis by Country, 2018 to 2033

Figure 158: South Asia Market Value Share (%) and BPS Analysis by Country, 2023 to 2033

Figure 159: South Asia Market Y-o-Y Growth (%) Projections by Country, 2023 to 2033

Figure 160: South Asia Market Value (US$ Million) Analysis by Application, 2018 to 2033

Figure 161: South Asia Market Volume (Tons) Analysis by Application, 2018 to 2033

Figure 162: South Asia Market Value Share (%) and BPS Analysis by Application, 2023 to 2033

Figure 163: South Asia Market Y-o-Y Growth (%) Projections by Application, 2023 to 2033

Figure 164: South Asia Market Value (US$ Million) Analysis by Form, 2018 to 2033

Figure 165: South Asia Market Volume (Tons) Analysis by Form, 2018 to 2033

Figure 166: South Asia Market Value Share (%) and BPS Analysis by Form, 2023 to 2033

Figure 167: South Asia Market Y-o-Y Growth (%) Projections by Form, 2023 to 2033

Figure 168: South Asia Market Value (US$ Million) Analysis by Source, 2018 to 2033

Figure 169: South Asia Market Volume (Tons) Analysis by Source, 2018 to 2033

Figure 170: South Asia Market Value Share (%) and BPS Analysis by Source, 2023 to 2033

Figure 171: South Asia Market Y-o-Y Growth (%) Projections by Source, 2023 to 2033

Figure 172: South Asia Market Value (US$ Million) Analysis by End use industry, 2018 to 2033

Figure 173: South Asia Market Volume (Tons) Analysis by End use industry, 2018 to 2033

Figure 174: South Asia Market Value Share (%) and BPS Analysis by End use industry, 2023 to 2033

Figure 175: South Asia Market Y-o-Y Growth (%) Projections by End use industry, 2023 to 2033

Figure 176: South Asia Market Attractiveness by Application, 2023 to 2033

Figure 177: South Asia Market Attractiveness by Form, 2023 to 2033

Figure 178: South Asia Market Attractiveness by Source, 2023 to 2033

Figure 179: South Asia Market Attractiveness by End use industry, 2023 to 2033

Figure 180: South Asia Market Attractiveness by Country, 2023 to 2033

Figure 181: Oceania Market Value (US$ Million) by Application, 2023 to 2033

Figure 182: Oceania Market Value (US$ Million) by Form, 2023 to 2033

Figure 183: Oceania Market Value (US$ Million) by Source, 2023 to 2033

Figure 184: Oceania Market Value (US$ Million) by End use industry, 2023 to 2033

Figure 185: Oceania Market Value (US$ Million) by Country, 2023 to 2033

Figure 186: Oceania Market Value (US$ Million) Analysis by Country, 2018 to 2033

Figure 187: Oceania Market Volume (Tons) Analysis by Country, 2018 to 2033

Figure 188: Oceania Market Value Share (%) and BPS Analysis by Country, 2023 to 2033

Figure 189: Oceania Market Y-o-Y Growth (%) Projections by Country, 2023 to 2033

Figure 190: Oceania Market Value (US$ Million) Analysis by Application, 2018 to 2033

Figure 191: Oceania Market Volume (Tons) Analysis by Application, 2018 to 2033

Figure 192: Oceania Market Value Share (%) and BPS Analysis by Application, 2023 to 2033

Figure 193: Oceania Market Y-o-Y Growth (%) Projections by Application, 2023 to 2033

Figure 194: Oceania Market Value (US$ Million) Analysis by Form, 2018 to 2033

Figure 195: Oceania Market Volume (Tons) Analysis by Form, 2018 to 2033

Figure 196: Oceania Market Value Share (%) and BPS Analysis by Form, 2023 to 2033

Figure 197: Oceania Market Y-o-Y Growth (%) Projections by Form, 2023 to 2033

Figure 198: Oceania Market Value (US$ Million) Analysis by Source, 2018 to 2033

Figure 199: Oceania Market Volume (Tons) Analysis by Source, 2018 to 2033

Figure 200: Oceania Market Value Share (%) and BPS Analysis by Source, 2023 to 2033

Figure 201: Oceania Market Y-o-Y Growth (%) Projections by Source, 2023 to 2033

Figure 202: Oceania Market Value (US$ Million) Analysis by End use industry, 2018 to 2033

Figure 203: Oceania Market Volume (Tons) Analysis by End use industry, 2018 to 2033

Figure 204: Oceania Market Value Share (%) and BPS Analysis by End use industry, 2023 to 2033

Figure 205: Oceania Market Y-o-Y Growth (%) Projections by End use industry, 2023 to 2033

Figure 206: Oceania Market Attractiveness by Application, 2023 to 2033

Figure 207: Oceania Market Attractiveness by Form, 2023 to 2033

Figure 208: Oceania Market Attractiveness by Source, 2023 to 2033

Figure 209: Oceania Market Attractiveness by End use industry, 2023 to 2033

Figure 210: Oceania Market Attractiveness by Country, 2023 to 2033

Figure 211: MEA Market Value (US$ Million) by Application, 2023 to 2033

Figure 212: MEA Market Value (US$ Million) by Form, 2023 to 2033

Figure 213: MEA Market Value (US$ Million) by Source, 2023 to 2033

Figure 214: MEA Market Value (US$ Million) by End use industry, 2023 to 2033

Figure 215: MEA Market Value (US$ Million) by Country, 2023 to 2033

Figure 216: MEA Market Value (US$ Million) Analysis by Country, 2018 to 2033

Figure 217: MEA Market Volume (Tons) Analysis by Country, 2018 to 2033

Figure 218: MEA Market Value Share (%) and BPS Analysis by Country, 2023 to 2033

Figure 219: MEA Market Y-o-Y Growth (%) Projections by Country, 2023 to 2033

Figure 220: MEA Market Value (US$ Million) Analysis by Application, 2018 to 2033

Figure 221: MEA Market Volume (Tons) Analysis by Application, 2018 to 2033

Figure 222: MEA Market Value Share (%) and BPS Analysis by Application, 2023 to 2033

Figure 223: MEA Market Y-o-Y Growth (%) Projections by Application, 2023 to 2033

Figure 224: MEA Market Value (US$ Million) Analysis by Form, 2018 to 2033

Figure 225: MEA Market Volume (Tons) Analysis by Form, 2018 to 2033

Figure 226: MEA Market Value Share (%) and BPS Analysis by Form, 2023 to 2033

Figure 227: MEA Market Y-o-Y Growth (%) Projections by Form, 2023 to 2033

Figure 228: MEA Market Value (US$ Million) Analysis by Source, 2018 to 2033

Figure 229: MEA Market Volume (Tons) Analysis by Source, 2018 to 2033

Figure 230: MEA Market Value Share (%) and BPS Analysis by Source, 2023 to 2033

Figure 231: MEA Market Y-o-Y Growth (%) Projections by Source, 2023 to 2033

Figure 232: MEA Market Value (US$ Million) Analysis by End use industry, 2018 to 2033

Figure 233: MEA Market Volume (Tons) Analysis by End use industry, 2018 to 2033

Figure 234: MEA Market Value Share (%) and BPS Analysis by End use industry, 2023 to 2033

Figure 235: MEA Market Y-o-Y Growth (%) Projections by End use industry, 2023 to 2033

Figure 236: MEA Market Attractiveness by Application, 2023 to 2033

Figure 237: MEA Market Attractiveness by Form, 2023 to 2033

Figure 238: MEA Market Attractiveness by Source, 2023 to 2033

Figure 239: MEA Market Attractiveness by End use industry, 2023 to 2033

Figure 240: MEA Market Attractiveness by Country, 2023 to 2033

Frequently Asked Questions

What was the market value for the glycine soja (soybean) seed extract market in 2023?

As of 2023, the glycine soja (soybean) seed extract market is expected to be valued at USD 2,253.30 million, as per FMI.

According to FMI, what is the anticipated market value for glycine soja (soybean) seed extract in 2033?

By 2033, the market value of glycine soja (soybean) seed extract is expected to reach USD 4,269.60 million.

What is the projected forecast CAGR for the glycine soja (soybean) seed extract market from 2023 to 2033?

From 2023 to 2033, glycine soja (soybean) seed extract sales are expected to flourish at a CAGR of 6.60%

Which segment dominates the glycine soja (soybean) seed extract market?

The skin care segment will account for a market share of 22.20% in 2023.

Which country is likely to be at the pinnacle of the market?

The United States is likely the top-performing market in glycine soja (soybean) seed extrac industry.

Explore Similar Insights

Future Market Insights

Glycine Soja (Soybean) Seed Extract Market