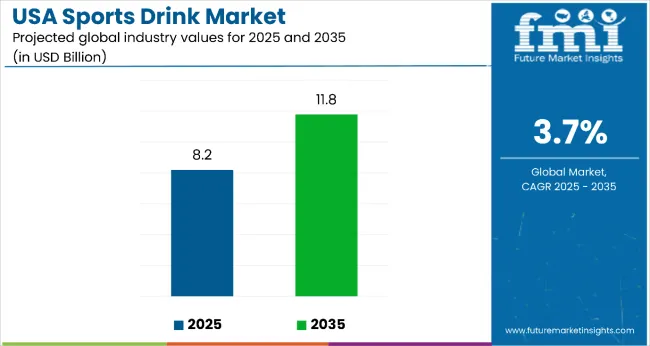
The USA sports drink market is estimated to be valued at USD 8.2 billion in 2025 and is projected to reach USD 11.8 billion by 2035, registering a CAGR of 3.7% over the forecast period. The market is expected to add an absolute dollar opportunity of USD 3.9 billion during this period, reflecting 1.44 times growth at a compound annual growth rate of 3.7%. Growth is anticipated to be driven by rising demand for functional beverages among health-conscious consumers, increasing sports participation, and the growing popularity of protein-infused sports drinks.
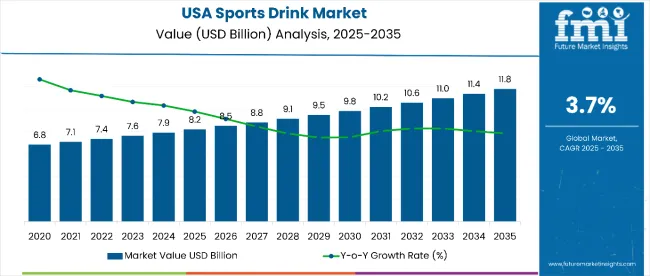
By 2030, the market is likely to reach approximately USD 9.8 billion, contributing USD 1.6 billion in incremental value during the first half of the decade. The remaining USD 2.3 billion is expected in the second half, suggesting a moderately back-loaded growth pattern. Product innovation focusing on natural ingredients, low-sugar formulations, and enhanced electrolyte content is gaining momentum due to heightened health awareness and increasing demand for clean-label products.
Companies such as PepsiCo (Gatorade) and the Coca-Cola Company (Powerade) are strengthening their competitive positions through investments in flavor innovation and targeted marketing campaigns. Celebrity endorsements and strategic partnerships with sports organizations are supporting expansion into mainstream consumer segments beyond traditional athletic users. Market performance is expected to remain anchored in product differentiation, distribution channel optimization, and sustained brand loyalty.
The USA sports drink market holds approximately 35.7% of the non-carbonated soft drink segment, driven by its effectiveness in hydration and electrolyte replenishment for active individuals. It accounts for around 20% of the functional beverage category, supported by its performance-enhancing attributes and appeal to fitness enthusiasts. The market contributes nearly 15% to the overall beverage industry, particularly within ready-to-drink functional products in retail channels. It holds close to 25% of the sports nutrition market, where sports drinks are consumed alongside other performance products. The share in the health and wellness beverage segment reaches about 30%, reflecting strong preference among consumers seeking active lifestyle products.
The market is undergoing structural changes driven by rising demand for healthier and more functional hydration solutions. Advanced formulations featuring natural ingredients, reduced sugar content, and enhanced electrolyte profiles have improved product appeal among health-conscious consumers. Manufacturers are introducing organic variants and clean-label products designed for broader consumer segments, extending their relevance beyond traditional athletic applications. Strategic collaborations between beverage companies and sports organizations are accelerating adoption across diverse consumer demographics. Online retail channels and direct-to-consumer models are expanding market reach, reshaping conventional distribution networks.
Sports drinks proven efficacy in hydration, electrolyte replenishment, and energy provision makes them an attractive choice for athletes and active individuals seeking performance enhancement.
Growing awareness of fitness and wellness among millennials and young adults is further propelling adoption, especially in urban areas with high gym membership rates and recreational sports participation. Government initiatives promoting youth sports participation, along with innovations in flavor profiles and functional ingredients, are also enhancing product appeal and market penetration.
As health consciousness increases and active lifestyles become more prevalent, sports drink consumption is expanding beyond traditional athletic use into everyday wellness applications. With consumers prioritizing hydration, energy support, and performance optimization, sports drinks are well-positioned to capture broader market segments across various demographic groups.
The market is segmented into product type, flavor, form, packaging material, and distribution channel. By product type, the market includes isotonic sports drinks, hypotonic sports drinks, and hypertonic sports drinks. By distribution channel, the market is bifurcated into offline (store-based retailing includes hypermarkets/supermarkets, convenience stores, mom and pop stores, discount stores, specialty stores, and independent small groceries) and online retail.
By flavor, the market is characterized into unflavored and flavored (citrus, berries, mocha, pomegranate, apple, mint, blends (mix), cola, watermelon, and others). By form, the market is divided into powdered and liquid. By packaging material, the market is segmented into metal, PET/plastic, and glass.
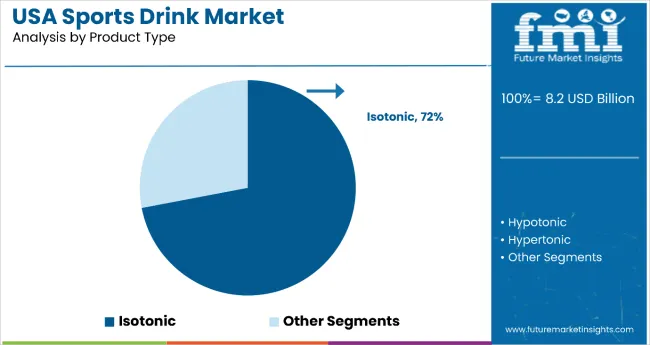
The isotonic sports drinks segment holds a dominant 72% share in the product category, reflecting its optimal balance of carbohydrates, electrolytes, and fluid content that closely matches human blood composition. Isotonic drinks are increasingly preferred for their rapid absorption and effectiveness in quickly replacing fluids lost during strenuous physical activities.
This segment benefits from strong endorsement by sports nutritionists and athletic organizations, reinforcing its performance credibility. These products deliver enhanced hydration while supplying essential carbohydrates for sustained energy, making them ideal for both professional athletes and recreational fitness enthusiasts.
Manufacturers are expanding isotonic product lines with improved flavor profiles and functional additives to cater to diverse consumer preferences while maintaining the core isotonic benefits. As sports science continues to validate the effectiveness of these formulations, this segment is expected to maintain its dominant position throughout the forecast period.
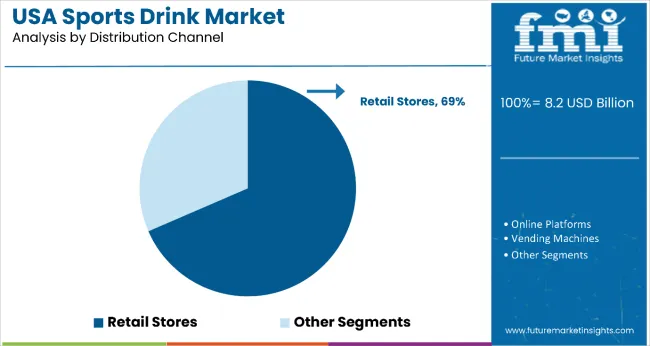
The retail store segment holds a dominant 69% share in the distribution channel category, supported by wide availability across supermarkets, convenience stores, and specialty outlets. This channel benefits from consumer preference for immediate purchase gratification and the ability to physically compare products in-store. Offline retail also leverages impulse buying, particularly in high-traffic areas near gyms, schools, and sports venues.
Manufacturers prioritize this segment through in-store activations, branded displays, and exclusive promotions with major retail chains. Strategic partnerships with big-box retailers ensure strong shelf visibility and frequent replenishment of fast-moving SKUs, especially isotonic variants.
The tactile and immediate access offered by offline retail makes it the preferred channel for repeat consumers. Despite the growth of online sales, offline retail is projected to maintain its leadership position over the forecast period.
From 2025 to 2035, sports drink manufacturers are implementing advanced marketing strategies targeting millennials and Gen Z consumers through social media campaigns, influencer partnerships, and experiential activations at fitness events. This strategic shift positions brands that deliver authentic wellness messaging and lifestyle integration as the primary beneficiaries of evolving consumer engagement patterns.
Rising Health Consciousness Drives USA Sports Drink Market Growth
The growing focus on fitness and overall wellness among American consumers remains the primary driver of market expansion. In 2024, rising gym memberships and increased participation in recreational sports accelerated the adoption of functional hydration products among active lifestyle enthusiasts. By 2025, health-conscious millennials, accounting for nearly 70% of fitness and sports participants, were driving demand for electrolyte-rich and performance-oriented beverages for pre- and post-workout hydration.
These trends indicate that consistent wellness adoption, rather than seasonal athletic events, is positioning sports drinks as an integral part of daily hydration routines. Manufacturers offering scientifically validated products with proven performance benefits are best positioned to capture sustained demand from health-driven consumers seeking credible hydration solutions.
Regulatory and Competitive Pressures Challenge Market Expansion
The market faces significant challenges from regulatory scrutiny on sugar content and artificial additives, which have resulted in reformulation costs and compliance obligations. Rising consumer advocacy for natural ingredients and transparent labeling adds further pressure on manufacturers to innovate responsibly while managing cost structures. Intense competition from functional beverages, flavored waters, and ready-to-drink protein drinks constrains category growth, compelling brands to diversify product portfolios and invest in premium hydration solutions to maintain relevance and consumer loyalty.
Celebrity Endorsement Integration Creates Market Opportunities
In 2024, sports drink brands broadened their reach by leveraging high-profile celebrity partnerships and influencer-driven campaigns, driving engagement beyond core athletic segments. By 2025, integrated endorsement strategies featuring social media influencers and professional athletes had become central to marketing initiatives, linking product functionality with aspirational lifestyles.
These developments demonstrate that celebrity-driven campaigns now extend beyond traditional promotion, shaping authentic brand narratives that resonate with younger demographics. Companies aligning product innovation with influencer-backed digital strategies are positioned to capture market share from traditional players while strengthening consumer trust and loyalty over the long term.
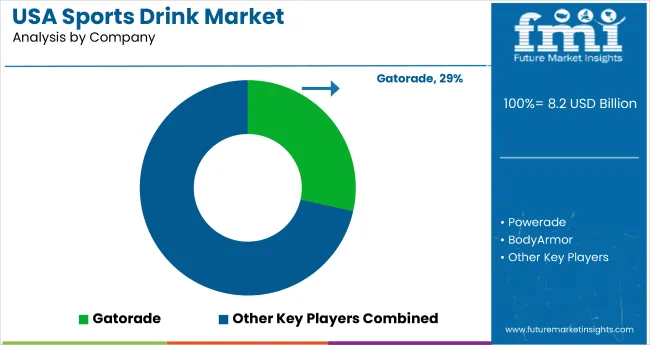
The USA sports drink market is moderately consolidated, led by Gatorade with a dominant 29% share, sustained through extensive athletic sponsorships, a broad flavor portfolio, and strong retail distribution across all channels.
Dominant player status is held by Gatorade, while key competitors include Powerade, BodyArmor, Monster Hydro, Aquarius, Melaleuca, Bulletproof FATwater, Honest Sport, Muscle Milk, Staminade, and Hammer Nutrition HEED. These players offer specialized hydration solutions with unique formulations, targeted marketing strategies, and tailored distribution approaches.
Powerade holds the second position with approximately 16% share, leveraging Coca-Cola’s distribution strength and competitive pricing. The brand emphasizes value positioning and demographic-specific marketing to counter Gatorade’s leadership.
Emerging brands such as BodyArmor, Prime Hydration, and Electrolit are gaining traction through celebrity endorsements, social media-driven campaigns, and premium product positioning targeting younger, health-conscious consumers seeking alternatives to conventional offerings.
Market growth is anchored in rising health awareness, increased sports participation, and lifestyle beverage consumption. Innovation centers on natural ingredients, reduced sugar content, and functional benefit enhancement to meet evolving consumer preferences.
Key Developments in USA Sports Drink Market
Gatorade revives its iconic "Is It In You?" campaign, targeting Gen Z athletes facing rising external pressures. With support from elite brand ambassadors, the campaign emphasizes inner drive amid modern distractions. New data reveals 53% of Gen Z athletes quit sports due to external factors, prompting Gatorade’s largest campaign yet.
In 2025, Monster Energy expanded its zero-sugar lineup and launched a new coffee series in the USA The brand shifted focus to the 355ml REIGN STORM, replacing the outdated 473ml REIGN. Despite underperformance, its alcoholic beverage line continues, with larger sizes and potential rebranding anticipated for 2026.
| Item | Value |
|---|---|
| Quantitative Units | USD 8.2 Billion |
| Product Type | Isotonic, Hypotonic, and Hypertonic |
| Flavor | Unflavored and Flavored (Citrus, Berries, Mocha, Pomegranate, Apple, Mint, Blends, Cola, Watermelon, Others) |
| Form | Liquid and Powdered |
| Packaging Material | Metal, PET/Plastic, and Glass |
| Distribution Channel | Offline Retail (Hypermarkets/Supermarkets, Convenience Stores, Specialty Stores) and Online Retail |
| Key Country | USA |
| Regions Covered | North America |
| Key Companies Profiled | Gatorade, Powerade, Body Armor, Monster Hydro, Aquarius, Melaleuca, Bulletproof FAT water, Honest Sport, Muscle Milk, Staminade, Hammer Nutrition HEED |
| Additional Attributes | Dollar sales by product type and distribution channel, consumer preference analysis for flavor profiles and packaging formats, competitive positioning assessment, innovation trends in natural ingredients and functional additives, regional consumption patterns across major metropolitan markets |
The USA sports drink market is estimated to be valued at USD 8.2 billion in 2025.
The market size for the USA sports drink market is projected to reach USD 11.8 billion by 2035.
The USA sports drink market is expected to grow at a 3.7% CAGR between 2025 and 2035.
The retail store segment with 69% market share will dominate the distribution channel segment in USA sports drink market.
In terms of product type, isotonic segment to command 72% share in the USA sports drink market in 2025.


Full Research Suite comprises of:
Market outlook & trends analysis
Interviews & case studies
Strategic recommendations
Vendor profiles & capabilities analysis
5-year forecasts
8 regions and 60+ country-level data splits
Market segment data splits
12 months of continuous data updates
DELIVERED AS:
PDF EXCEL ONLINE
Sports Wearables Market Size and Share Forecast Outlook 2025 to 2035
Sports Protective Equipment Market Size and Share Forecast Outlook 2025 to 2035
Sports Sunglasses Market Size and Share Forecast Outlook 2025 to 2035
Sports Turf Seed Market Size and Share Forecast Outlook 2025 to 2035
Sports Food Market Size and Share Forecast Outlook 2025 to 2035
Sports Bicycles Market Size and Share Forecast Outlook 2025 to 2035
Sports Nutrition Market Brief Outlook of Growth Drivers Impacting Consumption
Sports Analytics Market Growth - Trends & Forecast 2025 to 2035
Sports Bottle Market Trends & Industry Growth Forecast 2024-2034
Sports Inspired Clothing Market Analysis – Trends, Growth & Forecast 2025-2035
Sports Betting Market Size and Share Forecast Outlook 2025 to 2035
The Sports Medicine Market Is Segmented by Product, Application and End User from 2025 To 2035
Sports Streaming Platform Market Size and Share Forecast Outlook 2025 to 2035
Sports Officiating Technologies Market Size and Share Forecast Outlook 2025 to 2035
Sports Drug Testing Market Size and Share Forecast Outlook 2025 to 2035
Sports Nutrition Ingredients Market Size and Share Forecast Outlook 2025 to 2035
Sports and Athletic Insoles Market Analysis - Size, Share, and Forecast 2025 to 2035
Sports and Leisure Equipment Retailing Industry Analysis by Product Type, by Consumer Demographics, by Retail Channel, by Price Range, and by Region - Forecast for 2025 to 2035
Sports Nutrition Market Share Analysis – Trends, Growth & Forecast 2025-2035
A Detailed Global Analysis of Brand Share for Sports and Athletic Insoles Market

Thank you!
You will receive an email from our Business Development Manager. Please be sure to check your SPAM/JUNK folder too.
Chat With
MaRIA