The Sports Betting Market is estimated to be valued at USD 111.9 billion in 2025 and is projected to reach USD 298.1 billion by 2035, registering a compound annual growth rate (CAGR) of 10.3% over the forecast period.
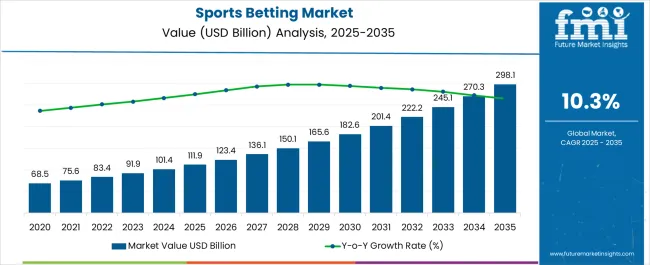
| Metric | Value |
|---|---|
| Sports Betting Market Estimated Value in (2025 E) | USD 111.9 billion |
| Sports Betting Market Forecast Value in (2035 F) | USD 298.1 billion |
| Forecast CAGR (2025 to 2035) | 10.3% |
The sports betting market is expanding steadily, supported by regulatory liberalization, technological innovation, and rising consumer participation in both traditional and digital channels. Increasing global acceptance of betting as a form of entertainment, combined with the integration of secure digital payment systems, is driving sustained adoption.
Growth is also being influenced by the proliferation of mobile applications, live streaming integration, and real time odds delivery, which enhance user engagement. Offline channels remain significant due to cultural preferences and trust associated with physical betting establishments, while online platforms are expected to gain momentum as digital transformation accelerates.
The outlook is positive as sports betting continues to converge with digital entertainment, offering enhanced personalization, broader accessibility, and deeper integration with mainstream sports events worldwide.
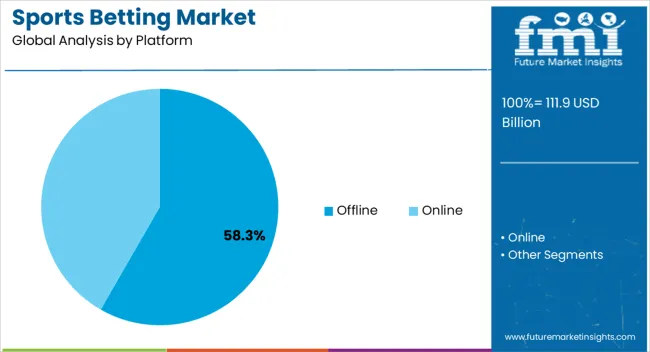
The offline platform segment is expected to hold 58.30% of total market revenue by 2025, making it the dominant platform category. Its leadership is attributed to consumer preference for in person betting experiences, higher trust in physical establishments, and established networks of bookmakers and betting shops.
Offline channels provide immediate cash transactions, social interaction, and perceived security, which remain strong motivators for traditional bettors. In regions where regulatory restrictions limit online betting, offline establishments continue to capture substantial market share.
As a result, the offline segment has maintained its prominence, reflecting its entrenched position in the global betting landscape.
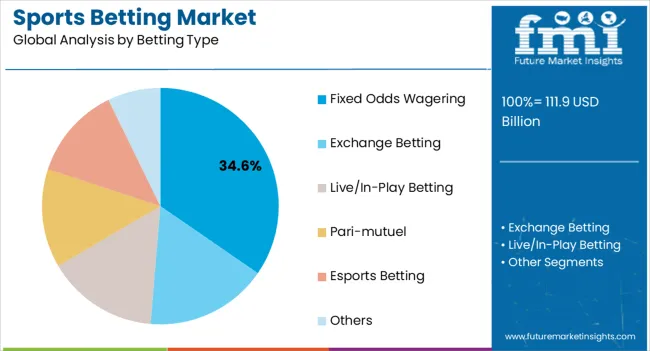
The fixed odds wagering segment is projected to account for 34.60% of overall revenue by 2025, positioning it as the leading betting type. Its dominance stems from the simplicity and transparency it offers, as players know the exact potential return at the time of placing the bet.
This format appeals to both casual and experienced bettors, as it minimizes uncertainty and enhances trust in the betting process. Fixed odds wagering also benefits from its broad acceptance across regulatory frameworks and its availability across multiple sports categories.
With increasing participation and straightforward user experience, this betting type continues to attract the largest share of betting activity.
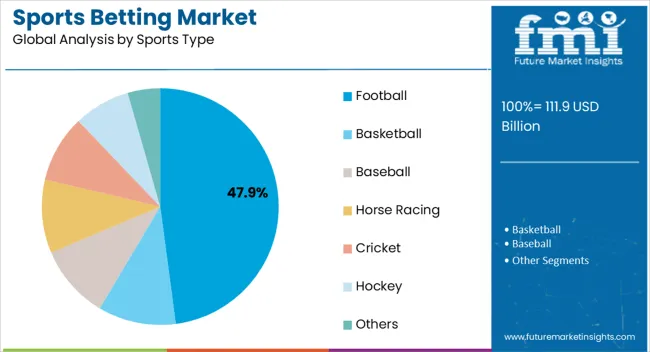
The football segment is projected to represent 47.90% of the market by 2025 within the sports type category, making it the most influential sports segment. This dominance is driven by football’s global fan base, frequent match schedules, and the high level of engagement associated with both domestic leagues and international tournaments.
Sponsorship agreements, media coverage, and live betting options have amplified participation levels, further cementing football’s position as the preferred sport for betting activities.
The cultural significance of football across continents, along with strong integration of betting platforms into fan experiences, has reinforced its leadership in the sports betting market.
The sports betting market growth is anticipated to be fueled by the expansion of sporting leagues and events. Further, a sports league or event is a gathering of teams, nations, associations, or individuals competing against one another in a match for a trophy or championship.
These leagues are scheduled to take place at specific times or during specific seasons, and all participating teams or individuals are required to do so to determine the league's overall champion which surges the adoption of sports betting resulting in positively influencing the sports betting market's future trends.
New professional sports leagues are starting up all over the world, giving customers the chance to diversify their wagering expenses. As a result, the sports betting market is expanding as a result of the expansion of sports leagues and events in the sports betting market.
One of the key factors driving the sports betting market growth is the global expansion of digital infrastructure. Additionally, the growing number of sports leagues and events around the world, as well as the surge in demand for sports betting among millennial and older people, are driving sports betting market growth along with sports betting market adoption trends.
Strict rules governing the game are predicted to impede the sports betting market expansion. During the forecast period, worries about illegal activity are expected to pose a challenge to the sports betting market opportunities as well as sports betting market trends and forecasts.
The growing impact of technologies such as blockchain, virtual reality, and AI, specifically machine learning tools are the sports betting market key trends. Moreover, the sports betting market is predicted to expand during the forecast period as a result of increased consumer demand for sports betting, which is being driven by technological advancements.
The leading sports betting market vendors are increasingly focusing a significant portion of their investments on machine learning tools and methods that have demonstrated promising results in prediction. Further, machine learning assists in the development of predictive algorithms and accurate predictive models for improved betting efficiency.
Consumers must develop useful strategies and make accurate predictions to increase their efficiency as the sports betting market evolves. New machine learning algorithms that attempt to predict the outcomes of games and races are expected to become familiar to sports bettors.
As a result, the rise of machine learning might be a boon to the global sports betting market during the forecast period.
The sports betting market is also influenced by the adoption of sports betting through video streaming and instant messaging services, as well as changes in the regulatory landscape of the sports betting market. Moreover, the sports betting market expansion of distribution channels, increase in purchasing power of middle-income groups, increase in product awareness and smart strategic marketing activities all have a positive impact on the sports betting market key trends and opportunities.
The use of 5G networks, as well as the use of AI and blockchain technologies is estimated to provide profitable sports betting market opportunities to participants during the forecast period.
In 2025, the fixed odds wagering segment held a sports betting market share of more than 25%, while the eSports betting segment is expected to secure a significant CAGR of 14.8% in the sports betting market during the forecast period.
Interactive games are gaining popularity among children. While a significant portion of the population participates in competitive matches for entertainment, income, and recreation, eSports competitions draw large audiences. Further, the sports betting market has begun to capitalize on the opportunity through eSports betting which in turn influences the sports betting market adoption trends.
The platform segment of the sports betting market was led by the online platform segment, which is expected to dominate the sports betting market by the end of the forecast period, with a CAGR of 13%.
The online sports betting market is a stable and a notably expanding sector of the global economy which might escalate the sports betting market key trends and opportunities on the whole.
The anticipated sports betting market growth can be attributed to the increasing global use of smartphones and the internet. Further, the global population's lifestyle has been influenced by technological advancement and digitalization.
Financial sports betting market growth, an improvement in living standards, and an increase in disposable income are all co-dependent factors affecting the sports betting market's future trends.
Football events generate the majority of revenue from all other types of sports in the sports betting market. Also, Football accounted for more than 20.2% of the sports betting market share in 2025 and is expected to grow in the future positively affecting the sports betting market adoption trends.
Following football, the horse racing segment accounted for the second-largest sports betting market share and is expected to thrive at a CAGR of 10.3% during the forecast period. Further, the basketball and baseball segments of the sports betting market are also expected to expand by close to 10%. Many different types of sports are expected to grow in popularity.
The increasing number and annual events of sports leagues such as the NFL, IPL, EFL, and others are factors contributing to the development of these segments constructively impacting the sports betting market opportunities as well as the sports betting market trends and forecasts.
The Asia Pacific region accounted for around 30.0% of revenue and is expected to maintain the high CAGR in the sports betting market.
The presence of a significant percentage of young population who also participate in various forms of sports is the most important factor contributing to the sports betting market development. Also, gambling is a popular trait among the people of China and India. Further, the sports betting market is expected to grow significantly as a result of such collective factors along with the sports betting market opportunities.
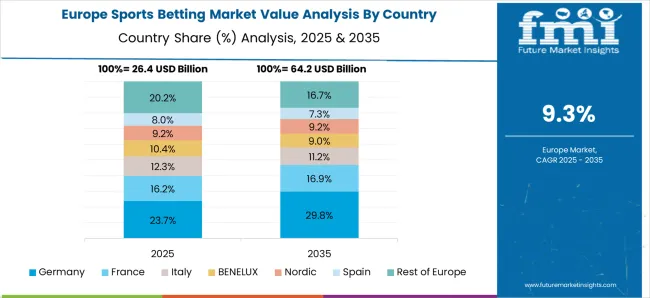
The Europe held a market share of 22.6% in 2025. The Europe region is expected to thrive at a CAGR of nearly 11.0%. Sports betting regulations in Europe are favorable to the population of Europe.
Online gambling increased significantly positively affecting the sports betting market adoption trends, since the pandemic restricted land-based gambling. The majority of firms extend into regulated sectors to earn a sustainable income, the industry derives a substantial amount of its earnings from the United Kingdom, Spain, Germany, and other nations in Europe.
Europe's sports betting business has grown significantly in recent years, because sports betting is mostly used in tournaments like the FIFA World Cup, Wimbledon, and European Championships.
Additionally, Tennis appeared to be one of Europe's leading betting sports in 2024 as a result of the 2024 Wimbledon Championship, although Wimbledon combined with the UEFA Euro Cup, indicating the increasing appeal of sports betting throughout the Europe region.
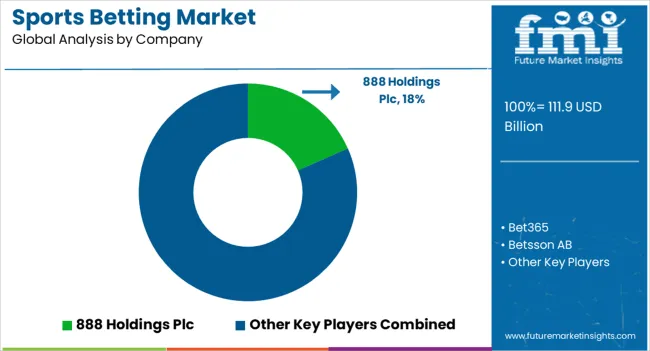
The leading sports betting market players focus on developing engaging websites and offering exclusive deals to gain a competitive advantage in the sports betting market. Additionally, companies are also focusing on integrating technology such as APIs to improve functionality and provide user-friendly interface.
Recent Developments:
LEGALISATION:
LAUNCH:
ACQUISITION:
PARTNERSHIP:
EXPANSION:
| Report Attribute | Details |
|---|---|
| Growth Rate | CAGR of 10.3% from 2025 to 2035 |
| Base Year for Estimation | 2025 |
| Historical Data | 2020 to 2025 |
| Forecast Period | 2025 to 2035 |
| Sports Betting Market Size (2025) | USD 91,940.9 million |
| Sports Betting Market Size (2035) | USD 245,792.4 million |
| Quantitative Units | Revenue in USD Million and CAGR from 2025 to 2035 |
| Report Coverage | Revenue Forecast, Volume Forecast, Company Ranking, Competitive Landscape, Growth Factors, Trends, and Pricing Analysis |
| Segments Covered | Platform, Betting Type, Sports Type, Region |
| Regions Covered | North America; Latin America; Western Europe; Eastern Europe; South Asia & Pacific; East Asia; The Middle East & Africa (MEA) |
| Key Countries Profiled | The United States, Canada, Brazil, Mexico, Germany, The United Kingdom, France, Spain, Italy, Poland, Russia, Czech Republic, Romania, India, Bangladesh, Australia, New Zealand, China, Japan, South Korea, GCC Countries, South Africa, Israel |
| Key Companies Profiled | 888 Holdings Plc; Bet365; Betsson AB; Churchill Downs Incorporated; Entain plc; Flutter Entertainment Plc; IGT; Kindred Group Plc; Sportech Plc; William Hill Plc |
| Customization | Available Upon Request |
The global sports betting market is estimated to be valued at USD 111.9 billion in 2025.
The market size for the sports betting market is projected to reach USD 298.1 billion by 2035.
The sports betting market is expected to grow at a 10.3% CAGR between 2025 and 2035.
The key product types in sports betting market are offline and online.
In terms of betting type, fixed odds wagering segment to command 34.6% share in the sports betting market in 2025.


Full Research Suite comprises of:
Market outlook & trends analysis
Interviews & case studies
Strategic recommendations
Vendor profiles & capabilities analysis
5-year forecasts
8 regions and 60+ country-level data splits
Market segment data splits
12 months of continuous data updates
DELIVERED AS:
PDF EXCEL ONLINE
Sports Wearables Market Size and Share Forecast Outlook 2025 to 2035
Sports Protective Equipment Market Size and Share Forecast Outlook 2025 to 2035
Sports Sunglasses Market Size and Share Forecast Outlook 2025 to 2035
Sports Turf Seed Market Size and Share Forecast Outlook 2025 to 2035
Sports Nutrition Ingredients Market Size and Share Forecast Outlook 2025 to 2035
Sports Food Market Size and Share Forecast Outlook 2025 to 2035
Sports Bicycles Market Size and Share Forecast Outlook 2025 to 2035
Sports Drink Industry Analysis in USA - Size and Share Forecast Outlook 2025 to 2035
Sports Officiating Technologies Market Size and Share Forecast Outlook 2025 to 2035
Sports Drug Testing Market Size and Share Forecast Outlook 2025 to 2035
Sports Streaming Platform Market Size and Share Forecast Outlook 2025 to 2035
Sports Drink Market Analysis - Size, Share, and Forecast Outlook 2025 to 2035
The Sports Medicine Market Is Segmented by Product, Application and End User from 2025 To 2035
Sports Nutrition Market Brief Outlook of Growth Drivers Impacting Consumption
Sports Analytics Market Growth - Trends & Forecast 2025 to 2035
Sports Nutrition Market Share Analysis – Trends, Growth & Forecast 2025-2035
Sports Inspired Clothing Market Analysis – Trends, Growth & Forecast 2025-2035
Sports and Leisure Equipment Retailing Industry Analysis by Product Type, by Consumer Demographics, by Retail Channel, by Price Range, and by Region - Forecast for 2025 to 2035
Sports and Athletic Insoles Market Analysis - Size, Share, and Forecast 2025 to 2035
A Detailed Global Analysis of Brand Share for Sports and Athletic Insoles Market

Thank you!
You will receive an email from our Business Development Manager. Please be sure to check your SPAM/JUNK folder too.
Chat With
MaRIA