Reports

- Global Locations -

Headquarters

Future Market Insights, Inc.

Christiana Corporate, 200
Continental Drive, Suite 401,
Newark, Delaware - 19713,
United States

T: +1-845-579-5705

Americas

Future Market Insights, Inc.

616 Corporate Way, Suite 2-9018,
Valley Cottage, NY 10989, United States

T: +1-347-918-3531

MEA

Future Market Insights

1602-6 Jumeirah Bay X2 Tower, Plot No: JLT-PH2-X2A,
Jumeirah Lakes Towers, Dubai,
United Arab Emirates

Europe

Future Market Insights

3rd Floor, 207 Regent Street,
W1B 3HH London
United Kingdom

T: + 44 (0) 20 8123 9659
D: +44 (0) 20 3287 4268

Asia Pacific

Future Market Insights

IndiaLand Global Tech Park, Unit UG-1, Behind Grand HighStreet, Phase 1, Hinjawadi, MH, Pune – 411057, India

Last-Mile Delivery Software Market Outlook (2022 to 2032)

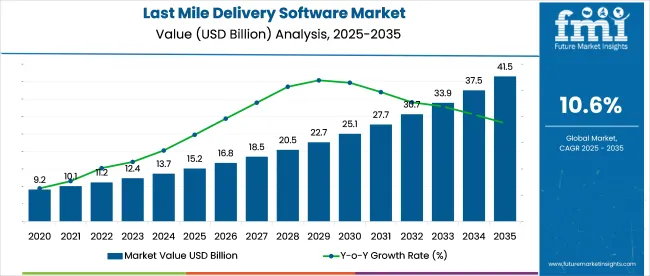
The global Last-Mile Delivery Software Market was valued at around US $ 7 Billion in 2021. With a projected CAGR of 8.1% for the next ten years, the market is likely to reach a valuation of approximately US $ 16.7 Billion by the end of 2032.

Attributes Details
Global Last-Mile Delivery Software Market Size (2021A) US $ 7 Billion
Global Estimated Market Value (2022E) US $ 7.6 Billion
Global Forecasted Market Value (2032) US $ 16.7 Billion
Global Market Growth Rate (2022 to 2032) 8.1% CAGR
United States Forecasted Market Value (2032) US $ 6 Billion
United States Growth Rate (2022 to 2032) 7.9 % CAGR
Key Companies Profiled
  • Oracle
  • Kahuna
  • DESCARTES
  • FarEye
  • Track-POD
  • LogiNext
  • Zippykind
  • Gloat
  • Skillnet

Future Market Insights’ analysis reveals that a large proportion of the market revenue is grossed from Couriers, Express, and Parcels, which is expected to account for a forecasted CAGR of 7.7% by 2032. On-Premise Last-Mile Delivery Management Software is the top type of these tests, with a CAGR of 7.9% in the forecast period. Owing to its characteristics of optimization of costs and maximizing customer satisfaction, the market is expected to grow at a CAGR of 8.1% in the 2022 to 2032 period.

Last-Mile Delivery is a crucial part of the supply chain that can comprise between 23% and 53% of delivery costs. According to a survey, the pool of impatient consumers has been growing, of whom nearly 44% are willing to wait only two days for their order. A 2020 report by the World Economic Forum estimates a 78% increase in last-mile deliveries in urban areas by 2030. To meet this, last-mile delivery software is essential, which provides visibility and a degree of control.

Don't pay for what you don't need

Customize your report by selecting specific countries or regions and save 30%!

Why are enterprises choosing to automate their Last-Mile Delivery Operations?

Enterprises are seeking software that manages Last-Mile delivery to improve efficiency, delivery times, profits, and visibility. The automation of systems is necessary to reduce costs, decrease human time spent and optimize operations. Routing, which is often the most complicated part of Last-Mile delivery, can be optimized by software that will consider traffic, drivers, delivery preferences, consumer types, logistical limitations, and other factors to come up with the most efficient routes possible. The software can also notify customers of the status of their orders, reducing the load on support teams and reducing repetitive calls. Finally, this software can help with driver invoicing. The Last Mile is more often than not extremely labor intensive and the automation of the invoicing process using data collected at each step can ensure efficient and accurate reimbursement and distribution of resources to the drivers.

How new technologies have been shaping the Last-Mile delivery market?

There have been a large number of technological advancements in the Last-Mile Delivery Software Market, which has led to a swell in demand. In the forthcoming years, technology such as ADV or autonomous delivery vehicles is expected to change the supply scenario completely.

The real-time mapping of routes is another benefit offered by the last-mile delivery software market, as they have the ability to plan around roadblocks and obstacles with actual data in order to provide an accurate ETA to a customer. Radio Frequency Identification (RFID) can help enterprises in keeping track of assets and manage inventory efficiently. Furthermore, enterprises can leverage the benefits of advanced analytics, using historical data to automatically generate key points and identify critical errors in the system.

Route optimization is vital as it not only maximizes consumer satisfaction but also minimizes the costs of labor and fuel. The option of being able to record proof of delivery helps organizations ensure that immediate action can be taken whenever necessary in the case of fraudulent claims by consumers or in the case of packages going missing. The increased visibility and improved availability of data when this software is used mean that enterprises can use smart techniques to analyze data like customer feedback, distance per parcel, times when delivery is delayed, etc. to efficiently manage their resources.

The usage of a data science system allows for the making of more informed decisions. The software can also help in the batching of SKUs in order to optimize the frequency of delivery and the time spent by a single driver on the road. Predictive Intelligence and Machine Learning can help in providing accurate ETAs to consumers. The use of this type of advanced software also allows for the option of flexible and customizable deliveries, thus improving the overall consumer experience.

Sudip Saha
Sudip Saha

Principal Consultant

Talk to Analyst

Find your sweet spots for generating winning opportunities in this market.

Region-Wise Insights

How is the Asia-Pacific Region an emerging market for demand?

The Asia Pacific region is an emerging market for Final-Mile Routing Software, accounting for 22.2% of the market with a forecasted market size of US$ 3.7 Billion at a CAGR of 9.1%.

The new Retail approach, an emerging trend in China involves integration between online and offline retail through varied steps, one being the establishment of pickup points for their last-mile strategy. This is expected to boost demand for the last-mile delivery software market in the region, as the requirements of this form of retail are highly complex.

Country-wise Insights

Why is the United States the largest contributor to demand for Last-Mile Delivery Software?

The United States is the leading market for Final-Mile Delivery Software demand, having witnessed a CAGR of 8.7% from 2015 to 2021. The market is expected to grow in the future as well, with a forecasted market value of US $ 6 Billion. The market in the USA accounts for an absolute dollar opportunity of US$ 3.2 Billion. According to a survey of American consumers, over 40% consider fast and reliable delivery to be a top concern while shopping, with half of them willing to wait for only two days for delivery. As key players like Amazon prioritize improvements in their shipping for growth, the consumer expectation of prompt delivery is expected to continue. Harnessing the benefits of software and automated systems is necessary to meet this demand.

Get the data you need at a Fraction of the cost

Personalize your report by choosing insights you need
and save 40%!

Category-wise Insights

Why is the on-premise deployment type the key contributor to demand?

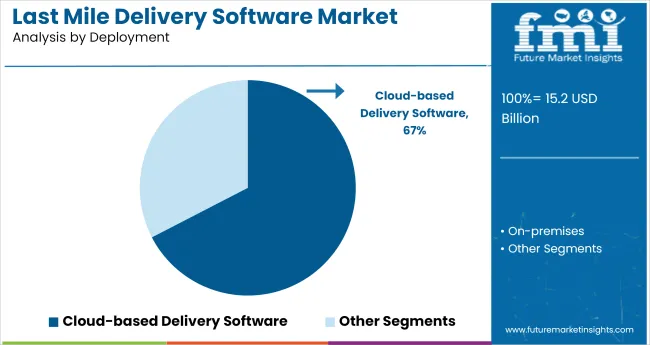
On-Premise is the top type of Last-Mile Delivery Software, having witnessed a CAGR of 8.9% with a forecasted CAGR of 7.9%. Cloud-based software, however, is an emerging trend that is gradually gaining popularity. Cloud-based software allows for more agility, is easy to install, and allows much greater flexibility. They also provide ease of scale since scaling to new areas requires minimal installation efforts on part of the enterprise.

Competitive Landscape

Last-Mile Delivery Software providers are focused on harnessing new technology and addressing efficient deliveries and allocation of drivers. The key Last-Mile Delivery Software Companies operating in the market include Kahuna, AGDESCARTES, FarEye, Track-POD, LogiNext, Zippykind5, Gloat, and Skillnet.

Some of the recent development in Last-Mile Delivery Software are as follows:

  • In June 2022, Onfleet announced the raising of US$ 23 Million in Series B funding, bringing their total funding amount to US$ 40 Million. According to the company, the amount raised will be used for product development and other enhancements.
  • In June 2022, California’s Last-Mile EV manufacturer BrightDrop announced the integration of the AI fleet optimization software of Marain, which can analyze, forecast and come up with multimodal fleet solutions into its Zevo vans and Trace e-carts.
  • In June 2022, SkyDrop announced the completion of production of the drone fleet for the commercial drone delivery trial with Dominoes in New Zealand.
  • In June 2022, FarEye and Spryker announced a partnership through which they aim to combine Fareye’s delivery platform that leverages data for routing and planning with Spryker’s e-commerce operating system.
  • In July 2022, Waitr Holdings Inc. announced a partnership with Elite EXTRA for Elite EXTRA’s last-mile delivery logistics software solutions
  • In July 2022, Lyve Global, which provides cloud-based delivery software via platforms and services, announced the acquisition of Jeebly, a last-mile delivery company
  • In July 2022, GEODIS announced the acquisition of Keppel Logistics.

Similarly, recent developments related to companies manufacturing Last-Mile Delivery Software have been tracked by the team at Future Market Insights, which is available in the full report.

Key Segments Covered in Last-Mile Delivery Software Survey

By Type:

  • On-Premise
  • Cloud-Based

By Application:

  • Courier, Express & Parcel
  • Retail & FMCG
  • Transportation
  • BFSI
  • E-Commerce
  • Manufacturing
  • Pharmaceutical

By Region:

  • North America
  • Latin America
  • Europe
  • Asia Pacific
  • Middle East & Africa

Frequently Asked Questions

How much is the global Last-Mile Delivery Software Market currently worth?

The global Last-Mile Delivery Software market was valued at USA $ 7 Billion in 2021.

What is the Last-Mile Delivery Software market Forecast through 2032?

The Last-Mile Delivery Software industry is set to witness a growth rate of 8.1% over the forecast period and be valued at US$ 16.7 Billion by 2032.

At what rate did demand for Last-Mile Delivery Software increase over the past years?

The Last-Mile Delivery Software market expanded by 9.1% from 2015 through 2021.

Who are the key players shaping the Last-Mile Delivery Software Industry?

Kahuna, AGDESCARTES, FarEye, Track-POD, LogiNext, Zippykind5, Gloat, and Skillnet are some of the key players operating in the Last-Mile Delivery Software Market.

Which type of Last-Mile Delivery Software is driving market demand?

On-Premise Last-Mile Delivery Software is driving Market demand, having witnessed a CAGR of 8.9% from 2015 to 2021.

Which are the top 5 countries driving the highest sales of Last-Mile Delivery Software?

The USA, UK, China, Japan, and South Korea are expected to be the key drivers of sales.

What is the USA market outlook for Last-Mile Delivery Software?

The USA accounts for over 35% of the global Last-Mile Delivery Software Market.

Table of Content

1. Executive Summary | Last-Mile Delivery Software Market

    1.1. Global Market Outlook

    1.2. Summary of Statistics

    1.3. Key Market Characteristics & Attributes

    1.4. Analysis and Recommendations

2. Market Overview

    2.1. Market Coverage / Taxonomy

    2.2. Market Definition / Scope / Limitations

3. Market Risks and Trends Assessment

    3.1. Risk Assessment

        3.1.1. COVID-19 Crisis and Impact on Demand

        3.1.2. COVID-19 Impact Benchmark with Previous Crisis

        3.1.3. Impact on Market Value (US$ Million)

        3.1.4. Assessment by Key Countries

        3.1.5. Assessment by Key Market Segments

        3.1.6. Action Points and Recommendation for Suppliers

    3.2. Key Trends Impacting the Market

    3.3. Formulation and Application Development Trends

4. Market Background and Foundation Data Points

    4.1. Global Market (US$ Million)

    4.2. Market Opportunity Assessment (US$ Million)

        4.2.1. Total Available Market

        4.2.2. Serviceable Addressable Market

        4.2.3. Serviceable Obtainable Market

    4.3. Market Scenario Forecast

        4.3.1. Demand in Optimistic Scenario

        4.3.2. Demand in Likely Scenario

        4.3.3. Demand in Conservative Scenario

    4.4. Investment Feasibility Analysis

        4.4.1. Investment in Established Markets

            4.4.1.1. In Short Term

            4.4.1.2. In Long Term

        4.4.2. Investment in Emerging Markets

            4.4.2.1. In Short Term

            4.4.2.2. In Long Term

    4.5. Forecast Factors - Relevance & Impact

        4.5.1. Top Companies Historical Growth

        4.5.2. Global Market Growth

        4.5.3. Adoption Rate, By Country

    4.6. Market Dynamics

        4.6.1. Market Driving Factors and Impact Assessment

        4.6.2. Prominent Market Challenges and Impact Assessment

        4.6.3. Market Opportunities

        4.6.4. Prominent Trends in the Global Market & Their Impact Assessment

5. Key Success Factors

    5.1. Manufacturers’ Focus on Low Penetration High Growth Markets

    5.2. Banking on with Segments High Incremental Opportunity

    5.3. Peer Benchmarking

6. Global Market Demand Analysis 2015 to 2021 and Forecast, 2022 to 2032

    6.1. Historical Market Analysis, 2015 to 2021

    6.2. Current and Future Market Projections, 2022 to 2032

    6.3. Y-o-Y Growth Trend Analysis

7. Global Market Value Analysis 2015 to 2021 and Forecast, 2022 to 2032

    7.1. Historical Market Value (US$ Million) Analysis, 2015 to 2021

    7.2. Current and Future Market Value (US$ Million) Projections, 2022 to 2032

        7.2.1. Y-o-Y Growth Trend Analysis

        7.2.2. Absolute Opportunity Analysis

8. Global Market Analysis 2015 to 2021 and Forecast 2022 to 2032, By Application

    8.1. Introduction / Key Findings

    8.2. Historical Market Size (US$ Million) Analysis By Application, 2015 to 2021

    8.3. Current and Future Market Size (US$ Million) Analysis and Forecast By Application, 2022 to 2032

        8.3.1. Courier, Express & Parcel

        8.3.2. Retail & FMCG

        8.3.3. Transportation

        8.3.4. BFSI

        8.3.5. E-Commerce

        8.3.6. Manufacturing

        8.3.7. Pharmaceutical

    8.4. Market Attractiveness Analysis By Application

9. Global Market Analysis 2015 to 2021 and Forecast 2022 to 2032, By Type

    9.1. Introduction / Key Findings

    9.2. Historical Market Size (US$ Million) Analysis By Type, 2015 to 2021

    9.3. Current and Future Market Size (US$ Million) Analysis and Forecast By Type, 2022 to 2032

        9.3.1. On Premises

        9.3.2. Cloud-based

    9.4. Market Attractiveness Analysis By Type

10. Global Market Analysis 2015 to 2021 and Forecast 2022 to 2032, By Region

    10.1. Introduction

    10.2. Historical Market Size (US$ Million) Analysis By Region, 2015 to 2021

    10.3. Current Market Size (US$ Million) & Analysis and Forecast By Region, 2022 to 2032

        10.3.1. North America

        10.3.2. Latin America

        10.3.3. Europe

        10.3.4. Asia Pacific

        10.3.5. Middle East and Africa (MEA)

    10.4. Market Attractiveness Analysis By Region

11. North America Market Analysis 2015 to 2021 and Forecast 2022 to 2032

    11.1. Introduction

    11.2. Pricing Analysis

    11.3. Historical Market Value (US$ Million) Trend Analysis By Market Taxonomy, 2015 to 2021

    11.4. Market Value (US$ Million) & Forecast By Market Taxonomy, 2022 to 2032

        11.4.1. By Country

            11.4.1.1. United States of America

            11.4.1.2. Canada

            11.4.1.3. Rest of North America

        11.4.2. By Application

        11.4.3. By Type

    11.5. Market Attractiveness Analysis

        11.5.1. By Country

        11.5.2. By Application

        11.5.3. By Type

12. Latin America Market Analysis 2015 to 2021 and Forecast 2022 to 2032

    12.1. Introduction

    12.2. Pricing Analysis

    12.3. Historical Market Value (US$ Million) Trend Analysis By Market Taxonomy, 2015 to 2021

    12.4. Market Value (US$ Million) & Forecast By Market Taxonomy, 2022 to 2032

        12.4.1. By Country

            12.4.1.1. Brazil

            12.4.1.2. Mexico

            12.4.1.3. Rest of Latin America

        12.4.2. By Application

        12.4.3. By Type

    12.5. Market Attractiveness Analysis

        12.5.1. By Country

        12.5.2. By Application

        12.5.3. By Type

13. Europe Market Analysis 2015 to 2021 and Forecast 2022 to 2032

    13.1. Introduction

    13.2. Pricing Analysis

    13.3. Historical Market Value (US$ Million) Trend Analysis By Market Taxonomy, 2015 to 2021

    13.4. Market Value (US$ Million) & Forecast By Market Taxonomy, 2022 to 2032

        13.4.1. By Country

            13.4.1.1. Germany

            13.4.1.2. France

            13.4.1.3. United Kingdom

            13.4.1.4. Italy

            13.4.1.5. Benelux

            13.4.1.6. Nordic Countries

            13.4.1.7. Rest of Europe

        13.4.2. By Application

        13.4.3. By Type

    13.5. Market Attractiveness Analysis

        13.5.1. By Country

        13.5.2. By Application

        13.5.3. By Type

14. Asia Pacific Market Analysis 2015 to 2021 and Forecast 2022 to 2032

    14.1. Introduction

    14.2. Pricing Analysis

    14.3. Historical Market Value (US$ Million) Trend Analysis By Market Taxonomy, 2015 to 2021

    14.4. Market Value (US$ Million) & Forecast By Market Taxonomy, 2022 to 2032

        14.4.1. By Country

            14.4.1.1. China

            14.4.1.2. Japan

            14.4.1.3. South Korea

            14.4.1.4. Rest of Asia Pacific

        14.4.2. By Application

        14.4.3. By Type

    14.5. Market Attractiveness Analysis

        14.5.1. By Country

        14.5.2. By Application

        14.5.3. By Type

15. Middle East and Africa Market Analysis 2015 to 2021 and Forecast 2022 to 2032

    15.1. Introduction

    15.2. Pricing Analysis

    15.3. Historical Market Value (US$ Million) Trend Analysis By Market Taxonomy, 2015 to 2021

    15.4. Market Value (US$ Million) & Forecast By Market Taxonomy, 2022 to 2032

        15.4.1. By Country

            15.4.1.1. GCC Countries

            15.4.1.2. South Africa

            15.4.1.3. Turkey

            15.4.1.4. Rest of Middle East and Africa

        15.4.2. By Application

        15.4.3. By Type

    15.5. Market Attractiveness Analysis

        15.5.1. By Country

        15.5.2. By Application

        15.5.3. By Type

16. Key Countries Market Analysis 2015 to 2021 and Forecast 2022 to 2032

    16.1. Introduction

        16.1.1. Market Value Proportion Analysis, By Key Countries

        16.1.2. Global Vs. Country Growth Comparison

    16.2. US Market Analysis

        16.2.1. Value Proportion Analysis by Market Taxonomy

        16.2.2. Value & Analysis and Forecast by Market Taxonomy, 2015 to 2032

            16.2.2.1. By Application

            16.2.2.2. By Type

    16.3. Canada Market Analysis

        16.3.1. Value Proportion Analysis by Market Taxonomy

        16.3.2. Value & Analysis and Forecast by Market Taxonomy, 2015 to 2032

            16.3.2.1. By Application

            16.3.2.2. By Type

    16.4. Mexico Market Analysis

        16.4.1. Value Proportion Analysis by Market Taxonomy

        16.4.2. Value & Analysis and Forecast by Market Taxonomy, 2015 to 2032

            16.4.2.1. By Application

            16.4.2.2. By Type

    16.5. Brazil Market Analysis

        16.5.1. Value Proportion Analysis by Market Taxonomy

        16.5.2. Value & Analysis and Forecast by Market Taxonomy, 2015 to 2032

            16.5.2.1. By Application

            16.5.2.2. By Type

    16.6. Germany Market Analysis

        16.6.1. Value Proportion Analysis by Market Taxonomy

        16.6.2. Value & Analysis and Forecast by Market Taxonomy, 2015 to 2032

            16.6.2.1. By Application

            16.6.2.2. By Type

    16.7. France Market Analysis

        16.7.1. Value Proportion Analysis by Market Taxonomy

        16.7.2. Value & Analysis and Forecast by Market Taxonomy, 2015 to 2032

            16.7.2.1. By Application

            16.7.2.2. By Type

    16.8. Italy Market Analysis

        16.8.1. Value Proportion Analysis by Market Taxonomy

        16.8.2. Value & Analysis and Forecast by Market Taxonomy, 2015 to 2032

            16.8.2.1. By Application

            16.8.2.2. By Type

    16.9. BENELUX Market Analysis

        16.9.1. Value Proportion Analysis by Market Taxonomy

        16.9.2. Value & Analysis and Forecast by Market Taxonomy, 2015 to 2032

            16.9.2.1. By Application

            16.9.2.2. By Type

    16.10. UK Market Analysis

        16.10.1. Value Proportion Analysis by Market Taxonomy

        16.10.2. Value & Analysis and Forecast by Market Taxonomy, 2015 to 2032

            16.10.2.1. By Application

            16.10.2.2. By Type

    16.11. Nordic Countries Market Analysis

        16.11.1. Value Proportion Analysis by Market Taxonomy

        16.11.2. Value & Analysis and Forecast by Market Taxonomy, 2015 to 2032

            16.11.2.1. By Application

            16.11.2.2. By Type

    16.12. China Market Analysis

        16.12.1. Value Proportion Analysis by Market Taxonomy

        16.12.2. Value & Analysis and Forecast by Market Taxonomy, 2015 to 2032

            16.12.2.1. By Application

            16.12.2.2. By Type

    16.13. Japan Market Analysis

        16.13.1. Value Proportion Analysis by Market Taxonomy

        16.13.2. Value & Analysis and Forecast by Market Taxonomy, 2015 to 2032

            16.13.2.1. By Application

            16.13.2.2. By Type

    16.14. South Korea Market Analysis

        16.14.1. Value Proportion Analysis by Market Taxonomy

        16.14.2. Value & Analysis and Forecast by Market Taxonomy, 2015 to 2032

            16.14.2.1. By Application

            16.14.2.2. By Type

    16.15. GCC Countries Market Analysis

        16.15.1. Value Proportion Analysis by Market Taxonomy

        16.15.2. Value & Analysis and Forecast by Market Taxonomy, 2015 to 2032

            16.15.2.1. By Application

            16.15.2.2. By Type

    16.16. South Africa Market Analysis

        16.16.1. Value Proportion Analysis by Market Taxonomy

        16.16.2. Value & Analysis and Forecast by Market Taxonomy, 2015 to 2032

            16.16.2.1. By Application

            16.16.2.2. By Type

    16.17. Turkey Market Analysis

        16.17.1. Value Proportion Analysis by Market Taxonomy

        16.17.2. Value & Analysis and Forecast by Market Taxonomy, 2015 to 2032

            16.17.2.1. By Application

            16.17.2.2. By Type

        16.17.3. Competition Landscape and Player Concentration in the Country

17. Market Structure Analysis

    17.1. Market Analysis by Tier of Companies

    17.2. Market Concentration

    17.3. Market Share Analysis of Top Players

    17.4. Market Presence Analysis

        17.4.1. By Regional Footprint of Players

        17.4.2. Application Footprint by Players

18. Competition Analysis

    18.1. Competition Dashboard

    18.2. Competition Benchmarking

    18.3. Competition Deep Dive

        18.3.1. DESCARTES

            18.3.1.1. Overview

            18.3.1.2. Application Portfolio

            18.3.1.3. Sales Footprint

            18.3.1.4. Strategy Overview

        18.3.2. FarEye

            18.3.2.1. Overview

            18.3.2.2. Application Portfolio

            18.3.2.3. Sales Footprint

            18.3.2.4. Strategy Overview

        18.3.3. Track-POD

            18.3.3.1. Overview

            18.3.3.2. Application Portfolio

            18.3.3.3. Sales Footprint

            18.3.3.4. Strategy Overview

        18.3.4. LogiNext

            18.3.4.1. Overview

            18.3.4.2. Application Portfolio

            18.3.4.3. Sales Footprint

            18.3.4.4. Strategy Overview

        18.3.5. Zippykind

            18.3.5.1. Overview

            18.3.5.2. Application Portfolio

            18.3.5.3. Sales Footprint

            18.3.5.4. Strategy Overview

        18.3.6. CubeXie Software

            18.3.6.1. Overview

            18.3.6.2. Application Portfolio

            18.3.6.3. Sales Footprint

            18.3.6.4. Strategy Overview

        18.3.7. Oracle

            18.3.7.1. Overview

            18.3.7.2. Application Portfolio

            18.3.7.3. Sales Footprint

            18.3.7.4. Strategy Overview

        18.3.8. Hippo Solutions

            18.3.8.1. Overview

            18.3.8.2. Application Portfolio

            18.3.8.3. Sales Footprint

            18.3.8.4. Strategy Overview

        18.3.9. ManageTeamz

            18.3.9.1. Overview

            18.3.9.2. Application Portfolio

            18.3.9.3. Sales Footprint

            18.3.9.4. Strategy Overview

        18.3.10. Kiva Logic

            18.3.10.1. Overview

            18.3.10.2. Application Portfolio

            18.3.10.3. Sales Footprint

            18.3.10.4. Strategy Overview

        18.3.11. Livedspatcher

            18.3.11.1. Overview

            18.3.11.2. Application Portfolio

            18.3.11.3. Sales Footprint

            18.3.11.4. Strategy Overview

        18.3.12. Wing

            18.3.12.1. Overview

            18.3.12.2. Application Portfolio

            18.3.12.3. Sales Footprint

            18.3.12.4. Strategy Overview

        18.3.13. Tracify

            18.3.13.1. Overview

            18.3.13.2. Application Portfolio

            18.3.13.3. Sales Footprint

            18.3.13.4. Strategy Overview

        18.3.14. Roadwarrior

            18.3.14.1. Overview

            18.3.14.2. Application Portfolio

            18.3.14.3. Sales Footprint

            18.3.14.4. Strategy Overview

        18.3.15. Codriver

            18.3.15.1. Overview

            18.3.15.2. Application Portfolio

            18.3.15.3. Sales Footprint

            18.3.15.4. Strategy Overview

        18.3.16. Deliforce

            18.3.16.1. Overview

            18.3.16.2. Application Portfolio

            18.3.16.3. Sales Footprint

            18.3.16.4. Strategy Overview

        18.3.17. Pikpack

            18.3.17.1. Overview

            18.3.17.2. Application Portfolio

            18.3.17.3. Sales Footprint

            18.3.17.4. Strategy Overview

        18.3.18. Gloat

            18.3.18.1. Overview

            18.3.18.2. Application Portfolio

            18.3.18.3. Sales Footprint

            18.3.18.4. Strategy Overview

        18.3.19. Skillnet

            18.3.19.1. Overview

            18.3.19.2. Application Portfolio

            18.3.19.3. Sales Footprint

            18.3.19.4. Strategy Overview

        18.3.20. delivery Biz Pro

            18.3.20.1. Overview

            18.3.20.2. Application Portfolio

            18.3.20.3. Sales Footprint

            18.3.20.4. Strategy Overview

Don't pay for what you don't need

Customize your report by selecting specific countries or regions and save 30%!

List of Tables

Table 1: Global Market Value (US$ Million), By Application, 2015 to 2021

Table 2: Global Market Value (US$ Million), By Application, 2022 to 2032

Table 3: Global Market Value (US$ Million), By Type, 2015 to 2021

Table 4: Global Market Value (US$ Million), By Type, 2022 to 2032

Table 5: Global Market, By Region, 2015 to 2021

Table 6: Global Market, By Region, 2022 to 2032

Table 7: North America Market Value (US$ Million), By Application, 2015 to 2021

Table 8: North America Market Value (US$ Million), By Application, 2022 to 2032

Table 9: North America Market Value (US$ Million), By Type, 2015 to 2021

Table 10: North America Market Value (US$ Million), By Type, 2022 to 2032

Table 11: North America Market, By Country, 2015 to 2021

Table 12: North America Market, By Country, 2022 to 2032

Table 13: Latin America Market Value (US$ Million), By Application, 2015 to 2021

Table 14: Latin America Market Value (US$ Million), By Application, 2022 to 2032

Table 15: Latin America Market Value (US$ Million), By Type, 2015 to 2021

Table 16: Latin America Market Value (US$ Million), By Type, 2022 to 2032

Table 17: Latin America Market, By Country, 2015 to 2021

Table 18: Latin America Market, By Country, 2022 to 2032

Table 19: Europe Market Value (US$ Million), By Application, 2015 to 2021

Table 20: Europe Market Value (US$ Million), By Application, 2022 to 2032

Table 21: Europe Market Value (US$ Million), By Type, 2015 to 2021

Table 22: Europe Market Value (US$ Million), By Type, 2022 to 2032

Table 23: Europe Market, By Country, 2015 to 2021

Table 24: Europe Market, By Country, 2022 to 2032

Table 25: Asia Pacific Market Value (US$ Million), By Application, 2015 to 2021

Table 26: Asia Pacific Market Value (US$ Million), By Application, 2022 to 2032

Table 27: Asia Pacific Market Value (US$ Million), By Type, 2015 to 2021

Table 28: Asia Pacific Market Value (US$ Million), By Type, 2022 to 2032

Table 29: Asia Pacific Market, By Country, 2015 to 2021

Table 30: Asia Pacific Market, By Country, 2022 to 2032

Table 31: Middle East and Africa Market Value (US$ Million), By Application, 2015 to 2021

Table 32: Middle East and Africa Market Value (US$ Million), By Application, 2022 to 2032

Table 33: Middle East and Africa Market Value (US$ Million), By Type, 2015 to 2021

Table 34: Middle East and Africa Market Value (US$ Million), By Type, 2022 to 2032

Table 35: Middle East and Africa Market, By Country, 2015 to 2021

Table 36: Middle East and Africa Market, By Country, 2022 to 2032

Table 37: Global Market Incremental Opportunity, By Application, 2015 to 2021

Table 38: Global Market Incremental Opportunity, By Type, 2022 to 2032

Table 39: Global Market Incremental Opportunity, By Region, 2022 to 2032

Table 40: North America Market Incremental Opportunity, By Application, 2015 to 2021

Table 41: North America Market Incremental Opportunity, By Type, 2022 to 2032

Table 42: North America Market Incremental Opportunity, By Country, 2022 to 2032

Table 43: Latin America Market Incremental Opportunity, By Application, 2015 to 2021

Table 44: Latin America Market Incremental Opportunity, By Type, 2022 to 2032

Table 45: Latin America Market Incremental Opportunity, By Country, 2022 to 2032

Table 46: Europe Market Incremental Opportunity, By Application, 2015 to 2021

Table 47: Europe Market Incremental Opportunity, By Type, 2022 to 2032

Table 48: Europe Market Incremental Opportunity, By Country, 2022 to 2032

Table 49: Asia Pacific Market Incremental Opportunity, By Application, 2015 to 2021

Table 50: Asia Pacific Market Incremental Opportunity, By Type, 2022 to 2032

Table 51: Asia Pacific Market Incremental Opportunity, By Country, 2022 to 2032

Table 52: Middle East and Africa Market Incremental Opportunity, By Application, 2015 to 2021

Table 53: Middle East and Africa Market Incremental Opportunity, By Type, 2022 to 2032

Table 54: Middle East and Africa Market Incremental Opportunity, By Country, 2022 to 2032
Sudip Saha
Sudip Saha

Principal Consultant

Talk to Analyst

Find your sweet spots for generating winning opportunities in this market.

List of Charts

Figure 1: Global Market Value (US$ Million) and Year-on-Year Growth, 2015 to 2032

Figure 2: Global Market Absolute Historical Gain (2015 to 2021) and Opportunity (2022 to 2032), US$ Million

Figure 3: Global Market Share, By Application, 2022 & 2032

Figure 4: Global Market Y-o-Y Growth Projections, By Application - 2022 to 2032

Figure 5: Global Market Attractiveness Index, By Application - 2022 to 2032

Figure 6: Global Market Share, By Type, 2022 & 2032

Figure 7: Global Market Y-o-Y Growth Projections, By Type - 2022 to 2032

Figure 8: Global Market Attractiveness Index, By Type - 2022 to 2032

Figure 9: Global Market Share, By Region, 2022 & 2032

Figure 10: Global Market Y-o-Y Growth Projections, By Region - 2022 to 2032

Figure 11: Global Market Attractiveness Index, By Region - 2022 to 2032

Figure 12: North America Market Value (US$ Million) and Year-on-Year Growth, 2015 to 2032

Figure 13: North America Market Absolute Opportunity Historical (2015 to 2021) and Forecast Period (2022 to 2032), US$ Million

Figure 14: North America Market Share, By Application, 2022 & 2032

Figure 15: North America Market Y-o-Y Growth Projections, By Application - 2022 to 2032

Figure 16: North America Market Attractiveness Index, By Application - 2022 to 2032

Figure 17: North America Market Share, By Type, 2022 & 2032

Figure 18: North America Market Y-o-Y Growth Projections, By Type - 2022 to 2032

Figure 19: North America Market Attractiveness Index, By Type - 2022 to 2032

Figure 20: North America Market Share, By Country, 2022 & 2032

Figure 21: North America Market Y-o-Y Growth Projections, By Country - 2022 to 2032

Figure 22: North America Market Attractiveness Index, By Country - 2022 to 2032

Figure 23: Latin America Market Value (US$ Million) and Year-on-Year Growth, 2015 to 2032

Figure 24: Latin America Market Absolute Opportunity Historical (2015 to 2021) and Forecast Period (2022 to 2032), US$ Million

Figure 25: Latin America Market Share, By Application, 2022 & 2032

Figure 26: Latin America Market Y-o-Y Growth Projections, By Application - 2022 to 2032

Figure 27: Latin America Market Attractiveness Index, By Application - 2022 to 2032

Figure 28: Latin America Market Share, By Type, 2022 & 2032

Figure 29: Latin America Market Y-o-Y Growth Projections, By Type - 2022 to 2032

Figure 30: Latin America Market Attractiveness Index, By Type - 2022 to 2032

Figure 31: Latin America Market Share, By Country, 2022 & 2032

Figure 32: Latin America Market Y-o-Y Growth Projections, By Country - 2022 to 2032

Figure 33: Latin America Market Attractiveness Index, By Country - 2022 to 2032

Figure 34: Europe Market Value (US$ Million) and Year-on-Year Growth, 2015 to 2032

Figure 35: Europe Market Absolute Opportunity Historical (2015 to 2021) and Forecast Period (2022 to 2032), US$ Million

Figure 36: Europe Market Share, By Application, 2022 & 2032

Figure 37: Europe Market Y-o-Y Growth Projections, By Application - 2022 to 2032

Figure 38: Europe Market Attractiveness Index, By Application - 2022 to 2032

Figure 39: Europe Market Share, By Type, 2022 & 2032

Figure 40: Europe Market Y-o-Y Growth Projections, By Type - 2022 to 2032

Figure 41: Europe Market Attractiveness Index, By Type - 2022 to 2032

Figure 42: Europe Market Share, By Country, 2022 & 2032

Figure 43: Europe Market Y-o-Y Growth Projections, By Country - 2022 to 2032

Figure 44: Europe Market Attractiveness Index, By Country - 2022 to 2032

Figure 45: Middle East and Africa Market Value (US$ Million) and Year-on-Year Growth, 2015 to 2032

Figure 46: Middle East and Africa Market Absolute Opportunity Historical (2015 to 2021) and Forecast Period (2022 to 2032), US$ Million

Figure 47: Middle East and Africa Market Share, By Application, 2022 & 2032

Figure 48: Middle East and Africa Market Y-o-Y Growth Projections, By Application - 2022 to 2032

Figure 49: Middle East and Africa Market Attractiveness Index, By Application - 2022 to 2032

Figure 50: Middle East and Africa Market Share, By Type, 2022 & 2032

Figure 51: Middle East and Africa Market Y-o-Y Growth Projections, By Type - 2022 to 2032

Figure 52: Middle East and Africa Market Attractiveness Index, By Type - 2022 to 2032

Figure 53: Middle East and Africa Market Share, By Country, 2022 & 2032

Figure 54: Middle East and Africa Market Y-o-Y Growth Projections, By Country - 2022 to 2032

Figure 55: Middle East and Africa Market Attractiveness Index, By Country - 2022 to 2032

Figure 56: Asia Pacific Market Value (US$ Million) and Year-on-Year Growth, 2015 to 2032

Figure 57: Asia Pacific Market Absolute Opportunity Historical (2015 to 2021) and Forecast Period (2022 to 2032), US$ Million

Figure 58: Asia Pacific Market Share, By Application, 2022 & 2032

Figure 59: Asia Pacific Market Y-o-Y Growth Projections, By Application - 2022 to 2032

Figure 60: Asia Pacific Market Attractiveness Index, By Application - 2022 to 2032

Figure 61: Asia Pacific Market Share, By Type, 2022 & 2032

Figure 62: Asia Pacific Market Y-o-Y Growth Projections, By Type - 2022 to 2032

Figure 63: Asia Pacific Market Attractiveness Index, By Type - 2022 to 2032

Figure 64: Asia Pacific Market Share, By Country, 2022 & 2032

Figure 65: Asia Pacific Market Y-o-Y Growth Projections, By Country - 2022 to 2032

Figure 66: Asia Pacific Market Attractiveness Index, By Country - 2022 to 2032

Figure 67: United States of America Market Value (US$ Million) and Forecast, 2022 to 2032

Figure 68: United States of America Market Share, By Application, 2021

Figure 69: United States of America Market Share, By Type, 2021

Figure 70: Canada Market Value (US$ Million) and Forecast, 2022 to 2032

Figure 71: Canada Market Share, By Application, 2021

Figure 72: Canada Market Share, By Type, 2021

Figure 73: Brazil Market Value (US$ Million) and Forecast, 2022 to 2032

Figure 74: Brazil Market Share, By Application, 2021

Figure 75: Brazil Market Share, By Type, 2021

Figure 76: Mexico Market Value (US$ Million) and Forecast, 2022 to 2032

Figure 77: Mexico Market Share, By Application, 2021

Figure 78: Mexico Market Share, By Type, 2021

Figure 79: Germany Market Value (US$ Million) and Forecast, 2022 to 2032

Figure 80: Germany Market Share, By Application, 2021

Figure 81: Germany Market Share, By Type, 2021

Figure 82: United Kingdom Market Value (US$ Million) and Forecast, 2022 to 2032

Figure 83: United Kingdom Market Share, By Application, 2021

Figure 84: United Kingdom Market Share, By Type, 2021

Figure 85: France Market Value (US$ Million) and Forecast, 2022 to 2032

Figure 86: France Market Share, By Application, 2021

Figure 87: France Market Share, By Type, 2021

Figure 88: Italy Market Value (US$ Million) and Forecast, 2022 to 2032

Figure 89: Italy Market Share, By Application, 2021

Figure 90: Italy Market Share, By Type, 2021

Figure 91: BENELUX Market Value (US$ Million) and Forecast, 2022 to 2032

Figure 92: BENELUX Market Share, By Application, 2021

Figure 93: BENELUX Market Share, By Type, 2021

Figure 94: Nordic Countries Market Value (US$ Million) and Forecast, 2022 to 2032

Figure 95: Nordic Countries Market Share, By Application, 2021

Figure 96: Nordic Countries Market Share, By Type, 2021

Figure 97: China Market Value (US$ Million) and Forecast, 2022 to 2032

Figure 98: China Market Share, By Application, 2021

Figure 99: China Market Share, By Type, 2021

Figure 100: Japan Market Value (US$ Million) and Forecast, 2022 to 2032

Figure 101: Japan Market Share, By Application, 2021

Figure 102: Japan Market Share, By Type, 2021

Figure 103: South Korea Market Value (US$ Million) and Forecast, 2022 to 2032

Figure 104: South Korea Market Share, By Application, 2021

Figure 105: South Korea Market Share, By Type, 2021

Figure 106: GCC Countries Market Value (US$ Million) and Forecast, 2022 to 2032

Figure 107: GCC Countries Market Share, By Application, 2021

Figure 108: GCC Countries Market Share, By Type, 2021

Figure 109: South Africa Market Value (US$ Million) and Forecast, 2022 to 2032

Figure 110: South Africa Market Share, By Application, 2021

Figure 111: South Africa Market Share, By Type, 2021

Figure 112: Turkey Market Value (US$ Million) and Forecast, 2022 to 2032

Figure 113: Turkey Market Share, By Application, 2021

Figure 114: Turkey Market Share, By Type, 2021

Explore Technology Insights

View Reports

Last-Mile Delivery Software Market