Plaster Accelerator Market Outlook and Forecast 2025 to 2035

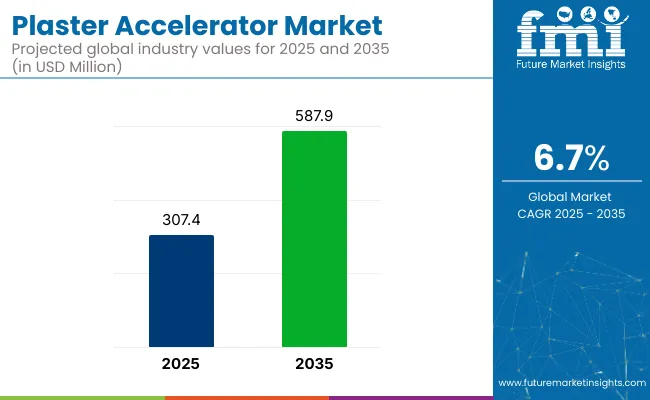
The plaster accelerator market is valued at USD 307.4 million in 2025 and is poised to reach USD 587.9 million by 2035, reflecting a CAGR of 6.7%. This growth is being driven by a heightened demand for fast-setting plaster solutions, increased urban development, and the adoption of prefabricated construction techniques. The incorporation of green building codes and low-VOC construction materials has also been supporting this surge in demand, especially across residential and commercial sectors.
Quick Stats of Plaster Accelerator Market

  • Market Value (2025): USD 307.4 million
  • Forecast Value (2035): USD 587.9 million
  • Forecast CAGR: 6.7%
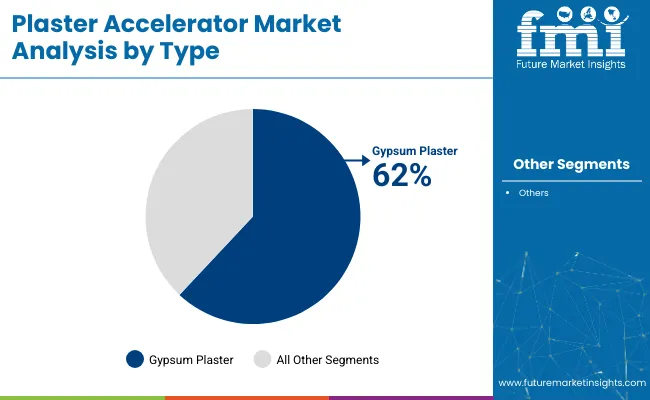
  • Leading Type Segment in 2025: Gypsum Plaster (62% market share)
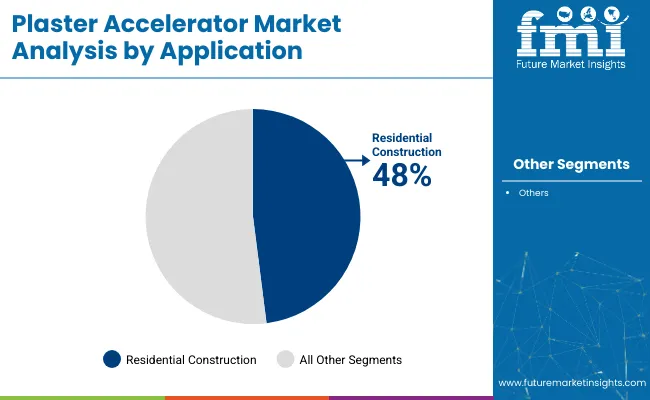
  • Top Application Segment: Residential (48% market share)
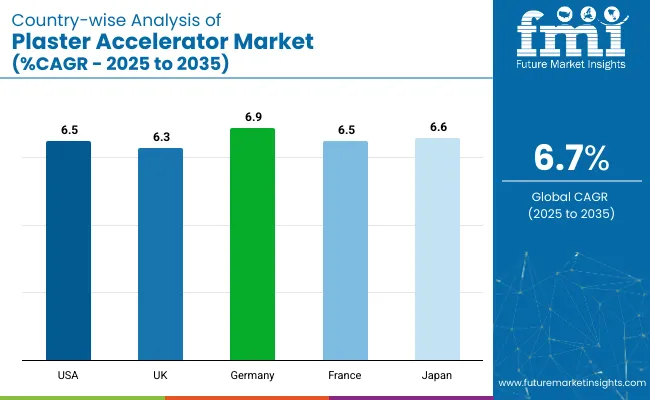
  • Fastest Growing Country: Germany (6.9% CAGR)

Plaster Accelerator Market

Metric Value
Market Size (2025) USD 307.4 million
Market Size (2035) USD 587.9 million
CAGR (2025 to 2035) 6.7%

The gypsum plaster sub-segment is projected to dominate the type segment with a 62% market share through 2025, driven by its efficiency, fast setting times, and superior finish. The residential construction sector is expected to lead the application category with a 48% share, reflecting rising housing initiatives and interior renovation activities.

Within product types, factory-fabricated gypsum plasterboards are being widely adopted, especially in modular construction, making them the top-performing segment. Regionally, the USA is forecasted to maintain the highest revenue share, while the Germany is anticipated to emerge as the fastest-growing country with a CAGR of 6.9%.

Meanwhile, the integration of AI-assisted plaster optimization, bio-based accelerators, and real-time performance monitoring is redefining market competitiveness. Companies that align their strategies with sustainable building goals and construction digitization are expected to be rewarded with long-term growth and market presence. Rapid urbanization and eco-compliant infrastructure plans are also expected to fuel continuous demand for advanced plaster accelerator solutions globally.

Advanced manufacturing techniques have been increasingly adopted to enhance the efficiency and consistency of plaster accelerator production. High-performance additives with improved shelf life, lower emissions, and faster curing profiles have been introduced to meet regulatory and performance standards. Strategic collaborations between chemical manufacturers and construction firms have also been formed to develop custom formulations suited for specific climate zones and regional construction practices.

Analyzing Plaster Accelerator Market by Top Investment Segments

The market is segmented by type, application, and region. By type, the market is divided into gypsum plaster and non gypsum plaster. Based on application, the market is categorized into residential, commercial, industrial, and infrastructure. Regionally, the market is classified into North America, Latin America, Western Europe, Eastern Europe, East Asia, South Asia Pacific, and Middle East & Africa.

Gypsum Plaster to Lead the Type Segment with 62% Market Share

Gypsum plaster is projected to lead the type segment, accounting for 62% of the global market share in 2025. It has been widely adopted due to its fast-setting nature, smooth surface finish, and reduced shrinkage, making it a preferred choice for interior wall applications in both residential and commercial construction.
  • Applications requiring efficient wall finishing and high workability have consistently favored gypsum-based accelerators.
  • Superior compatibility with prefabricated systems and decorative designs has enhanced its market usage.
  • Widespread compliance with green building regulations and low-VOC standards has supported its adoption.

Plaster Accelerator Market Analysis By Type

Residential Construction to Lead the Application Segment with 48% Market Share

The residential construction segment is expected to dominate the application category, securing 48% of the global market share by 2025. The segment's expansion has been fueled by urban housing developments, home improvement activities, and demand for fast-setting materials that reduce construction time and cost.
  • Plaster accelerators have been preferred in residential buildings for enabling smooth finishes and labor efficiency.
  • Government-led initiatives for affordable and energy-efficient housing have boosted demand.
  • Integration of automated mixing and real-time application tools has ensured precision and reduced material waste.

Plaster Accelerator Market Analysis By Application

Top Plaster Accelerator Market Dynamics

The market is experiencing consistent growth, driven by rising demand for fast-setting construction materials, increased adoption of modular and prefabricated building techniques, and regulatory support for sustainable, low-emission additives.

Recent Trends in the Plaster Accelerator Market

  • The usage of eco-friendly and low-VOC plaster accelerators has been accelerated across residential and commercial sectors.
  • AI-assisted formulations and smart plastering systems have been increasingly integrated to enhance efficiency.
  • Pre-blended gypsum boards with embedded accelerators have been adopted to support prefabrication.

Challenges in the Plaster Accelerator Market
  • Price fluctuations in raw materials such as calcium sulfate and aluminum sulfate are being observed.
  • Compliance with evolving green building codes and sustainability certifications has posed operational challenges.
  • Supply chain inconsistencies in emerging markets have impacted product availability and construction timelines.

Analyzing Top Countries Manufacturing and Supplying Plaster Accelerators

Plaster Accelerator Market Country Wise Analysis

USA Plaster Accelerator Market Analysis

The USA plaster accelerator market is expected to grow at a CAGR of 6.5% from 2025 to 2035. This growth is being supported by increased demand for rapid-setting plaster in new residential and commercial construction, along with significant advancements in green building technologies.

  • Strong demand from residential renovation and prefabricated housing projects.
  • Gypsum-based construction materials are being increasingly utilized.
  • Smart mixing systems are being adopted to improve precision and application speed.
  • Supportive building codes are encouraging low-VOC and energy-efficient materials.

Plaster Accelerator Sales Analysis in the UK

The UK plaster accelerator market is projected to expand at a CAGR of 6.3% during the forecast period. Rising investments in sustainable construction and government incentives for low-carbon buildings are fueling demand for fast-setting plaster formulations.

  • Regulatory pressure is favoring green-labeled construction additives.
  • Demand is growing for dry wall and fast-curing interior solutions.
  • Construction companies are shifting toward energy-saving wall finishes.
  • High usage is being recorded in affordable and eco-responsible housing developments.

Germany Plaster Accelerator Market Analysis

Germany’s plaster accelerator market is forecasted to grow at a CAGR of 6.9% from 2025 to 2035. The country's focus on high-performance construction solutions and adherence to stringent environmental standards have driven the use of gypsum-based accelerators.

  • Smart city development is stimulating rapid interior finish demand.
  • High thermal and fire-resistant plaster accelerators are being utilized in industrial structures.
  • Strict EU energy codes are being met using low-emission additives.
  • Investments are being made in AI-optimized plaster formulations.

Plaster Accelerator Demand Analysis in France

The plaster accelerator market in France is anticipated to grow at a CAGR of 6.5% over the forecast period. Restoration of heritage buildings, expansion of residential housing, and government initiatives for sustainable urban growth have supported the demand for eco-compliant and fast-setting plaster products.

  • Emphasis is being placed on renovating historical architecture with quick-curing plaster.
  • Green building certifications are encouraging low-VOC accelerator adoption.
  • Residential developers are implementing pre-blended gypsum solutions.
  • Smart building systems are being integrated with automatic plastering equipment.

Japan Plaster Accelerator Market Analysis

Japan’s plaster accelerator market is projected to grow at a CAGR of 6.6% from 2025 to 2035. The country’s commitment to smart city infrastructure and earthquake-resilient building materials is encouraging the adoption of moisture-resistant and rapid-setting plaster accelerators.

  • High-rise developments are utilizing AI-monitored plaster application tools.
  • Moisture-tolerant gypsum accelerators are favored due to climatic conditions.
  • Construction technologies are integrating bio-based and recyclable additives.
  • Urban renewal projects are emphasizing fast-track wall finishing methods.

Leading Plastic Accelerator Suppliers and Distributors

The plastic accelerator market is moderately consolidated, with several publicly listed global leaders holding substantial market shares, while regional innovators and specialty chemical firms continue to diversify offerings. Competitive dynamics are being shaped by investments in eco-friendly additives, integration of AI in formulation optimization, and strategic shifts toward high-margin specialty applications. Capacity expansion, M&A activity, and downstream partnerships are being employed to enhance market presence and technology.

Tier-one firms, such as SABIC, BASF SE, Dow Inc., LyondellBasell, and Covestro AG, are competing through large-scale investments in polymer additives, including antioxidants, curing agents, and light stabilizers used in plastic acceleration and recycling enhancement. These companies have been strengthening their additive portfolios with AI-enabled R&D platforms, modular manufacturing upgrades, and compliance-aligned formulations for packaging, automotive, and electronics markets.

Additionally, companies like LG Chem, Westlake Corp., Eastman Chemical, Arkema SA, and Lanxess AG have been advancing niche segments with next-generation plasticisers, nucleating agents, epoxy accelerators, and UV-stable modifiers. Many of these players are aligning product strategies with circular economy targets, scaling up bio-based or non-phthalate alternatives to meet sustainability demands. Strategic acquisitions, customer-specific additive solutions, and regional supply security have been emphasized as key drivers of competitive advantage.

Recent Plaster Accelerator Industry News:

  • In July 2024, BASF launched several new plastic additive solutions, including advanced heat and light stabilizers like Tinuvin® NOR® 211 AR, designed to prolong the lifespan of plastics used in agriculture and protect against harsh chemicals and UV exposure. These innovations directly support the durability and performance of plastics, which is a key function of plastic accelerators in certain applications.
  • In 2024, Evonik launched an innovation strategy with a focus on bio-based solutions, energy transition, and the circular economy. This includes developing sustainable specialty chemicals and biodegradable polymers, which often require specialized accelerators in their synthesis and processing.

Plaster Accelerator Market Report Scope

Report Attributes Details
Current Total Market Size (2025) USD 307.4 million
Projected Market Size (2035) USD 587.9 million
CAGR (2025 to 2035) 6.7%
Base Year for Estimation 2024
Historical Period 2020 to 2024
Projections Period 2025 to 2035
Market Analysis Parameters Revenue in USD millions / Volume in metric tons
By Type Gypsum Plaster, Non-Gypsum Plaster
By Application Residential, Commercial, Industrial, Infrastructure
By Region North America, Latin America, Western Europe, Eastern Europe, East Asia, South Asia Pacific, Middle East and Africa
Countries Covered United States, Canada, United Kingdom, Germany, France, China, Japan, South Korea, Brazil, Australia
Key Players SABIC, BASF SE, Dow Inc., LyondellBasell, Covestro AG, LG Chem, Westlake Corp., Eastman Chemical, Arkema SA, Lanxess AG
Additional Attributes Dollar sales by value, market share analysis by region, and country-wise analysis

Plaster Accelerator Market Segmentation

By Type:

  • Gypsum Plaster
  • Non Gypsum Plaster

By Application:

  • Residential
  • Commercial
  • Industrial
  • Infrastrcuture

By Region:

  • North America
  • Latin America
  • Western Europe
  • Eastern Europe
  • East Asia
  • South Asia Pacific
  • Middle East and Africa

Table of Content

  1. Executive Summary
    • Global Market Outlook
    • Demand-side Trends
    • Supply-side Trends
    • Technology Roadmap Analysis
    • Analysis and Recommendations
  2. Market Overview
    • Market Coverage / Taxonomy
    • Market Definition / Scope / Limitations
  3. Market Background
    • Market Dynamics
      • Drivers
      • Restraints
      • Opportunity
      • Trends
    • Scenario Forecast
      • Demand in Optimistic Scenario
      • Demand in Likely Scenario
      • Demand in Conservative Scenario
    • Opportunity Map Analysis
    • Product Life Cycle Analysis
    • Supply Chain Analysis
      • Supply Side Participants and their Roles
        • Producers
        • Mid-Level Participants (Traders/ Agents/ Brokers)
        • Wholesalers and Distributors
      • Value Added and Value Created at Node in the Supply Chain
      • List of Raw Material Suppliers
      • List of Existing and Potential Buyer’s
    • Investment Feasibility Matrix
    • Value Chain Analysis
      • Profit Margin Analysis
      • Wholesalers and Distributors
      • Retailers
    • PESTLE and Porter’s Analysis
    • Regulatory Landscape
      • By Key Regions
      • By Key Countries
    • Regional Parent Market Outlook
    • Production and Consumption Statistics
    • Import and Export Statistics
  4. Global Market Analysis 2020 to 2024 and Forecast, 2025 to 2035
    • Historical Market Size Value (USD Million) & Volume (Metric Tons) Analysis, 2020 to 2024
    • Current and Future Market Size Value (USD Million) & Volume (Metric Tons) Projections, 2025 to 2035
      • Y-o-Y Growth Trend Analysis
      • Absolute $ Opportunity Analysis
  5. Global Market Pricing Analysis 2020 to 2024 and Forecast 2025 to 2035
  6. Global Market Analysis 2020 to 2024 and Forecast 2025 to 2035, By Type
    • Introduction / Key Findings
    • Historical Market Size Value (USD Million) & Volume (Metric Tons) Analysis By Type, 2020 to 2024
    • Current and Future Market Size Value (USD Million) & Volume (Metric Tons) Analysis and Forecast By Type, 2025 to 2035
      • Gypsum Plaster
      • Non Gypsum Plaster
    • Y-o-Y Growth Trend Analysis By Type, 2020 to 2024
    • Absolute $ Opportunity Analysis By Type, 2025 to 2035
  7. Global Market Analysis 2020 to 2024 and Forecast 2025 to 2035, By Application
    • Introduction / Key Findings
    • Historical Market Size Value (USD Million) & Volume (Metric Tons) Analysis By Application, 2020 to 2024
    • Current and Future Market Size Value (USD Million) & Volume (Metric Tons) Analysis and Forecast By Application, 2025 to 2035
      • Residential
      • Commercial
      • Industrial
      • Infrastructure
    • Y-o-Y Growth Trend Analysis By Application, 2020 to 2024
    • Absolute $ Opportunity Analysis By Application, 2025 to 2035
  8. Global Market Analysis 2020 to 2024 and Forecast 2025 to 2035, By Region
    • Introduction
    • Historical Market Size Value (USD Million) & Volume (Metric Tons) Analysis By Region, 2020 to 2024
    • Current Market Size Value (USD Million) & Volume (Metric Tons) Analysis and Forecast By Region, 2025 to 2035
      • North America
      • Latin America
      • Western Europe
      • Eastern Europe
      • East Asia
      • South Asia & Pacific
      • Middle East and Africa
    • Market Attractiveness Analysis By Region
  9. North America Market Analysis 2020 to 2024 and Forecast 2025 to 2035, By Country
    • Historical Market Size Value (USD Million) & Volume (Metric Tons) Trend Analysis By Market Taxonomy, 2020 to 2024
    • Market Size Value (USD Million) & Volume (Metric Tons) Forecast By Market Taxonomy, 2025 to 2035
      • By Country
        • USA
        • Canada
        • Mexico
      • By Type
      • By Application
    • Market Attractiveness Analysis
      • By Country
      • By Type
      • By Application
    • Key Takeaways
  10. Latin America Market Analysis 2020 to 2024 and Forecast 2025 to 2035, By Country
    • Historical Market Size Value (USD Million) & Volume (Metric Tons) Trend Analysis By Market Taxonomy, 2020 to 2024
    • Market Size Value (USD Million) & Volume (Metric Tons) Forecast By Market Taxonomy, 2025 to 2035
      • By Country
        • Brazil
        • Argentina
        • Rest of LATAM
      • By Type
      • By Application
    • Market Attractiveness Analysis
      • By Country
      • By Type
      • By Application
    • Key Takeaways
  11. Western Europe Market Analysis 2020 to 2024 and Forecast 2025 to 2035, By Country
    • Historical Market Size Value (USD Million) & Volume (Metric Tons) Trend Analysis By Market Taxonomy, 2020 to 2024
    • Market Size Value (USD Million) & Volume (Metric Tons) Forecast By Market Taxonomy, 2025 to 2035
      • By Country
        • Germany
        • Italy
        • France
        • UK
        • Spain
        • BENELUX
        • Nordic
        • Rest of W.Europe
      • By Type
      • By Application
    • Market Attractiveness Analysis
      • By Country
      • By Type
      • By Application
    • Key Takeaways
  12. Eastern Europe Market Analysis 2020 to 2024 and Forecast 2025 to 2035, By Country
    • Historical Market Size Value (USD Million) & Volume (Metric Tons) Trend Analysis By Market Taxonomy, 2020 to 2024
    • Market Size Value (USD Million) & Volume (Metric Tons) Forecast By Market Taxonomy, 2025 to 2035
      • By Country
        • Russia
        • Hungary
        • Poland
        • Balkan & Baltics
        • Rest of E. Europe
      • By Type
      • By Application
    • Market Attractiveness Analysis
      • By Country
      • By Type
      • By Application
    • Key Takeaways
  13. East Asia Market Analysis 2020 to 2024 and Forecast 2025 to 2035, By Country
    • Historical Market Size Value (USD Million) & Volume (Metric Tons) Trend Analysis By Market Taxonomy, 2020 to 2024
    • Market Size Value (USD Million) & Volume (Metric Tons) Forecast By Market Taxonomy, 2025 to 2035
      • By Country
        • China
        • Japan
        • South Korea
      • By Type
      • By Application
    • Market Attractiveness Analysis
      • By Country
      • By Type
      • By Application
    • Key Takeaways
  14. South Asia & Pacific Market Analysis 2020 to 2024 and Forecast 2025 to 2035, By Country
    • Historical Market Size Value (USD Million) & Volume (Metric Tons) Trend Analysis By Market Taxonomy, 2020 to 2024
    • Market Size Value (USD Million) & Volume (Metric Tons) Forecast By Market Taxonomy, 2025 to 2035
      • By Country
        • India
        • Australia & New Zealand
        • ASEAN
        • Rest of SAP
      • By Type
      • By Application
    • Market Attractiveness Analysis
      • By Country
      • By Type
      • By Application
    • Key Takeaways
  15. Middle East and Africa Market Analysis 2020 to 2024 and Forecast 2025 to 2035, By Country
    • Historical Market Size Value (USD Million) & Volume (Metric Tons) Trend Analysis By Market Taxonomy, 2020 to 2024
    • Market Size Value (USD Million) & Volume (Metric Tons) Forecast By Market Taxonomy, 2025 to 2035
      • By Country
        • GCC Countries
        • Northern Africa
        • South Africa
        • Turkiye
        • Rest of MEA
      • By Type
      • By Application
    • Market Attractiveness Analysis
      • By Country
      • By Type
      • By Application
    • Key Takeaways
  16. Key Countries Market Analysis
    • USA
      • Pricing Analysis
      • Market Share Analysis, 2024
        • By Type
        • By Application
    • Canada
      • Pricing Analysis
      • Market Share Analysis, 2024
        • By Type
        • By Application
    • Brazil
      • Pricing Analysis
      • Market Share Analysis, 2024
        • By Type
        • By Application
    • Mexico
      • Pricing Analysis
      • Market Share Analysis, 2024
        • By Type
        • By Application
    • Argentina
      • Pricing Analysis
      • Market Share Analysis, 2024
        • By Type
        • By Application
  17. Market Structure Analysis
    • Competition Dashboard
    • Competition Benchmarking
    • Market Share Analysis of Top Players
      • By Regional
      • By Type
      • By Application
  18. Competition Analysis
    • Competition Deep Dive
      • SABIC
        • Overview
        • Product Portfolio
        • Profitability by Market Segments (Product/Age /Sales Channel/Region)
        • Sales Footprint
        • Strategy Overview
          • Marketing Strategy
          • Product Strategy
          • Channel Strategy
      • BASF SE
        • Overview
        • Product Portfolio
        • Profitability by Market Segments (Product/Age /Sales Channel/Region)
        • Sales Footprint
        • Strategy Overview
          • Marketing Strategy
          • Product Strategy
          • Channel Strategy
      • Dow Inc.
        • Overview
        • Product Portfolio
        • Profitability by Market Segments (Product/Age /Sales Channel/Region)
        • Sales Footprint
        • Strategy Overview
          • Marketing Strategy
          • Product Strategy
          • Channel Strategy
      • LyondellBasell
        • Overview
        • Product Portfolio
        • Profitability by Market Segments (Product/Age /Sales Channel/Region)
        • Sales Footprint
        • Strategy Overview
          • Marketing Strategy
          • Product Strategy
          • Channel Strategy
      • Covestro AG
        • Overview
        • Product Portfolio
        • Profitability by Market Segments (Product/Age /Sales Channel/Region)
        • Sales Footprint
        • Strategy Overview
          • Marketing Strategy
          • Product Strategy
          • Channel Strategy
      • LG Chem
        • Overview
        • Product Portfolio
        • Profitability by Market Segments (Product/Age /Sales Channel/Region)
        • Sales Footprint
        • Strategy Overview
          • Marketing Strategy
          • Product Strategy
          • Channel Strategy
      • Westlake Corp.
        • Overview
        • Product Portfolio
        • Profitability by Market Segments (Product/Age /Sales Channel/Region)
        • Sales Footprint
        • Strategy Overview
          • Marketing Strategy
          • Product Strategy
          • Channel Strategy
      • Eastman Chemical
        • Overview
        • Product Portfolio
        • Profitability by Market Segments (Product/Age /Sales Channel/Region)
        • Sales Footprint
        • Strategy Overview
          • Marketing Strategy
          • Product Strategy
          • Channel Strategy
      • Arkema SA
        • Overview
        • Product Portfolio
        • Profitability by Market Segments (Product/Age /Sales Channel/Region)
        • Sales Footprint
        • Strategy Overview
          • Marketing Strategy
          • Product Strategy
          • Channel Strategy
      • Lanxess AG
        • Overview
        • Product Portfolio
        • Profitability by Market Segments (Product/Age /Sales Channel/Region)
        • Sales Footprint
        • Strategy Overview
          • Marketing Strategy
          • Product Strategy
          • Channel Strategy
  19. Assumptions & Acronyms Used
  20. Research Methodology

List of Tables

  • Table 1: Global Market Value (USD Million) Forecast by Region, 2020-2035
  • Table 2: Global Market Volume (Metric Tons) Forecast by Region, 2020-2035
  • Table 3: Global Market Value (USD Million) Forecast by Type, 2020-2035
  • Table 4: Global Market Volume (Metric Tons) Forecast by Type, 2020-2035
  • Table 5: Global Market Value (USD Million) Forecast by Application, 2020-2035
  • Table 6: Global Market Volume (Metric Tons) Forecast by Application, 2020-2035
  • Table 7: North America Market Value (USD Million) Forecast by Country, 2020-2035
  • Table 8: North America Market Volume (Metric Tons) Forecast by Country, 2020-2035
  • Table 9: North America Market Value (USD Million) Forecast by Type, 2020-2035
  • Table 10: North America Market Volume (Metric Tons) Forecast by Type, 2020-2035
  • Table 11: North America Market Value (USD Million) Forecast by Application, 2020-2035
  • Table 12: North America Market Volume (Metric Tons) Forecast by Application, 2020-2035
  • Table 13: Latin America Market Value (USD Million) Forecast by Country, 2020-2035
  • Table 14: Latin America Market Volume (Metric Tons) Forecast by Country, 2020-2035
  • Table 15: Latin America Market Value (USD Million) Forecast by Type, 2020-2035
  • Table 16: Latin America Market Volume (Metric Tons) Forecast by Type, 2020-2035
  • Table 17: Latin America Market Value (USD Million) Forecast by Application, 2020-2035
  • Table 18: Latin America Market Volume (Metric Tons) Forecast by Application, 2020-2035
  • Table 19: Western Europe Market Value (USD Million) Forecast by Country, 2020-2035
  • Table 20: Western Europe Market Volume (Metric Tons) Forecast by Country, 2020-2035
  • Table 21: Western Europe Market Value (USD Million) Forecast by Type, 2020-2035
  • Table 22: Western Europe Market Volume (Metric Tons) Forecast by Type, 2020-2035
  • Table 23: Western Europe Market Value (USD Million) Forecast by Application, 2020-2035
  • Table 24: Western Europe Market Volume (Metric Tons) Forecast by Application, 2020-2035
  • Table 25: Eastern Europe Market Value (USD Million) Forecast by Country, 2020-2035
  • Table 26: Eastern Europe Market Volume (Metric Tons) Forecast by Country, 2020-2035
  • Table 27: Eastern Europe Market Value (USD Million) Forecast by Type, 2020-2035
  • Table 28: Eastern Europe Market Volume (Metric Tons) Forecast by Type, 2020-2035
  • Table 29: Eastern Europe Market Value (USD Million) Forecast by Application, 2020-2035
  • Table 30: Eastern Europe Market Volume (Metric Tons) Forecast by Application, 2020-2035
  • Table 31: East Asia Market Value (USD Million) Forecast by Country, 2020-2035
  • Table 32: East Asia Market Volume (Metric Tons) Forecast by Country, 2020-2035
  • Table 33: East Asia Market Value (USD Million) Forecast by Type, 2020-2035
  • Table 34: East Asia Market Volume (Metric Tons) Forecast by Type, 2020-2035
  • Table 35: East Asia Market Value (USD Million) Forecast by Application, 2020-2035
  • Table 36: East Asia Market Volume (Metric Tons) Forecast by Application, 2020-2035
  • Table 37: South Asia & Pacific Market Value (USD Million) Forecast by Country, 2020-2035
  • Table 38: South Asia & Pacific Market Volume (Metric Tons) Forecast by Country, 2020-2035
  • Table 39: South Asia & Pacific Market Value (USD Million) Forecast by Type, 2020-2035
  • Table 40: South Asia & Pacific Market Volume (Metric Tons) Forecast by Type, 2020-2035
  • Table 41: South Asia & Pacific Market Value (USD Million) Forecast by Application, 2020-2035
  • Table 42: South Asia & Pacific Market Volume (Metric Tons) Forecast by Application, 2020-2035
  • Table 43: Middle East and Africa Market Value (USD Million) Forecast by Country, 2020-2035
  • Table 44: Middle East and Africa Market Volume (Metric Tons) Forecast by Country, 2020-2035
  • Table 45: Middle East and Africa Market Value (USD Million) Forecast by Type, 2020-2035
  • Table 46: Middle East and Africa Market Volume (Metric Tons) Forecast by Type, 2020-2035
  • Table 47: Middle East and Africa Market Value (USD Million) Forecast by Application, 2020-2035
  • Table 48: Middle East and Africa Market Volume (Metric Tons) Forecast by Application, 2020-2035

List of Figures

  • Figure 1: Global Market Volume (Metric Tons) Forecast 2020-2035
  • Figure 2: Global Market Pricing Analysis
  • Figure 3: Global Market Value (USD Million) Forecast 2020-2035
  • Figure 4: Global Market Value Share and BPS Analysis by Type, 2025 and 2035
  • Figure 5: Global Market Y-o-Y Growth Comparison by Type, 2025-2035
  • Figure 6: Global Market Attractiveness Analysis by Type
  • Figure 7: Global Market Value Share and BPS Analysis by Application, 2025 and 2035
  • Figure 8: Global Market Y-o-Y Growth Comparison by Application, 2025-2035
  • Figure 9: Global Market Attractiveness Analysis by Application
  • Figure 10: Global Market Value (USD Million) Share and BPS Analysis by Region, 2025 and 2035
  • Figure 11: Global Market Y-o-Y Growth Comparison by Region, 2025-2035
  • Figure 12: Global Market Attractiveness Analysis by Region
  • Figure 13: North America Market Incremental $ Opportunity, 2025-2035
  • Figure 14: Latin America Market Incremental $ Opportunity, 2025-2035
  • Figure 15: Western Europe Market Incremental $ Opportunity, 2025-2035
  • Figure 16: Eastern Europe Market Incremental $ Opportunity, 2025-2035
  • Figure 17: East Asia Market Incremental $ Opportunity, 2025-2035
  • Figure 18: South Asia & Pacific Market Incremental $ Opportunity, 2025-2035
  • Figure 19: Middle East and Africa Market Incremental $ Opportunity, 2025-2035
  • Figure 20: North America Market Value Share and BPS Analysis by Country, 2025 and 2035
  • Figure 21: North America Market Value Share and BPS Analysis by Type, 2025 and 2035
  • Figure 22: North America Market Y-o-Y Growth Comparison by Type, 2025-2035
  • Figure 23: North America Market Attractiveness Analysis by Type
  • Figure 24: North America Market Value Share and BPS Analysis by Application, 2025 and 2035
  • Figure 25: North America Market Y-o-Y Growth Comparison by Application, 2025-2035
  • Figure 26: North America Market Attractiveness Analysis by Application
  • Figure 27: Latin America Market Value Share and BPS Analysis by Country, 2025 and 2035
  • Figure 28: Latin America Market Value Share and BPS Analysis by Type, 2025 and 2035
  • Figure 29: Latin America Market Y-o-Y Growth Comparison by Type, 2025-2035
  • Figure 30: Latin America Market Attractiveness Analysis by Type
  • Figure 31: Latin America Market Value Share and BPS Analysis by Application, 2025 and 2035
  • Figure 32: Latin America Market Y-o-Y Growth Comparison by Application, 2025-2035
  • Figure 33: Latin America Market Attractiveness Analysis by Application
  • Figure 34: Western Europe Market Value Share and BPS Analysis by Country, 2025 and 2035
  • Figure 35: Western Europe Market Value Share and BPS Analysis by Type, 2025 and 2035
  • Figure 36: Western Europe Market Y-o-Y Growth Comparison by Type, 2025-2035
  • Figure 37: Western Europe Market Attractiveness Analysis by Type
  • Figure 38: Western Europe Market Value Share and BPS Analysis by Application, 2025 and 2035
  • Figure 39: Western Europe Market Y-o-Y Growth Comparison by Application, 2025-2035
  • Figure 40: Western Europe Market Attractiveness Analysis by Application
  • Figure 41: Eastern Europe Market Value Share and BPS Analysis by Country, 2025 and 2035
  • Figure 42: Eastern Europe Market Value Share and BPS Analysis by Type, 2025 and 2035
  • Figure 43: Eastern Europe Market Y-o-Y Growth Comparison by Type, 2025-2035
  • Figure 44: Eastern Europe Market Attractiveness Analysis by Type
  • Figure 45: Eastern Europe Market Value Share and BPS Analysis by Application, 2025 and 2035
  • Figure 46: Eastern Europe Market Y-o-Y Growth Comparison by Application, 2025-2035
  • Figure 47: Eastern Europe Market Attractiveness Analysis by Application
  • Figure 48: East Asia Market Value Share and BPS Analysis by Country, 2025 and 2035
  • Figure 49: East Asia Market Value Share and BPS Analysis by Type, 2025 and 2035
  • Figure 50: East Asia Market Y-o-Y Growth Comparison by Type, 2025-2035
  • Figure 51: East Asia Market Attractiveness Analysis by Type
  • Figure 52: East Asia Market Value Share and BPS Analysis by Application, 2025 and 2035
  • Figure 53: East Asia Market Y-o-Y Growth Comparison by Application, 2025-2035
  • Figure 54: East Asia Market Attractiveness Analysis by Application
  • Figure 55: South Asia & Pacific Market Value Share and BPS Analysis by Country, 2025 and 2035
  • Figure 56: South Asia & Pacific Market Value Share and BPS Analysis by Type, 2025 and 2035
  • Figure 57: South Asia & Pacific Market Y-o-Y Growth Comparison by Type, 2025-2035
  • Figure 58: South Asia & Pacific Market Attractiveness Analysis by Type
  • Figure 59: South Asia & Pacific Market Value Share and BPS Analysis by Application, 2025 and 2035
  • Figure 60: South Asia & Pacific Market Y-o-Y Growth Comparison by Application, 2025-2035
  • Figure 61: South Asia & Pacific Market Attractiveness Analysis by Application
  • Figure 62: Middle East and Africa Market Value Share and BPS Analysis by Country, 2025 and 2035
  • Figure 63: Middle East and Africa Market Value Share and BPS Analysis by Type, 2025 and 2035
  • Figure 64: Middle East and Africa Market Y-o-Y Growth Comparison by Type, 2025-2035
  • Figure 65: Middle East and Africa Market Attractiveness Analysis by Type
  • Figure 66: Middle East and Africa Market Value Share and BPS Analysis by Application, 2025 and 2035
  • Figure 67: Middle East and Africa Market Y-o-Y Growth Comparison by Application, 2025-2035
  • Figure 68: Middle East and Africa Market Attractiveness Analysis by Application
  • Figure 69: Global Market - Tier Structure Analysis
  • Figure 70: Global Market - Company Share Analysis

Frequently Asked Questions

What is the projected size of the plaster accelerator market by 2035?

The market is expected to reach USD 587.9 million by 2035.

What is the CAGR of the plaster accelerator market from 2025 to 2035?

The global market is projected to grow at a CAGR of 6.7% during this period.

Which type holds the highest share in the plaster accelerator market in 2025?

Gypsum plaster is expected to lead with a 62% market share in 2025.

What is the projected share of residential segment in the plaster accelerator market?

Residential segment is expected to account for 48% of the market in 2025.

Which country is projected to grow fastest in the plaster accelerator market?

Germany is anticipated to be the fastest-growing country, with a CAGR of 6.9% through 2035.

Explore Similar Insights

Future Market Insights

Plaster Accelerator Market